
Mono-Diglyceride Fractions in Indonesian Infant Formula Products
Didah Nur Faridah
1,2
, Nadirah Farid Baktir
1
, Ria Noviar Triana
1,2
and Nuri Andarwulan
1,2
1
Department of Food Science and Technology, IPB University, Indonesia
2
Southeast Asian Food and Agricultural Science and Technology Center (SEAFAST), IPB University, Indonesia
Keyword: Diglycerides, Infant Formula Products, Triglycerides.
Abstract: Infant formula contains fat derived from a mixture of vegetable oils, which act as external source of fat. Oil
or fat is an ester of fatty acid glycerol. This work aimed at quantifying the content of triglycerides (TAG),
diglycerides (DAG) and monoglycerides (MAG) in Indonesian infant formula products. We observed infant
formula in BPOM depository (year 2018), then stratified random sampling was applied to determine samples
used. Fat content in all samples (50 products) was determined, as well as profile of acylglycerols. All 50
samples were then classified according to food category No. 13.1 (Standard of BPOM), resulting in 4 main
groups: infant formula (FB, n = 11.21%), advanced formula (FL, n = 16.32%), growth formula (FP, n =
15.30%) and special formula (FK, n = 8.17%). As the results, some samples possessed a high content of MAG
and DAG, in which they might be added as emulsifiers. In addition, correlation coefficient between DAG
content and proportion of palm oil in samples was recorded at R
2
0.4 to 0.7, suggesting that higher level of
palm oil would increase DAG content. PCA analysis clearly separated the distribution of DAG and TAG into
6 groups that exerted different characteristics of each group.
1 INTRODUCTION
Infant formula is included in the food category
number 13.0, namely food products for special
purposes, which mean that it needs a particular
processing or formulation to preserve nutritions
available for treatment of diseases or disorders
(Republic of Indonesia Food and Drug Supervisory
Agency, 2015). Based on the food category (Republic
of Indonesia Food and Drug Supervisory Agency,
2015), Formula milk is divided into several types
including infant formula, advanced formula and
special medical formula.
Infant formula contains protein, carbohydrates,
fats, vitamins and minerals. Generally, infant formula
is made from cow's milk which is modified and
fortified with other nutrients. An additional source of
fat used in infant formula particularly includes a
variety of vegetable oils, such as palm oil, coconut
oil, soybean oil, sunflower seed oil and corn oil
(Delplanque et al., 2015). However, detail
information on food label related to this fat additive
is often unclear. Oil or fat constitutes an ester of
glycerol and fatty acids, composed of a mixture of
most triglycerides (TAG) and a small number of other
compounds, including diglycerides (DAG) and
monoglycerides (MAG), free fatty acids, pigments,
sterols, hydrocarbons, phospholipids, lipoproteins.
The physical, chemical and functional properties
of oil or fat are determined by the profile of
triglycerides and their fatty acid composition (Da
Silva et al., 2010). MAG and DAG can be one of the
factors that affect oil quality standards. MAG and
DAG are minor components in oil that can be formed
not only through lipase hydrolysis by TAG during the
ripening, harvesting and transportation of fruit or
seeds, but also through the pyrolysis of TAG at high
temperatures, including conventional heating and
deodorization (Shimizu et al., 2012). High level of
MAG and DAG in vegetable oil represent a reduced
quality. Regardless source of oils, distribution of
MAG and TAG may differ, but commonly, the
proportion of MAG is lower than that of DAG
(Pacheco et al., 2014). In addition, the presence of
DAG in infant formula could cause the formation of
3-MCPDE compounds (Hamelet et al., 2014). This
compounds can cause a damage to the kidneys and
testicles in experimental animals (Abraham et al.,
2013; Liu et al., 2012).
Faridah, D., Baktir, N., Triana, R. and Andarwulan, N.
Mono-Diglyceride Fractions in Indonesian Infant Formula Products.
DOI: 10.5220/0009977800002833
In Proceedings of the 2nd SEAFAST International Seminar (2nd SIS 2019) - Facing Future Challenges: Sustainable Food Safety, Quality and Nutrition, pages 31-37
ISBN: 978-989-758-466-4
Copyright
c
2022 by SCITEPRESS – Science and Technology Publications, Lda. All rights reserved
31

2 MATERIALS AND METHODS
Chemicals for analysis included standard monolaurin,
a mixture of chloroform methanol (2:1) (Merck),
heptane (Merck), acetone (Merck), NaCl (Merck)
0.88%, N-methyl-N-
trimethylsilytrifluorocoacetamide, technical N
2
gas
andtetrahydrofuran (Merck).
The main instrument used was Gas
Chromatrography (Hawlett Packard) with DB-5HT
column type (15 m × 320 nm), thickness = 0.1 µm and
Flame Ionization Detector type detector.
2.1 Methods
2.1.1 Sample Identification and Sampling
The infant formula database was online-accessed in
www.pom.go.id, finding 361 registered products.
They were then categorized according to BPOM, in
which formula milk belonged to Food Category No.
13 (Regulation No. 1/2015), known as food products
for special nutritional needs. Specifically, it was
included in No. 13.1. The formula product in this
category is generally divided into 3 classes, namely
infant formula (13.1.1), advanced formula (13.1.2),
and infat formula for special medical use (13.1.3).
The sample size was determined from Slovin method
or the √N + 1 method as in Eq. 1.
n
(Eq. 1)
where N is total population; d is confidence level
(10%); and n is number of sample.
In this work, stratified random sampling method
was applied, enabling to divide the population into
smaller groups. These groups were classified
according to particular attributes or characteristics
within population. Subsequently, proportional
amount of sample was selected between groups.
Samples were taken randomly and proportionally at
each layer (category). The number of samples taken
in this study amounted to 50 samples. The Microsoft
Excel 2010 application was employed for random
sampling from each category using the formula "=
RANDBETWEEN (lower limit; upper limit)". Every
selected registered formula milk brand was taken 2
batches (different production codes) as a test, and
each test was analyzed 2 times. Products are
purchased from markets in Bogor, West Java,
Indonesia.
2.1.2 Fat Extraction
Extraction was carried out according to (Abraham et
al., 2013). Sample (24 g) was macerated in 60 mL of
chloroform and methanol solution (2:1) for 120 min
while stirring using a magnetic stirrer. The
maceration mixture was filtered using Whatman filter
paper with the help of a vacuum pump, then the
filtrate solution was added with 32 mL of 0.88% Cl
and shaken to produce two layers. The lower layer
(oil phase) was collected using filtration with a filter
paper, then evaporated using rotary vacuum
evaporator at 40°C to remove solvent residue.
Afterwards, the extraction product was concentrated
by blowing N
2
gas to eliminate the remaining solvent.
The oil was stored in a dark bottle, tightly closed with
parafilm coated and stored at 4°C until subsequent
analysis. Fat content was calculated as in Eq. 2.
Fatcontent
%
100% (Eq. 2)
where Wt is mass of extracted oil (g) and W0 is
sample mass (g)
2.1.3 Determination of Acylglycerol
Composition
Composition of acylglycerol was determined using
Gas Chromatography (Hawlett Packard Series 6890)
with Flame Ionization Detector, operated according
to AOCS Official Method Cd 11b-91 2003 (Liu et al.,
2012). The column used was DB-5HT (15 m × 320
nm) with thickness of 0.1 µm. The carrier gas used
was helium, while the make up gas was N
2
. Gas
chromatography apparatus was equipped with split
injection or injection column and FID, and run at
following conditions: initial column temperature of
50°C increased to 180°C at rate of 15°C·min
-1
, then
subsequently increased to 230°C at rate of 7°C·min
-1
,
and increased again to 380°C, the temperature for
detector and injector was set at 390°C with velocity
of carrier gas 0.7 mL N
2
·min
-1
, while the air flow
velocity was 450 mL·min
-1
with injection
volume of 1 µ.
Briefly, sample (0.0250-0.0255 g) was transferred
in vial, then added with 10 μL of tetrahydrofuran and
50 µL of N-methyl-N-trimethylsilyl-
trifluoroacetamide. After that, the tube was closed,
mixed using vortex at 2400 rpm for 90 sec. The
mixture was incubated in a dark room for 10 min,
added with 2 mL of heptane, then mixed at 2000 rpm
for 30 sec. The sample tube was covered with
parafilm, then incubated at room temperature for
approximately 30 min prior to injection at volume of
1 µL.
2nd SIS 2019 - SEAFAST International Seminar
32
DAG in product =
100(g)
(Eq. 3)
DAG + MAG (g/100mL) = DAG + MAG
(Serving size) (Eq. 4)
2.1.4 Data Analysis
The resulting data were statistically evaluated using
Analysis of Variance (ANOVA) in SPSS software.
Significance among means was verified using DMRT
(Duncan Multiple Range Test) at p<0.05. Proportion
of palm oil, diglycerides and triglycerides was
determined by multivariate using Pricipal Component
Analysis (PCA) in XLSTAT 2018 application.
3 RESULTS
3.1 Sample Identification and
Sampling
Among 361 infant formula products listed in BPOM,
we observed that advanced formula became the most
abundant product, i.e. 223 items (62%), while infant
formula and formula for special medical use was 77
(21%) and 61 (17%) items, respectively. The category
“advanced formula” is divided into two categories,
i.e. formula for ages 6-12 months (advanced formula)
and formula for 1-3 years (growth formula).
Previously, have been also reported categories of
formula products by the age: 0-6 months, 6-12
months, and 1-3 years (Liu et al., 2012). In this study,
we investigated 50 samples of milk formula.
3.2 Fat Content
Content of fat showed a noticeable difference
between samples, in which the highest one was
attributed to infant formula (FB10), reaching up to
25.86%, then advanced formula (FL9), i.e. 23.61%,
growth formula (FP4), i.e. 20.10%, and then special
formula (FK3), i.e. 25.64% (Table 1).
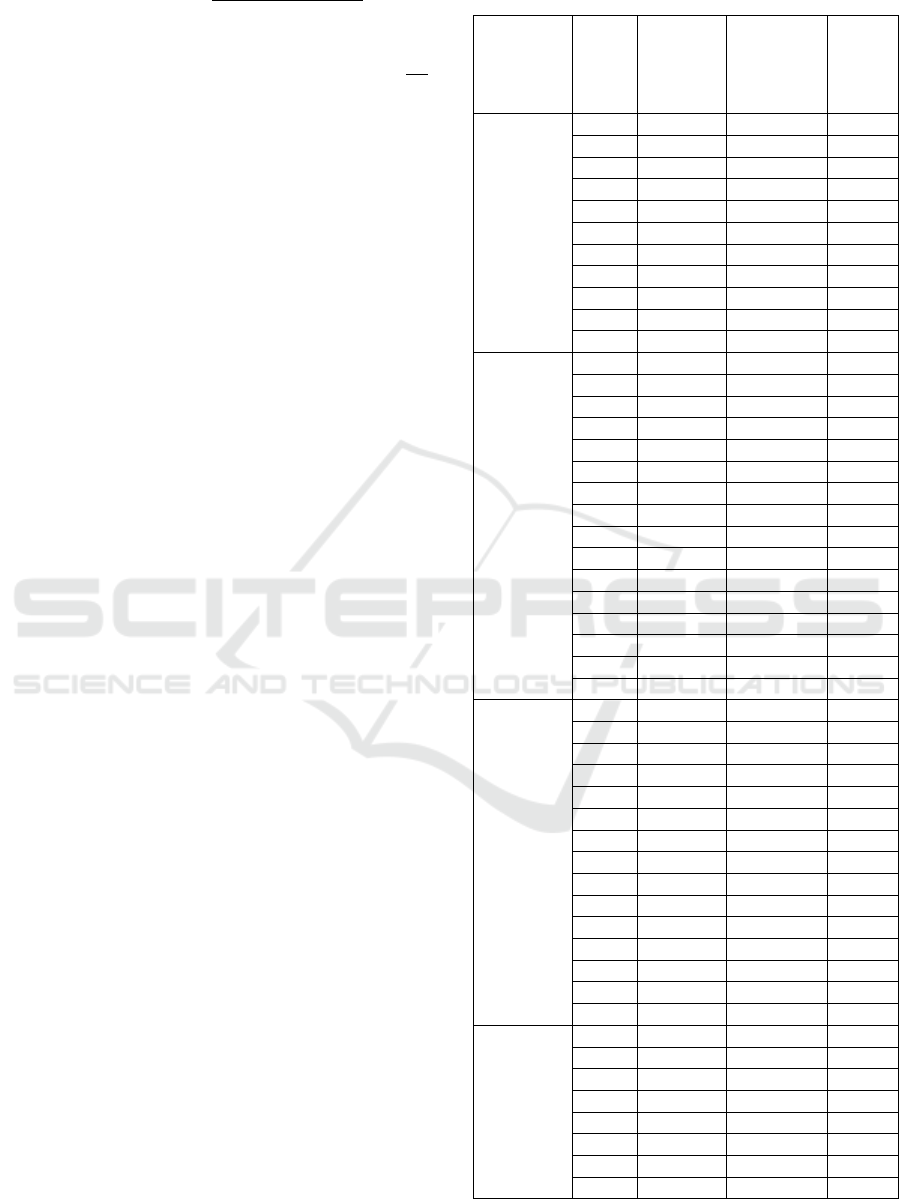
Table 1: Fat content of formula milk samples.
Categories Code
Weight of
sample [g]
Weight of
sample
extract
[g]
Fat
content
[%db]
Infant
Formula
FB1 24.03 4.24 18.01
FB2 24.02 5.26 22.10
FB3 24.02 5.08 21.56
FB4 24.12 4.52 19.09
FB5 24.06 5.11 21.61
FB6 24.11 5.26 22.16
FB7 24.03 5.56 23.54
FB8 48.02 4.91 10.40
FB9 24.02 5.52 23.44
FB10 24.05 6.13 25.86
FB11 24.00 5.36 22.73
Advanced
formula
FL1 24.04 4.40 18.60
FL2 24.00 4.74 20.12
FL3 24.03 5.19 21.77
FL4 24.09 4.34 18.18
FL5 24.02 5.40 22.95
FL6 24.04 4.14 17.61
FL7 42.06 2.79 6.82
FL8 24.05 3.97 16.94
FL9 24.05 5.58 23.61
FL10 24.10 3.59 15.20
FL11 24.01 5.26 22.35
FL12 24.02 4.22 17.99
FL13 24.01 4.48 18.84
FL14 42.05 3.20 7.76
FL15 24.01 4.44 18.77
FL16 24.02 4.41 18.75
Growth
Formula
FP1 42.03 2.15 5.24
FP2 45.04 2.32 5.26
FP3 24.01 4.11 17.33
FP4 24.18 4.82 20.10
FP5 24.03 3.19 13.58
FP6 24.03 3.72 15.80
FP7 24.03 2.99 12.72
FP8 45.78 3.41 7.62
FP9 24.02 3.38 14.38
FP10 30.01 1.56 5.33
FP11 24.06 2.85 12.10
FP12 45.02 2.91 6.58
FP13 30.02 3.99 13.57
FP14 30.03 5.62 19.09
FP15 30.59 3.68 12.25
Special
Formula
FK1 42.06 5.29 12.9
FK2 45.02 2.79 6.30
FK3 24.00 6.06 25.64
FK4 30.35 2.29 7.68
FK5 42.03 1.70 4.11
FK6 42.06 2.45 5.96
FK7 48.47 2.10 4.44
FK8 42.02 9.38 22.68
Mono-Diglyceride Fractions in Indonesian Infant Formula Products
33
3.3 Composition of Acylglycerol
Fraction
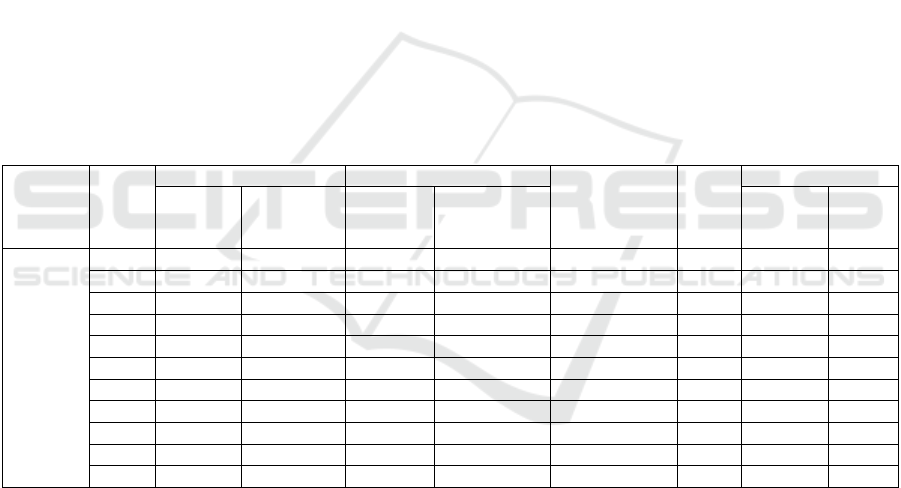
The results demonstrated that MAG was only found
in FB11, reaching up to 0.13% (Table 2). This
compound is intentionally incorporated by
manufacture as it occurs on the label. Furthermore,
DAG ranged from 0.3 to 1.8%, with an average of
1.67%. meanwhile, TAG was found at range of 83-
97%, with an average of 92.32%.
The distribution of MAG, DAG and TAG in
advanced formula samples is presented in Table 3.
The results exhibited that FL15 and Fl16 became two
samples that contained MAG, i.e. 0.35% and 0.26%,
respectively. In fact, both products confirmed
presence of MAG, as written on the label.
Furthermore, DAG in advanced formula samples
ranged from 0.4 to 4.3%, with an average of 1.17%.
The DAG content is greater than 4%, while the 3-
MCPD ester level is generally greater than 5 ppm.
The TAG content in the sample of the advanced
formula category occured between 78-100%, with an
average of 94.09%.
Table 4 presents the content of MAG, DAG, and
TAG in growth formula category. Our data revealed
that two samples (FP13 and FP15) were evidenced to
contain MAG at 0.16% and 0.81%, respectively.
Additionally, producers of both samples did not
provide information on the label related to addition of
MAG. DAG was found at range of 0.1-1.8%, with an
average of 0.69%. The highest DAG content was
detected in FP5, no information was given on the
label. Afterwards, TAG ranged from 86 to 100%,
with an average of 94.3%. In terms of special formula
category, one sample was evidenced to contain MAG,
i.e. FK7 (3.78%). However, manufacture has declared
the addition of was found at 91-100%, with an
average of 96.27%. We also detected percentage of
TAG reaching up to 100%, found in FK3, FK6 and
FK8. This presumably represents administration of
Medium Chain Triglyceride (MCT) in the sample
(AOCS Official Method Cd 11b-91, 2003). MAG
since it occurred on the label. For DAG, it ranged
from 0.1 to 0.4%, with an average of 0.34%, while
proportion of TAG
.
Table 2 : The content of MAG, DAG, TAG and label composition in samples of infant formula categories.
Category Sample
MAG DAG DAG+MAG
(g/100mL
ready to eat
product)
TAG
% in
fat/oil
Label composition
% in oil % in product % in oil % in product MAG MCT
Infant
Formula
FB1 - - 5.57 1.00 0.15 94.43 - -
FB2 - - 5.52 1.22 0.18 94.48 - -
FB3 - - 2.70 0.58 0.08 97.30 - -
FB4 - - 5.70 1.09 0.16 94.30 - -
FB5 - - 7.76 1.68 0.25 92.24 - -
FB6 - - 13.71 3.04 0.45 86.29 - -
FB7 - - 12.33 2.90 0.42 87.67 - -
FB8 - - 3.69 0.38 0.06 96.31 - -
FB9 - - 3.73 0.87 0.13 96.27 - -
FB10 - - 6.85 1.77 0.25 93.15 - -
FB11 0.55 0.13 16.95 3.85 0.57 83.05 √ -
2nd SIS 2019 - SEAFAST International Seminar
34
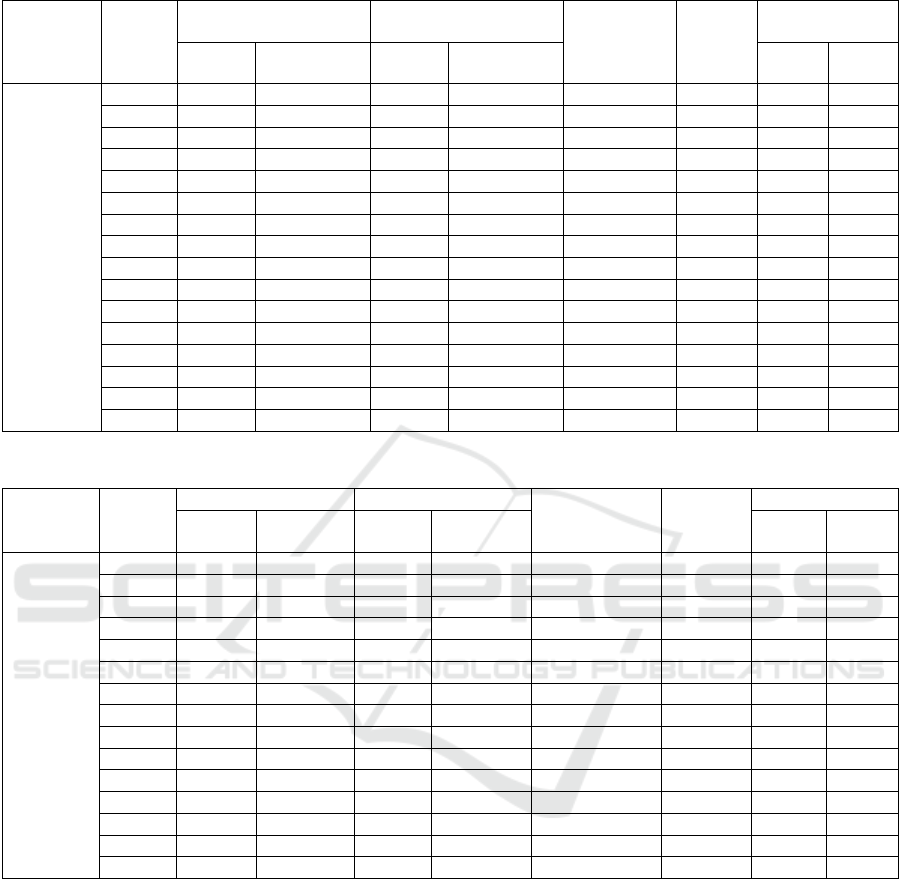
Table 3: The content of MAG, DAG, TAG and label composition in samples of advanced formula categories.
Categories Sample
MAG DAG
DAG+MAG
(g/100mL
ready to eat
product)
TAG
%in fat/
oil
Label
composition
% in oil % in product % in oil % in product MAG MCT
Advanced
Formula
FL1 - - 5.74 1.07 0.15 94.26 - -
FL2 - - 21.74 4.37 0.62 78.26 - -
FL3 - - 6.08 1.32 0.22 93.92 - -
FL4 - - 2.73 0.50 0.08 97.27 - -
FL5 - - 2.96 0.68 0.11 97.04 - -
FL6 - - - - - 100 - -
FL7 - - 6.17 0.42 0.06 93.83 - -
FL8 - - - - - 100 - -
FL9 - - 3.27 0.77 0.12 96.73 - -
FL10 - - 4.90 0.74 0.11 95.10 - -
FL11 - - 6.11 1.37 0.22 93.89 - -
FL12 - - 13.99 2.52 0.38 86.01 - -
FL13 - - 2.81 0.53 0.09 97.19 - -
FL14 - - 5.70 0.44 0.14 94.30 - -
FL15 1.84 0.35 3.12 0.59 0.13 95.05 √ -
FL16 1.40 0.26 6.00 1.13 0.20 92.60 √ -
Table 4: The content of MAG, DAG, TAG and label composition in samples of growth formula categories.
Categories Sample
MAG DAG
DAG+MAG
(g/100mL ready
to eat product)
TAG % in
fat/
oil
Label composition
% in oil
% in
product
% in oil
% in
product
MAG MCT
Growth
Formula
FP1 - - 5.93 0.31 0.06 94.07 - -
FP2 - - 3.11 0.16 0.03 96.89 - -
FP3 - - 3.56 0.62 0.08 96.44 - -
FP4 - - - - - 100 - -
FP5 - - 13.40 1.82 0.36 86.60 - -
FP6 - - 9.14 1.44 0.24 90.86 - -
FP7 - - 6.00 0.76 0.15 94.00 - -
FP8 - - 5.65 0.43 0.07 94.35 - -
FP9 - - 6.42 0.92 0.16 93.58 - -
FP10 - - 3.56 0.19 0.03 96.44 - -
FP11 - - 2.88 0.35 0.06 97.12 - -
FP12 - - 3.15 0.21 0.03 96.85 - -
FP13 1.17 0.16 2.90 0.39 0.10 95.93 √ -
FP14 - - 8.43 1.61 0.24 91.57 - -
FP15 6.59 0.81 3.61 0.44 0.23 89.80 - -
3.4 Coefficient Correlation between
Levels of Palm Oil and Diglyceride
The coefficient correlation between the proportion of
palm oil and DAG content in samples of infant
formula was depicted in Figure 1A. The test results
showed a linear curve with the equation y = 0.4547x
- 2.2717 with R
2
= 0.4789, suggesting that proportion
of palm oil positively correlates with level of DAG.
In case of advanced formula, the linear curve was
arranged with the equation y = 0.0459x + 0.3131, and
R
2
= 0.4017 (Figure 1B). Similarly, higher proportion
of palm oil also resulted in a higher level of DAG. For
growth formula category, the equation was y =
0.1176x - 0.1426, with R
2
= 0.7774 (Figure 1C),
indicating that content of DAG increases as more
palm oil is added.
Mono-Diglyceride Fractions in Indonesian Infant Formula Products
35
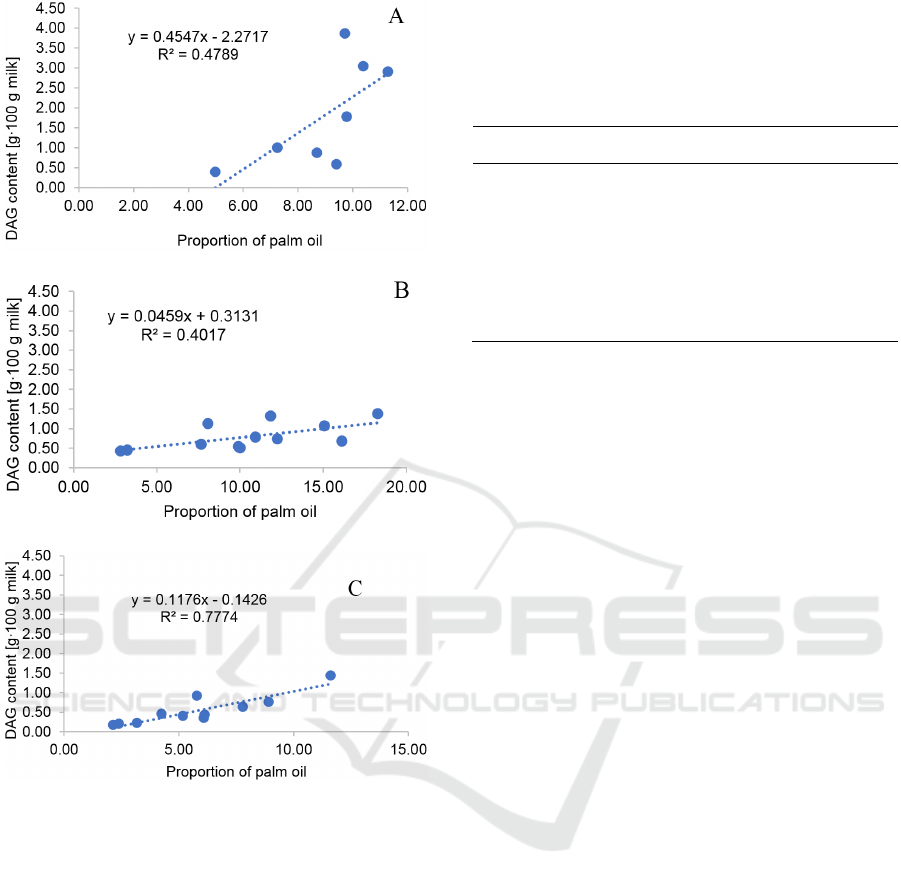
Figure 1: Plot of palm oil and DAG content in three groups
of samples: infant (A), advanced (B) and growth (C)
formula.
3.5 PCA Analysis
As depicted in Table 5, there is a significant
difference between content of DAG, TAG content
and proportion of palm oil for each groups. Group A
showed the lowest proportion of palm oil compared
to other groups; on the contrary, group B had the
highest level of DAG among groups. Meanwhile, the
highest proportion of palm oil was detected in group
C. The discrepancy between group D and E occured
in the gradient of group E closing to TAG gradient,
which means that TAG in group E is higher than in
group D. Furthermore, gradient of group D is also
close to DAG gradient, suggesting that DAG in group
D is higher than group E. Group F has the highest
TAG content, i.e. 100%. This links to the use of
medium chain triglycerides (MCT), while also
contains lower amount of palm oil compared to other
groups.
Table 5: Distribution of diglycerides and triglycerides.
Groups n DAG TAG
Palm Oil
Proportion
A 3 9.86 ± 3.08
d
90.14 ± 3.08
b
0.00 ± 0.00
a
B 7 13.81 ± 4.51
e
86.19 ± 4.51
a
46.57 ± 11.24
c
C 6 5.60 ± 0.40
c
94.40 ± 0.40
c
71.00 ± 1.10
d
D 12 5.77 ± 1.00
c
93.25 ± 1.28
c
42.17 ± 8.12
c
E 16 3.16 ± 0.33
b
96.66 ± 0.58
d
45.31 ± 6.64
c
F 6 0.00 ± 0.00
a
100.00 ± 0.00
e
28.67 ± 22.46
b
4 DISCUSSION
MAG is a common emulsifiers applied in milk-based
recombination products such as infant formula. In
short, presence of MAG in sample is associated with
its functionality as emulsifiying agent. Maximum
threshold of mono-diglycerides as emulsifier in infant
formula is 0.4g·100mL
-1
Sun et al., 2016). Our data
revealed that content of these chemicals in 27.27% of
samples was evidenced to be much higher than
standard, i.e. FB6, FB7 and FB11. The product does
not include an emulsifier in its composition. The high
content of MAG and DAG that exceeds the limit
possibly results from vegetable oil which does not fit
the requirements. The existence of MAG and DAG
depends on the process, storage and shelf life of the
oil Risma et al., 2019) or the condition of raw
materials that did not meet standard. Besides, they are
added intentionally by manufacturers to give
emulsifying properties, but not mentioned in list of
composition.
The high content of DAG needs to receive serious
concern related to its potentiality as precursor for the
formation of 3 MCPD esters (CODEX Alimentarius,
2017). MAG and DAG in samples studied are used as
emulsifiers. Compared to standard of Codex, we
found 16 samples (6.25%) did fit the criteria (>
0.4g·100mL
-1
), meanwhile FL2 showed no
compliance with regulations because the product did
not include the addition of emulsifiers. Based on
regulation issued by Codex Sun et al., 2016), we
concluded that all samples of growth formula
categories met the standard regarding to addition of
MAG and DAG. Compared to regulation of Codex
Sun et al., 2016), level of MAG and DAG present in
all samples of special formula is accordance with the
standard.
2nd SIS 2019 - SEAFAST International Seminar
36

5 CONCLUSION
Categorization of 50 samples based on food category
No. 13.1 resulted in 4 major classes: infant formula (n
= 11.21%), advanced formula (n = 16.32%), growth
formula (n = 15.30 %) and formula for special
medical purposes (n = 8.17%). The experiment
successfully detected presence of MAG and DAG in
samples, which might be linked to intentional
addition by manufacture considering their function as
emulsifiers. Besides, the results found 27.27% of
infant formula samples and 6.25% of advanced
formulas containing MAG and DAG that exceed the
maximum threshold of Codex. This presumably
relates to hydrolysis of vegetable oils used in the
samples, and may be intentionally added as
emulsifiers despite not mentioned on label. PCA
analysis successfully mapped proportion of palm oil,
MAG, DAG and TAG into 6 groups, having
distinctive feature for each group.
REFERENCES
Republic of Indonesia Food and Drug Supervisory Agency.
Food Cathegory. Jakarta (ID): Republic of Indonesia
Food and Drug Supervisory Agency, 2015.
Delplanque, B. ‒ Gibson, R. ‒ Koletzko, B. ‒ Lapillonne,
A. ‒ Strandvik, B.: Lipid quality in infant nutrition:
current knowledge and future opportunities. J Pediatr
Gastroenterol Nutr. 61(1), 2015, pp. 8‒17. DOI:
10.1097/MPG.0000000000000818.
Da Silva, R.C. ‒ Soares, D.F. ‒ Lourenço, M.B. ‒ Soares,
F.A.S.M. ‒ Da Silva, K.G. ‒ Gonçalves, M.I.A. ‒
Gioielli, L.A.: Structured lipids obtained by chemical
interesterification of olive oil and palm stearin. Food
Sci Technol LEB., 43, 2010, pp. 752–758. DOI:
10.1016/j.lwt.2009.12.010.
Shimizu, M. ‒ Vosmann, K. ‒ Matthaus, B.: Generation of
3-monochloro-1,2- propanediol and related materials
from tri-, di-, and monoolein at deodorization
temperature. Eur J Lipid Sci Technol, 114, 2012, pp.
73-1268. DOI: 10.1002/ejlt.201200078.
Pacheco, C. ‒ Palla, C. ‒ Crapiste, G.H. ‒ Carrin, M.E.:
Simultanous quantitation of FFA, MAG, DAG, and
TAG in enzymatically modified vegetable oils and fats.
Food Anal. Methods. 2014, pp. DOI: 10.1007/s12161-
014-9830-x.
Hamlet, C.G‒Asuncion, L. ‒Velbek, J. 2011. Formation
and occurance of esters 3- chloropropane-1,2-diol (3-
CPD) in foods : what we know and what we assume.
Eur J Lipid Sci Tech. 113: 374-379. DOI:
10.1002/ejlt.201000480.
Abraham, K. ‒Appel K,E. ‒Berger P,E. ‒Apel, E. ‒Gerling,
S‒Mielke, H. ‒2013. Relative oral bioavailability of 3-
MCPD from 3-MCPD fatty acid esters in rats. Arch
Toxicol. 87 (4). DOI: 10.1007/s00204-012-0970-8.
Liu, M. ‒Gao B,Y. ‒Wu P,P. ‒Shi, H, M. ‒Luo , W. 2012.
Acute oral toxicity of 3- MCPD mono- and di-palmitic
esters in Swiss mice and their cytotoxicity in NRK-52E
rat kidney cells. Food Chem Toxicol. 50(10): 785-3791.
DOI: 10.1016/j.fct.2012.07.038.
AOCS Official Method Cd 11b-91. Official Methods and
Recommended Practices of the AOCS. 5
th
edition.
Illinois (US): AOCS, 2003.
Sun, C. ‒ Zou, X. ‒ Yao, Y. ‒ Jin, J. ‒ Xia, Y. ‒ Huang, J.
‒ Jin, Q. ‒ Wang, X.: Evaluation of fatty acid
composition in commercial infant formulas on the
Chinese market: a comparative study based on fat
source and stage. Int Dairy J., 63, 2016, pp. 42‒51.
DOI: 10.1016/j.idairyj.2016.07.015.
Risma, R.Y.: Triacylglycerol profile of infant formulas in
Indonesia. Minithesis. Bogor (ID): Department of Food
Science and Technology. IPB University, 2019.
CODEX Alimentarius. Standard ForFollow-Up Formula.
Rome (IT): Codex Alimentarius, 2017.
Mono-Diglyceride Fractions in Indonesian Infant Formula Products
37
