
Sensory Profile of Commercial Coffee Products using QDA
(Quantitative Descriptive Analysis), Flash Profile, and CATA
(Check-All-That-Apply) Methods
Dase Hunaefi
1,2
, Windi Khairunnisa
1
, Zen Fauzan Sholehuddin
3
and Dede R. Adawiyah
1,2
1
Department of Food Science and Technology, IPB University (Bogor Agricultural University), Indonesia
2
SEAFAST Center, IPB University, Indonesia
3
Sensory Department, Mane, Indonesia
Keywords: CATA, Coffee, Consumer, Expert, Flash profile, QDA.
Abstract: This research was conducted to get sensory profile of eleven commercial coffee samples using the QDA
(Quantitative Descriptive Analysis) method with expert panelists and Flash Profile and CATA (Check-All-
That-Apply) methods using consumer panelists, then comparing the results of the three methods. Results of
the three methods were analyzed using XLSTAT software. The four RTD coffee samples have nearly identical
sensory profiles based on the QDA method by expert panelists. The four samples tend to have vanilla, creamy,
caramel, and milky dominant profiles. The other one RTD coffee sample have dominant in bean attribute.
IPD commercial coffee samples have more dominant in coconut, bitter, and roasted sensory profile than RTD
coffee. Sensory profiles of commercial coffee obtained using the consumer panel on both methods CATA and
flash profile giving quite different results. CATA and flash profile methods can’t replace the QDA method in
terms of testing which required high sensitivity. However, if a quick sensory product profile determination is
required, then it is better to apply CATA method. Expert panelists are selected panelists with sensory
sensitivity who have gone through training and have experience in sensory testing, which is able to provide
consistent and repeated sensory assessments of various products. This study investigates how consumer
panelists performing in flash profile and CATA method, compare to expert panelists using QDA method to
determine sensory profile of a product. This study aims to find alternative methods that can be used if expert
panelists are not available and rapid determination of sensory profile is needed. This sensory evaluation can
be used for various purposes, for example is for product development.
1 INTRODUCTION
Coffee is a major tropical commodity traded
throughout the world with a contribution of half of
the total tropical commodity exports. The popularity
and attractiveness of the world towards coffee is
mainly due to its unique taste and is supported by
historical, traditional, social and economic interests
(Triyanti, 2016). Coffee drinks, beverages made
from coffee bean extract, are one of the most famous
types of drinks. In addition to its benefits, coffee also
popular because it has a distinctive taste and aroma
(Farida et al., 2013).
Coffee is a drink that contains caffeine. Many
benefits can be obtained by consuming coffee.
Caffeine in the coffee can increase the body's
metabolic rate. For some people with routines that
require them to be active at night, coffee can be a
good alternative to drinks because the caffeine
content can overcome drowsiness (Panggabean,
2011). Coffee can be useful as an antioxidant,
stimulates brain performance and as an anticancer
substance (Farida et al., 2013). Coffee can also
reduce fatigue, increase freshness, and make you feel
more excited (Towaha et al., 2012).
Indonesia is the fourth largest producer and
exporter of coffee in the world after Brazil, Vietnam
and Colombia. In 2016 to 2020, Indonesian coffee
production is expected to increase with an average
growth of 2.25% per year (Triyanti, 2016). Data from
the International Coffee Organization (ICO) shows
that Indonesia's coffee consumption in the period
2000-2016 experienced an upward trend. In 2000,
Indonesian coffee consumption only reached 1.68
million bags (packs) @ 60 kg, but in 2016 had
20
Hunaefi, D., Khairunnisa, W., Sholehuddin, Z. and Adawiyah, D.
Sensory Profile of Commercial Coffee Products using QDA (Quantitative Descriptive Analysis), Flash Profile, and CATA (Check-All-That-Apply) Methods.
DOI: 10.5220/0009977500002833
In Proceedings of the 2nd SEAFAST International Seminar (2nd SIS 2019) - Facing Future Challenges: Sustainable Food Safety, Quality and Nutrition, pages 20-30
ISBN: 978-989-758-466-4
Copyright
c
2022 by SCITEPRESS – Science and Technology Publications, Lda. All rights reserved

reached 4.6 million bags @ 60 kg. Even from 2011
to 2016, Indonesian coffee consumption has always
experienced growth (ICO, 2018). There are various
forms of coffee in the market, including instant
coffee and ready to drink coffee. Instant coffee is a
dry product that is easily soluble in water, obtained
by extracting roasted and ground coffee beans.
Instant coffee can also be made with the composition
of coffee, sugar, cream, milk or by adding flavor
(Dewi et al., 2009). Ready to drink coffee are drinks
made from a mixture of coffee extracts and drinking
water with or without the addition of other food
ingredients and food additives that are permitted,
hermetically packaged. Habits or lifestyles of people
who want practicality lead to increased public
consumption of coffee in the form of instant coffee
and ready to drink coffee.
A description of the product's sensory
characteristics has become an integral part of food
and beverage companies. Information obtained from
the description of the sensory characteristics of the
product allows the company to make more informed
business decisions, becoming a reference in
development of ideal products according to
consumers, knowing the effects of changes in
formulas and processes, and useful for quality control
purposes (Varela & Ares, 2012). Description tests are
used to identify important sensory characteristics in
a product and provide information about the intensity
of these characteristics (Poste et al., 2011). One of
the description test methods commonly used is
Quantitative Descriptive Analysis (QDA). The QDA
method is carried out based on the principle of the
ability of train panelists to measure specific attributes
of a product to obtain a comprehensive quantitative
product description (Chapman et al., 2001).
The availability of trained panelists to carry out
the description test is quite limited because it is
obtained through a training process with relatively
expensive costs, depending on the complexity of the
sample (Varela & Ares, 2012). According to ISO
8586 (2012), sensory panels are "measuring
instruments", where the results obtained are highly
dependent on the performance of its members. ISO
8586 classifies sensory panels into 3: (1) sensory
assessors or untrained sensory panels; (2) selected
assessors or sensory panels that pass the selection
process; (3) expert sensory assessors or sensory
panels that have passed performance testing. The
high cost, length of time, and availability of trained
panelists or limited expert panelists led to the need
for faster and more flexible sensory methods using
untrained panelists (Varela & Ares, 2012).
Previous studies have been conducted to compare
sensory evaluation methods using trained panelists
and sensory profiling methods using consumer
panelists. Based on the results of Bruzzone et al.
(2015) which compares the intensity scales test using
trained panelists and CATA using consumer
panelists, the result shows that the two methods
provide the same information and the CATA method
can be an alternative way to obtain information about
consumer perceptions of the product sensory
characteristics. The CATA method has some
advantages including simpler, faster, and easier. The
CATA method consists of a list of words describing
the sample, where panelists can choose sensory
attributes which can describe the sample. One
important thing in the CATA test is in determining
the attributes used in the list, because it can determine
the accuracy of the important attributes of the
product. Determination of attributes used in the list
can be obtained through several ways, such as by
trained panelists, by consumers during testing
(modification of free choice profiling), and through
Focus Group Discussion (FGD) (Dooley et al.,
2010).
According to Moussaoui & Varela (2010), the
flash profile method is an accurate method to create
sensory mapping and provide relevant results. This
method is comparable to the results of QDA method
using trained panelists. Flash profile method is a
method that can be used to obtain quick product
profiling when there are no trained panelists
available. Flash Profile method is a combination of
Free Choice Profiling and ranking test, where each
subject chooses and use they own words to evaluate
a whole set of products (Dairou & Siefferman, 2002).
This method does not require prior training to
panelists, so it can reduce the analysis time
(Montanuci et al., 2015).
2 MATERIAL AND METHOD
2.1 Samples
11 brands of Indonesian commercial coffee in the
form of instant and Ready to Drink (RTD) coffee.
2.2 Sample Preparation
Samples in the form of RTD coffee are removed from
the packaging and poured into containers, while
samples in the form of instant coffee are dissolved in
hot water first in accordance with the serving
instructions on the packaging. All samples are then
Sensory Profile of Commercial Coffee Products using QDA (Quantitative Descriptive Analysis), Flash Profile, and CATA
(Check-All-That-Apply) Methods
21

served at the same temperature as room temperature
to avoid bias. Samples were presented as much as 20
mL in a small 30 mL plastic cup that had been given
a random three-digit number code. Mineral water is
given to the panelists as neutralizers.
2.3 Procedure of QDA Method
The QDA test was conducted by 12 expert panelists.
Before the QDA test is conducted, expert panelists do
a description of the sample attributes to determine the
sensory attributes of the sample. Furthermore, QDA
testing is done by assessing the intensity of each
sensory attribute found in commercial coffee
samples. All attributes are evaluated using a 10 cm
scale (Papetti & Carelli, 2013). The testing is carried
out in stages, which is to assess two sensory attributes
for all samples in each test.
2.4 Procedure of Flash Profile Method
This method used 30 panelists who were coffee
consumers, both instant coffee and RTD coffee. Each
sample of commercial coffee products is presented as
much as 20 mL with mineral water as a neutralizer.
The panelist tasted the sample and wrote down the
sensory attributes which were contained in the sample
according to their opinion, without any instructions or
without being guided by the panel leader. After
panelists wrote down the list of attributes, they were
asked to sort the intensity of each attribute from the
entire sample (Dairou & Sieffermann, 2002).
2.5 Procedure of CATA Method
In the CATA (Check-All-That-Apply) method, there
is an ideal perception profiling according to
consumers. The panelist used was the same as the
panelist on the flash profile test, which was 30
consumer panelists with the same sample
presentation. Before tasting the sample, panelists
were asked to fill in the ideal coffee criteria column
first. Then the panelist tasted the sample and assessed
what sensory attributes were felt in the sample by
giving a check mark to the sensory attributes which
could describe the sample (Dooley et al., 2010).
Panelists were also asked to give an intensity rating
of hedonic preference.
2.6 Data Analysis
QDA method data was analyzed using XLSTAT 2016
software with PCA (Principle Component Analysis)
tools and Microsoft Excel 2016 software with spider
web tools. PCA is used to get a biplot map which
shows the correlation between commercial coffee
samples and the sensory attributes. Spider web are
used to show all profiles of the sensory attributes of a
sample. Spider web can also identify profile of
samples that are significantly different from other
samples (Rahmawati et al., 2015).
Analysis of flash profile data using XLSTAT
software with the Generalized Procrustes Analysis
(GPA) tool. Data analysis of the CATA (Check-All-
That-Apply) method using XLSTAT software with
CATA Analysis tools. Analysis of the data generated
in the form of Cochran's Q test, correspondence
analysis, Principal Coordinate Analysis (PCoA), and
penalty analysis.
3 RESULTS AND DISCUSSION
3.1 Panelists Profile
The panelists used in the QDA test were 12 expert
panelists. According to ISO 8586 (2012), the expert
sensory panel is the selected panelist with sensory
sensitivity who has passed training and has
experience in sensory testing, which is able to
provide a consistent and repeated sensory assessment
of various products.
The panelists used in the flash profile and CATA
methods were 30 consumer panelists with a ratio of
50% men and 50% women. All the panelists are
consumers of coffee products, which is instant
coffee, ready to drink coffee, or both. Panelists
generally consume coffee in the morning (37%) with
different frequency of coffee consumption. Most of
panelists consume coffee as much as 3-4 times a
week. The frequency of panelists consuming coffee
can be seen in Figure 1.
Figure 1: Aroma profile of 4 groups of cured vanilla bean.
> 1
Everyday
20%
1 time
everyday
23%
3-4 in week
33%
1-2 in week
17%
1 - 2 in
month
7%
2nd SIS 2019 - SEAFAST International Seminar
22

3.2 Sensory Profile using QDA Method
Sensory attributes that were evaluated in the QDA
method consist of 14 attributes obtained from the
Focus Group Discussion (FGD) with expert panelists.
These attributes consist of roasted, smoky, bean,
caramel, vanilla, chocolate, milky, coconut, creamy,
bitter, butter, sweet, cocoa, and salty. The results
obtained from the testing of commercial coffee
samples using the QDA method are in the form of
spider web charts that can be used to know the overall
sensory sample profile. Based on the spider web
graph in Figure 2, products that have the strongest
sweet, butter, vanilla, caramel, and salty attributes is
Nescafe Smoovlatte RTD. Products that have the
strongest roasted, smoky and bean attributes is ABC
White Coffee IPD. The strongest milky and creamy
attribute is the Luwak White Koffie RTD product,
while the Luwak White Koffie IPD product has a
stronger bitter attribute compared to other products.
Products that the chocolate attributes are more
dominant is ABC Exo RTD, while there are no
products that dominant in cocoa and coconut
attributes.
Other results that can be obtained from testing
commercial coffee samples with the QDA method are
the correlation between attributes with attributes and
attributes with samples on the PCA curve. Based on
PCA curve in Figure 3, the sensory attributes of
sweet, butter, salty, chocolate, creamy, milky, vanilla,
cocoa, and caramel are positively correlated with
each other, but negatively correlated with four other
attributes, such as bitter, smoky, roasted, and bean
because of its opposite location. Coconut attributes
have a low correlation to other attributes, because the
location is far apart and contradicts all other sensory
attributes.
The correlation between attributes and the sample
in Figure 3 can show the dominant characteristics of
each product. Nescafe Smoovlatte RTD has a
dominant vanilla attribute with a score of 5.79, while
ABC Exo RTD has dominant attributes of creamy,
chocolate, and milky (5.55, 4.46, 4.23). Good Day
Moccacino RTD has dominant characteristics of
vanilla (5.03) and caramel (4.73), while Good Day
Moccacino IPD has dominant characteristics of bitter
(3.31) and coconut (3.27). Luwak White Koffie RTD
has the characteristics of creamy, milky, and vanilla
(6.25, 5.55, 3.77), while Luwak White Koffie IPD has
a different dominant characteristic, which is bitter
(5.90). Kopiko 78 RTD is dominant in bean attributes
(5.20) and Nescafe IPD dominant in roasted attributes
(5.16). Indocafe Coffeemix IPD coffee has the
characteristics of bitter (3.61) and coconut (3.34).
Torabika Cappuccino IPD is not adjacent to any
sensory attribute on the PCA curve but has dominant
creamy attribute with a score of 5.28.
3.3 Sensory Profile using Flash Profile
Method
Flash profile method using 30 consumer panelists and
generate a total of 22 different sensory attributes.
Sensory attributes obtained are roasted, creamy,
milky, sweet, bitter, caramel, coffee, viscosity, sour,
nutty, vanilla, chemical, floral, coconut, honey, fruity,
smoky, rum, chocolate, color, mocca, and mouthfeel.
The results are processed using GPA, including
the PCA curve which can be seen in Figure 4. If all
attributes of the flash profile test are used to process
the data, many attributes accumulate on the PCA
curve and it is difficult to determine the exact sensory
characteristics for each sample. Therefore, the data
processing is done by using sensory attributes which
are widely used by panelists in describing samples,
those are creamy, milky, sweet, bitter, caramel, and
coffee. The six attributes are analyzed using GPA
tools on XLSTAT with the results of PCA curve
which shows the correlation between the six selected
attributes with the commercial coffee sample. In the
first quadrant there were 3 commercial coffee
samples, which are Indocafe Coffeemix IPD, ABC
White Coffee IPD, and Nescafe IPD which had strong
coffee characters. In the second quadrant there were
only 2 samples, namely ABC Exo RTD and Good
Day Moccacino RTD which had the characteristics of
sweet, caramel, and milky. The third quadrant
consisted of Luwak White Koffie IPD, Good Day
Moccacino IPD, Kopiko 78 RTD, and Torabika
Cappuccino IPD which had sensory characteristics of
bitter. Luwak White Koffie RTD and Nescafe
Smoovlatte RTD are in the fourth quadrant with
creamy sensory characteristics. The correlation
between sensory attributes and samples tested with
the flash profile method can be seen in Figure 5.
Sensory Profile of Commercial Coffee Products using QDA (Quantitative Descriptive Analysis), Flash Profile, and CATA
(Check-All-That-Apply) Methods
23
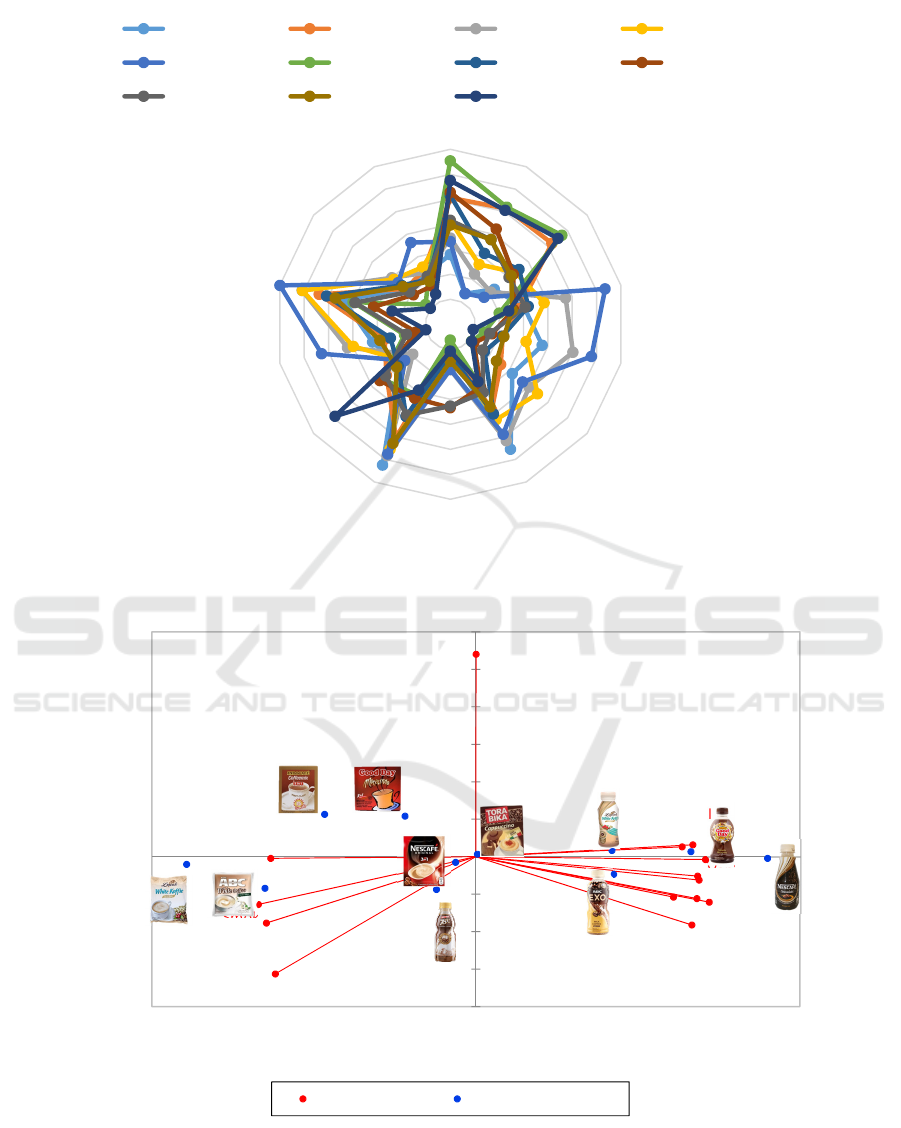
Figure 2: Spider web sensory attributes of commercial coffee sample.
Figure 3: PCA curve of QDA method.
0
1
2
3
4
5
6
7
Roasted
Smoky
Bean
Caramel
Vanilla
Chocolate
Milky
Coconut
Creamy
Bitter
Butter
Sweet
Cocoa
Salty
RLuwak RKopiko78 RGoodDayMoc RABCExo
RNescafe IABC INescafe IIndocafe
IGoodDayMoc ITorabika ILuwak
Roasted
Smoky
Bean
Caramel
Vanilla
Chocolate
Milky
Coconut
Creamy
Bitter
Butter
Sweet
Cocoa
Salty
‐8
‐6
‐4
‐2
0
2
4
6
8
10
12
‐6 ‐4 ‐20246
F2 (11.07 %)
F1 (72.80 %)
Biplot (axes F1 and F2: 83.87 %)
Activevariables Activeobservations
2nd SIS 2019 - SEAFAST International Seminar
24
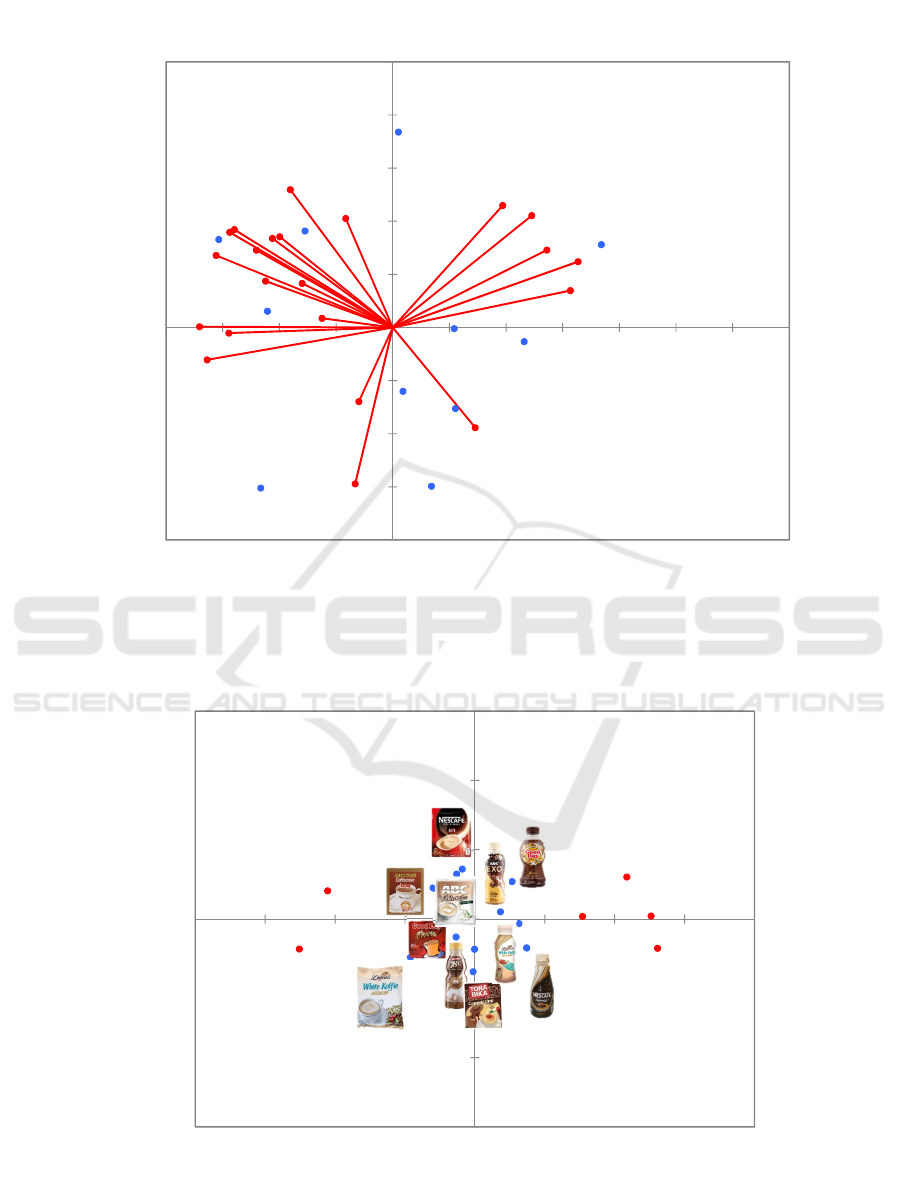
Figure 4: PCA curve all attributes from flash profile method.
Figure 5: PCA curve of flash profile method.
ITorabika
IGoodDayMoc
RKopiko78
ILuwak
RABCExo
INescafe
IABC
RGoodDayMoc
RNescafe
IIndocafe
RLuwak
Roasted
Creamy
Milky
Sweet
Bitter
Caramel
Coffee
Viscosity
Sour
Nutty
Vanilla
Chemical
Floral
Coconut
Honey
Fruity
Smoky
Rum
Chocolate
Colour
Mocca
Mouthfeel
‐2
‐1.5
‐1
‐0.5
0
0.5
1
1.5
2
2.5
‐2 ‐1.5 ‐1 ‐0.5 0 0.5 1 1.5 2 2.5 3 3.5
F2(13.54%)
F1(59.51%)
Biplot(axesF1andF2:73.04%)
Creamy
Milky
Sweet
Bitter
Caramel
Coffee
‐6
‐4
‐2
0
2
4
6
‐8 ‐6 ‐4 ‐202468
F2(11.96%)
F1(66.23%)
Biplot(axesF1andF2:78.19%)
Sensory Profile of Commercial Coffee Products using QDA (Quantitative Descriptive Analysis), Flash Profile, and CATA
(Check-All-That-Apply) Methods
25
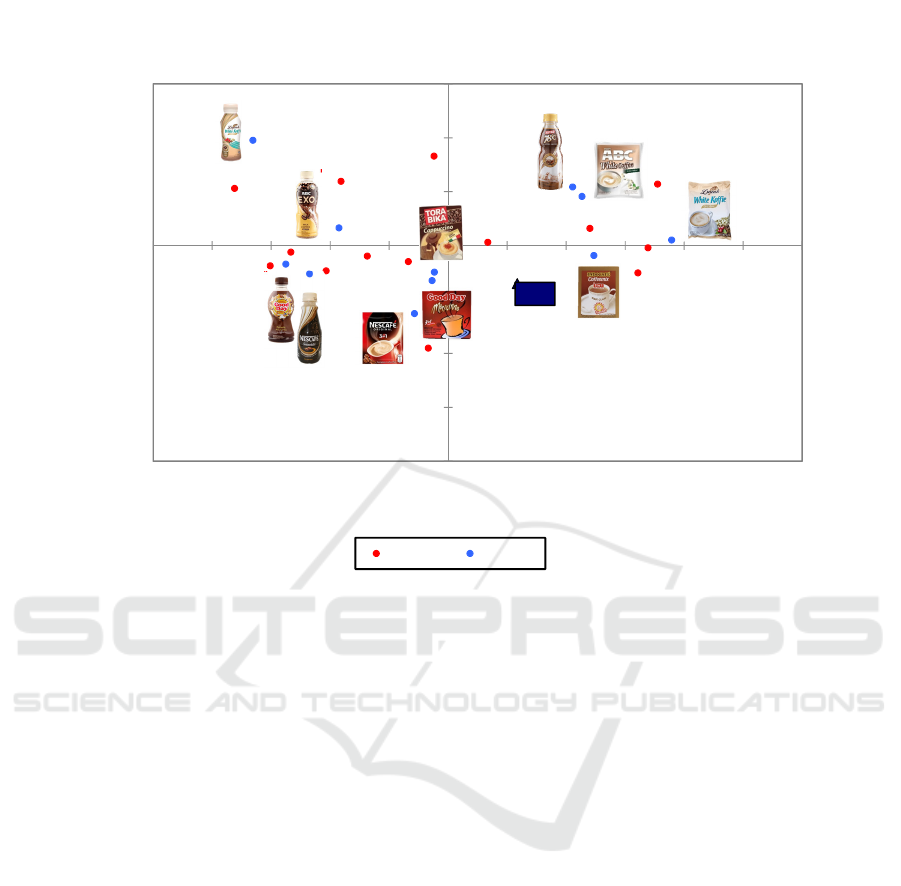
Figure 6: Ideal characteristic of RTD and IPD coffee.
3.4 Sensory Profile using CATA
Method
The results of the Cochran’s Q test with multiple
pairwise comparisons Marascuilo compare each
sensory attribute in each sample with a significance
level of 5%. The results of Cochran's Q test show that
all sensory attributes were significantly different in
each sample at a 5% significance level, except for
mouthfeel attributes. The results of the
Correspondence analysis, which is obtained by the
biplot map that represents the profile of commercial
coffee and ideal coffee, are in accordance with
appropriate sensory attributes (Ares et al., 2014).
Biplot maps that illustrate the correlation between
samples, ideal coffee products, and sensory attributes
tested can be seen in Figure 6.
Based on the results of the Correspondence
analysis in Figure 6, ideal coffee products according
to the panelists should have strong bitter, roasted and
mouthfeel attributes. The sample closest to the ideal
coffee product is Indocafe coffemix IPD. Luwak
White Koffie IPD also approaches the ideal coffee
product because it has strong roasted and bitter
attributes, but it is located in a different quadrant.
ABC White Coffee IPD and Kopiko 78 RTD have
dominant bean and smoky attributes. Torabika
Cappuccino IPD and Good Day Moccacino IPD have
the same dominant attributes, sweet and creamy
because they are very close to the biplot map, while
Nescafe IPD has the dominant caramel attribute.
Good Day Moccacino RTD has the dominant
attributes of vanilla and coconut, while Nescafe
Smoovlatte RTD is dominant in chocolate attributes.
ABC Exo RTD has a milky dominant attribute, while
Luwak White Koffie RTD that located in the same
quadrant has milky dominant attributes and buttery.
Luwak White Koffie RTD has the smallest bitter and
roasted attribute value compared to other samples, so
the position is the farthest from the ideal.
Based on the results of CATA Analysis, there is a
Principal Coordinate Analysis (PCoA) graph which
illustrates the correlation between sensory attributes
and panelists preference for commercial coffee
samples. The results of PCoA analysis in Figure 7
show that the dominant attributes that positively
influence panelists preference are the attributes of
mouthfeel, caramel, chocolate, and sweet with the
correlation between attributes with liking
respectively 0.072, 0.147, 0.063 and 0.132. This is not
in accordance with ideal coffee according to panelists
who are close to the bitter, roasted and mouthfeel
attributes. Only the mouthfeel attribute is close to the
ideal and also has a positive effect on preference.
Bitter
Sweet
Salty
Chocolate
Milky
Vanilla
Creamy
Caramel
Smoky
Coconut
Bean
Buttery
Roasted
Mouthfeel
Ideal
‐0.8
‐0.6
‐0.4
‐0.2
0
0.2
0.4
0.6
‐1 ‐0.8 ‐0.6 ‐0.4 ‐0.2 0 0.2 0.4 0.6 0.8 1 1.2
F2(10.41%)
F1(71.14%)
Symmetricplot
(axesF1andF2:81.55%)
Attributes Products
2nd SIS 2019 - SEAFAST International Seminar
26
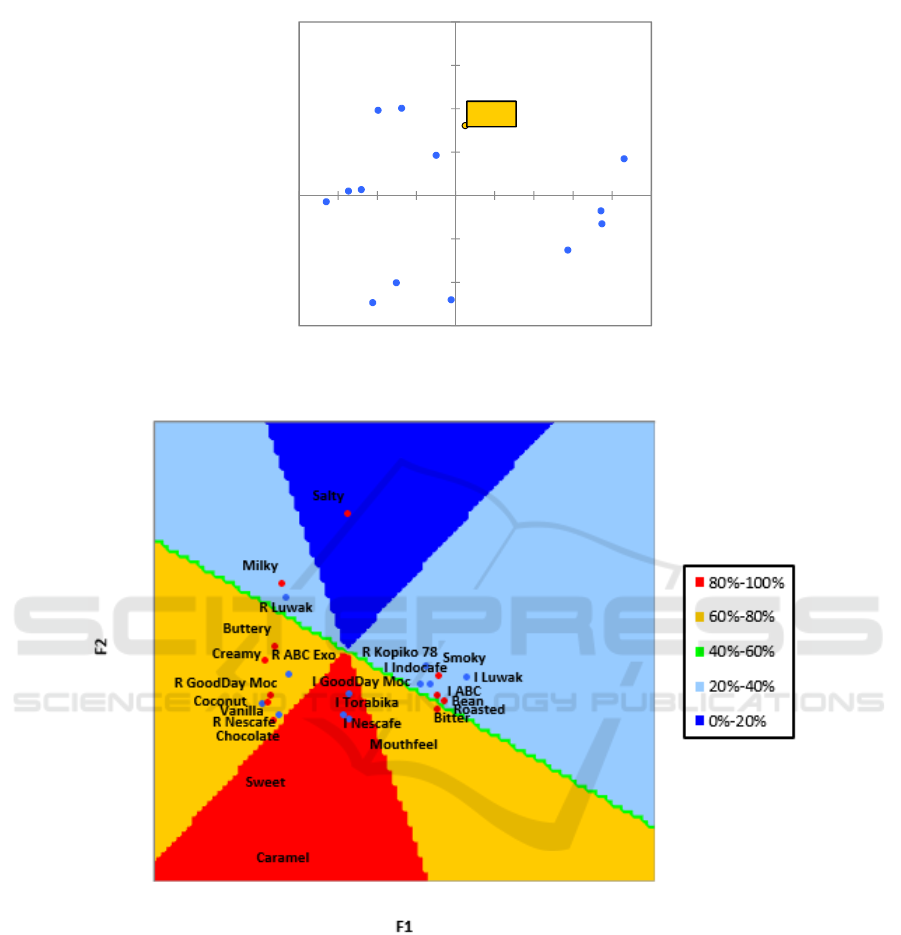
Figure 7: Correlation map between sensory attribute and consumer preference.
Figure 8: Consumer preference map towards commercial coffee.
Preference mapping is a technique that connects
consumer acceptance data (hedonic data) with
sensory characteristics of the product (descriptive
data) to find out product characteristics that influence
consumer preferences (Martinez et al., 2002).
Contour plot is one part of preference mapping that
have functions to show the number of clusters that
have a level of preference above the average. The
level of preference of each cluster is expressed in
terms of percent (%) and with different percentage of
each color (Manik et al., 2016). The results of
preference mapping can be seen in Figure 8.
The red area on the contour plot shows the highest
percentage of 80 - 100%. All panelists (100%) gave
the preference values above average for products
located in red areas, which are Good Day Moccacino
IPD, Torabika Cappuccino IPD, and Nescafe IPD.
While, 67% of panelists gave the preference values
above average on ABC Exo RTD products, Good Day
Moccacino RTD, and Nescafe Smoovlatte RTD,
which are located in yellow areas. In the light blue
Bitter
Sweet
Salty
Chocolate
Milky
Vanilla
Creamy
Caramel
Smoky
Coconut
Bean
Buttery
Roasted
Mouthfeel
Liking
‐0.6
‐0.4
‐0.2
0
0.2
0.4
0.6
0.8
‐0.8 ‐0.6 ‐0.4 ‐0.2 0 0.2 0.4 0.6 0.8 1
F2
F1
Sensory Profile of Commercial Coffee Products using QDA (Quantitative Descriptive Analysis), Flash Profile, and CATA
(Check-All-That-Apply) Methods
27

area, 33% of the panelists gave score above-average
on Luwak White Koffie RTD, Indocafe Coffemix
IPD, ABC White Coffee IPD, Luwak White Koffie
IPD, and Kopiko 78 RTD.
The attributes that most desired by panelists for
commercial coffee products are sweet, caramel, and
mouthfeel attributes. This is in accordance with the
graph (PCoA) above which states that the three
attributes have a positive effect on panelists
preferences. The attributes rather desired by panelists
are bitter, buttery, creamy, coconut, vanilla, and
chocolate, while the attributes that panelists don’t
really want to be present in the product are milky,
smoky, bean, and roasted. The most unwanted
attribute for the product is the salty attribute.
Penalty analysis based on the CATA method can
be done if there are hedonic data and data about ideal
product (Meyners et al., 2013). Based on the results
of the penalty analysis on XLSTAT software, there
are five categories of sensory attribute, which are
must have, nice to have, must not have, does not
harm, and does not influence. A sensory attribute can
be grouped as a must have if the attribute is desired
for the ideal product, but not found in the real product.
The must have attribute analysis can be determined if
the liking score for both the ideal product and the real
product (1.1) is greater than when the attribute is
chosen for the ideal product, but not for the real
product (1.0). Must not have attribute is the opposite
of the must have attribute, that is, sensory attributes
found on real products but not on ideal products.
Analysis of must not have attributes can be
determined if the liking score of attributes that are not
selected both on the ideal product and the real product
(0,0) is greater than when the attribute absent on the
ideal product, but found in the real product (0,1)
(Meyners et al., 2013).
Nice to have attribute can be determined if the
liking score of attributes found only in the real
product (0.1) is greater than when the attribute is not
found either on the ideal product or on the real
product (0.0). If the liking score of the attribute that
is not selected for both the ideal product and the real
product (0,0) is almost the same as when the attribute
is not chosen for the ideal product, but present in the
real product (0,1), the attribute is classified as does
not harm (Meyners et al., 2013).
There are 3 attributes that categorized as must
have, which are bitter, sweet, and creamy. Attributes
included in this category are attributes that must be
found in commercial coffee products according to
panelists and have a positive impact on preferences.
Nice to have attributes are attributes that do not have
to exist in commercial coffee products, but have a
positive impact on the liking score, while the must not
have attribute is an unwanted attribute found in the
product and has a negative impact on the liking score
(Meyners et al., 2013). Based on the analysis results,
there are no attributes that categorized as nice to have
and must not have. Salty, chocolate, vanilla, smoky,
coconut, bean, buttery and mouthfeel attributes
categorized as does not harm and caramel and roasted
attributes are categorized as does not influence. A
summary analysis of the sensory attributes of
commercial coffee products based on penalty analysis
can be seen in Table 1.
Table 1: Sensory attribute category based on CATA
analysis.
Must
have
Nice to
have
Does not
influence
Does not
harm
Must
not
have
Bitter - Caramel Salty -
Sweet Roasted Chocolate
Crea
my Vanilla
Smoky
Coconut
Bean
Buttery
Mouthfeel
3.5 Comparison of Analysis Results of
QDA, Flash Profile, and CATA
Methods
QDA, flash profile, and CATA methods have several
differences in practice and also the results obtained.
The QDA method requires trained panelists or expert
panelists in the testing. Flash profile and CATA
methods can be done using consumer panelists, but
with a different approach. Although they have
differences, the three methods can be used to obtain a
sensory profile of the sample, which is commercial
coffee.
To find out the differences in the results of the
three methods, it can be seen through the dominant
attributes that describe each sample. The dominant
attribute can be known from the PCA curve generated
in each method. To determine the dominant attributes
of the QDA method, spiderweb graphs can also be
2nd SIS 2019 - SEAFAST International Seminar
28

used as a consideration. Table 2 shows a summary
comparison of the three methods in determining the
dominant attributes of commercial coffee samples.
Based on Table 2, it can be seen that there are
several sensory attributes that can be identified
equally in the three methods. For example, milky
attribute in ABC Exo RTD and bitter attribute in
White Koffie IPD that can be identified by the
panelists on the CATA, flash profile, and QDA
methods. Some attributes can be identified equally in
the CATA and QDA methods, but not found on the
flash profile method. The sensory attributes are
vanilla attributes in Good Day Moccacino RTD and
Nescafe Smoovlatte RTD, bean attributes in Kopiko
78 RT, milky attributes in Luwak White Koffie RTD,
smoky attributes in ABC White Coffee IPD, and
creamy attributes in Torabika Cappuccino IPD. Only
two attributes that can be identified the same as the
flash profile and QDA methods but not found in the
CATA method, including the caramel attribute on
Good Day Moccacino RTD and creamy attribute on
Luwak White Koffie RTD. For Good Day Moccacino
IPD, Indocafe Coffeemix IPD, and Nescafe IPD,
there were no sensory attributes in the QDA test
which were also identified in the CATA and flash
profile methods.
There are several attributes that identified as
dominant attributes by expert panelists but cannot be
identified by consumer panelists. Nevertheless, the
attributes that included in “must have" category of the
CATA test, which are bitter and creamy, can be well
identified by consumer panelists. It can be seen in
Luwak White Koffie IPD sample which was
identified as having bitter attributes on the three
methods. The same with creamy attributes in the
Luwak White Koffie RTD and Torabika Cappuccino
IPD which can also be identified by consumer
panelists. This shows that consumer panelists are
quite good at identifying attributes that have a
positive effect on preferences.
QDA, flash profile, and CATA method have their
own advantages and disadvantages depending on the
objectives to be obtained. The QDA method can
provide more accurate results because using trained
panelists or expert panelists. However, trained
panelists or expert panelists are not always available
in the company and usually to obtain a trained
panelist takes a longer time. This method can be used
to describe products, detect changes in formulations,
determine the effect of storage and packaging
duration, and quality control (Rahmawati et al.,
2015).
CATA and flash profile methods can be done by
using consumer panelists, so it is more flexible and
shorter the time needed. The advantages of the CATA
method for use by companies are they can provide
information about the sensory attributes of the sample
quickly and know the relationship to the acceptance
and preferences of consumers. The CATA method
can also provide information about the characteristics
of ideal products according to consumers, which can
be useful in product development. The flash profile
method has the advantage of being able to give the
panelists the freedom to describe the sample and
determine the intensity of each attribute, so that
consumer perceptions can be quickly detected. But
this method can be considered impractical because if
the panelists determine their own attributes on the
sample, then each attribute must be interpreted and
then combined with similar attributes (Dooley et al.,
2010).
Based on the results of this research, sensory
attributes obtained from the analysis of the CATA
method have more in common with the QDA method.
This can be caused the panelist in CATA method only
need to select the attributes contained in the sample,
so that it is easier to do. In addition, the flash profile
method gives the panelists the freedom to determine
the sensory attributes of the sample, so that the results
obtained are broader and less consistent with the
results obtained in the QDA method. The CATA
method and flash profile cannot replace the QDA
method in terms of testing that requires high
sensitivity. But if it’s necessary to determine the
product's sensory profile quickly, then the CATA
method is better to do.
4 CONCLUSIONS
Four RTD coffee samples, Nescafe, ABC Exo, Good
Day Moccacino, and Luwak White Koffie have
almost the same sensory profile based on the QDA
method by expert panelists. The four samples tend to
have the dominant profile of vanilla, creamy,
caramel, and milky. One other RTD coffee sample,
Kopiko 78, is dominant in bean attributes.
Commercial IPD coffee samples have coconut, bitter,
and roasted sensory profiles that are more dominant
than RTD coffee.
The sensory profile of commercial coffee
obtained using the consumer panel in the two
methods, CATA and flash profile, gave quite
different results. The results of the CATA method
analysis have more in common with the QDA
method. This can be caused because the CATA
method is easier to do. In addition, the flash profile
method gives the panelists the freedom to determine
Sensory Profile of Commercial Coffee Products using QDA (Quantitative Descriptive Analysis), Flash Profile, and CATA
(Check-All-That-Apply) Methods
29

the sensory attributes of the sample, so that the results
obtained are broader and less consistent with the
results obtained in the QDA method. Compared to
flash profiles, the CATA method can provide more
accurate results and can be used if no trained panelists
are available or needed to determine the sensory
profile of the product quickly.
REFERENCES
Ares, G., Dauber, C., Fernández, E., Giménez, A., Varela,
P. (2014). Penalty analysis based on CATA questions
to identify drivers of liking and directions for product
reformulation. Food Quality and Preference, 32A, 65-
76.
[BSN] Badan Standardisasi Nasional. (1996). Minuman
Kopi dalam Kemasan. Jakarta (ID): BSN.
Bruzzone, F., Vidal, L., Antúnez, L., Giménez, A., Deliza,
R., Ares, G. (2015). Comparison of intensity scales and
CATA questions in new product development: Sensory
characterisation and directions for product
reformulation of milk desserts. Food Quality and
Preference, 44, 183-193.
Chapman, K.W., Lawless, H.T., Boor, K.J. (2001).
Quantitative descriptive analysis and principal
component analysis for sensory characterization of
ultrapasteurized milk. Journal of Dairy Science, 84, 12-
20.
Dairou, V, Siefferman, J.M. (2002). A comparison of 14
jams characterized by conventional profile and a quick
original method, the flash profile. Journal of Food
Science, 67, 826-834.
Dewi, F.I., Anwar, F., Amalia, L. (2009). Persepsi terhadap
konsumsi kopi dan teh mahasiswa TPB-IPB tahun
ajaran 2007-2008. Jurnal gizi dan pangan, 4(1), 20-28.
Dooley, L., Lee, Y., Meullenet, J.F. (2010). The application
of Check-All-That-Apply (CATA) consumer profiling
to preference mapping of vanilla ice cream and its
comparison to classical external preference
mapping. Food Quality and Preference, 21, 394–401.
Farida, A., Ristanti, E., Kumoro, A.C. (2013). Penurunan
kadar kafein dan asam total pada biji kopi robusta
menggunakan teknologi fermentasi anaerob fakultatif
dengan mikroba nopkor MZ-15. Jurnal Teknologi
Kimia dan Industri, 2(3), 70-75.
[ICO] International Coffee Organization. (2018). World
Coffee Consumption. London (UK): ICO.
[ISO] International Organization for Standardization.
(2012). Sensory analysis: General guidelines for the
selection, training and monitoring of selected assessors
and expert sensory assessors. Geneva (CH): ISO.
Manik, M., Restuhadi, F., Rossi, E.. (2016). Analisis
pemetaan kesukaan konsumen terhadap lempuk
dikalangan mahasiswa Universitas Riau. Jom Faperta,
3(2), 1-15.
Martinez, C., Cruz, M.J.S., Hough, G., Vega, M.J. (2002).
Preference mapping of cracker type biscuits. Food
Quality and Preference, 13, 535-544.
Meyners, M., Castura, J.C., Carr, B.T. (2013). Existing and
new approaches for the analysis of CATA data. Food
Quality and Preference, 30(2), 309-319.
Montanuci, F.D., Marques, D.R., Monteiro, A.R.G. (2015).
Flash profile for rapid descriptive analysis in sensory
characterization of passion fruit juice. Maringá, 37(3),
337-344. doi: 10.4025/actascitechnol.v37i3.26238
Moussaoui, K.A., Varela, P. (2010). Exploring consumer
product profiling techniques and their linkage to a
quantitative descriptive analysis. Food Quality and
Preference, 21, 1088-1099. doi:
10.1016/j.foodqual.2010.09.005
Panggabean, E. (2011). Buku Pintar Kopi. Jakarta (ID):
Agromedia Pustaka.
Papetti, P., Carelli, A. (2013). Composition and sensory
analysis for quality evaluation of a typical Italian
cheese: Influence of ripening period. Czech Journal of
Food Science, 31(5), 438-444.
Poste, L.M., Deborah, A.M., Gail, B., Elizabeth, L. (2011).
Laboratory methods for sensory analysis of food.
Research Branch Agriculture Canada Publication 1864
Rahmawati, D., Andarwulan, N., Lioe, H.N. (2015).
Identifikasi atribut rasa dan aroma mayonnaise dengan
metode Quantitative Descriptive Analysis (QDA).
Jurnal Mutu Pangan, 2(2), 80-87.
Towaha, J., Purwanto, E.H., Aunillah, A. (2012). Peranan
Pengolahan terhadap Pembentukan Citarasa Kopi. Di
dalam: Amaria W, Chan AN. Bunga Rampai Inovasi
Teknologi Tanaman Kopi untuk Perkebunan Rakyat.
Sukabumi (ID): Balittri.
Triyanti, D.R. (2016). Outlook Kopi. Jakarta (ID): Pusat
Data dan Sistem Informasi Pertanian Sekretariat
Jenderal – Kementerian Pertanian.
Varela, P., Ares, G. (2012). Sensory profiling, the blurred
line between sensory and consumer science. A review
of novel methods for product characterization. Food
Research International, 48, 893-908.
2nd SIS 2019 - SEAFAST International Seminar
30
