Influence of Work Motivation and Use of Information Technology on
Sleman Yogyakarta Farmers Performance
Arief Subyantoro
1
, Rifqi Syarif Nasrulloh
1
and A. Ayiek Sih Sayekti
2
1
Universitas Pembangunan Nasional Veteran Yogyakarta
2
INSTIPER, Yogyakarta
Keyword: Work Motivation, Information Technology Utilization, Farmers' Performance
Abstract: Food security programs based on food independence and sovereignty supported by integrated food
availability, distribution, and consumption subsystems are one of the government's efforts to strengthen
national food security. Farmers, as the main actors in supplying food supplies, are interesting subjects to study.
This study aims to reconfirm the influence between work motivation and the use of information technology
on individual performance based on previous research with different research objects. The population in this
study were all farmers registered as members of farmer groups in each region. The sampling technique is the
accidental sampling method and obtained 102 farmer respondents who filled out the questionnaire. The results
state that this study supports previous findings, which state that 1) work motivation has a positive influence
on farmers 'performance, 2) the use of information technology has a positive effect on farmers' performance.
By building self-motivation through rewards that are expected to be adjusted to personal goals so that the
performance of individuals will increase due to the motivation for personal goals that they want to obtain.
While the use of technology increases individual performance by looking at the more dominant frequency of
using information technology compared to other technology utilization indicators.
1
INTRODUCTION
In efforts to strengthen food security, the Ministry of
Agriculture will focus on increasing the production of
strategic staple foods for rice, corn, soybeans, sugar
(sugar cane) and beef buffalo, and other agricultural
commodities, on meeting domestic food needs. The
stabilization of food security must be based on food
independence and sovereignty supported by
integrated food availability, distribution, and
consumption subsystems (Renstra BKP, 2019). The
agricultural sector is the main sector in meeting
human needs, both domestically and abroad. In
Indonesia, the role of agriculture is not only a
fulfillment of consumer needs but also as a
contributor to the country's economic income because
Indonesia is an agricultural country whose main
economic factor in agriculture. Based on data from
the Ministry of Agriculture (Ministry of Agriculture),
in the past three years, rice production has continued
to increase, but in terms of productivity, it has
declined. While corn production rose due to increased
harvested area, while the level of productivity fell.
The decline in rice productivity in the last three years
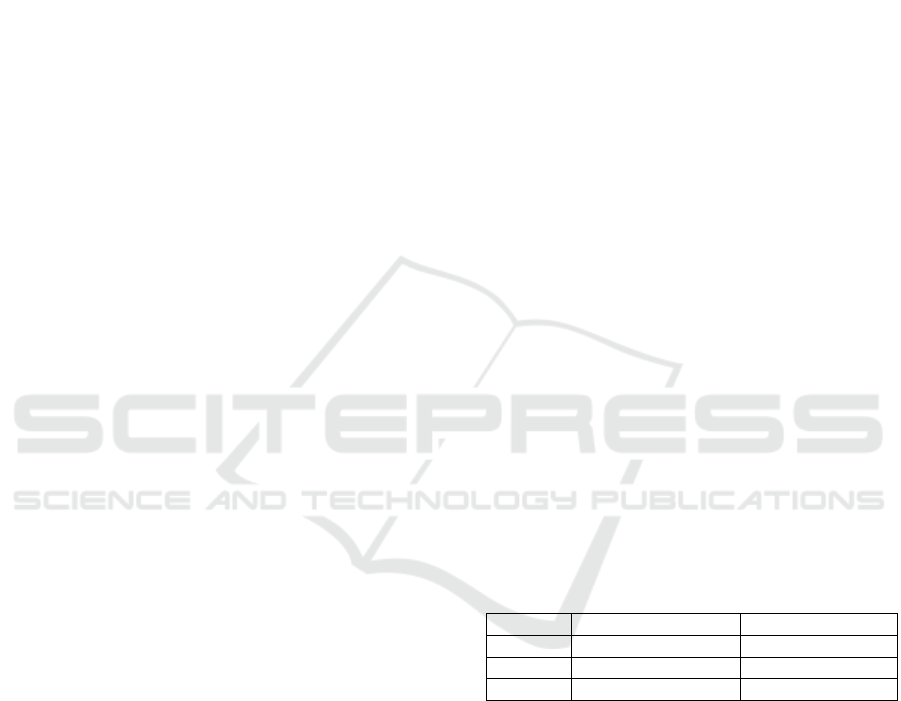
can be seen in table 1:
Table 1. Decreased rice productivity
The food security program is directed at the
independence of the community/farmers based on
local resources so that they are very concerned about
the level of welfare of farmers (Darwanto, 2005). The
griculture sector is still the mainstay in Sleman
Regency; it can be seen from the high.
The number of people in this region who are still
dependent on agriculture for their livelihoods, besides
the agricultural sector, is also the biggest contributor
to the Gross Regional Domestic Product (PDRB) in
Sleman. However, in its implementation, several
problems exist so that the food security program does
not run optimally. The problem was stated in the BKP
Restra (2019) on the fourth point. Namely, food
Year of Productivity Decrease in
2015 5.34 tons per hectare
2016 5.24 tons per hectare 10 tons per hectare
2018 5.16 tons per hectare 8 tons per hectare
Subyantoro, A., Nasrulloh, R. and Sayekti, A.
Influence of Work Motivation and Use of Information Technology on Sleman Yogyakarta Farmers Performance.
DOI: 10.5220/0009966103470352
In Proceedings of the International Conference of Business, Economy, Entrepreneurship and Management (ICBEEM 2019), pages 347-352
ISBN: 978-989-758-471-8
Copyright
c
2020 by SCITEPRESS – Science and Technology Publications, Lda. All rights reserved
347

agribusiness that has not been optimal has greatly
affected the level of welfare of farmers. These
problems are closely related to the quality and
quantity of farmers' yields. Product quality and
quantity is an indicator of individual performance
measurement (Moeheriono, 2009)
Individual performance of certain behaviors is
mainly determined by the intention of someone who
has a certain motivation to perform the behavior,
individual attitudes and the influence of the social
environment on the desired behavior must be positive
in order for changes to occur expected, this is
supported by the theory of hope put forward by Victor
Vroom (Robbins & Judge, 2008). Behavior change is
very influential on the extent of individual
performance so that each individual is required to be
able to implement a culture of high- performance
behavior (Armstrong, 2006). Changes in behavior
because technology has resulted in higher quality
individual performance in an organization. These
findings have been highlighted by (Abusharbeh &
Nazzal, 2018; Bao & Nizam, 2015; Andriana, 2015;
Wahyudi et al., 2018) which states that work
motivation has an influence on individual
performance, other findings put forward by (Igbaria
& Tan, 1997; Hasiholan, 2005, Lindawati & Salamah,
2012) also stated that the use of information
technology has a positive influence on individual
performance.
Therefore, this study aims to reconfirm the
influence between work motivation and the use of
information technology on individual performance
based on previous research with different research
objects, namely farmers in Sleman, Yogyakarta. This
is because changes in farmer's behavior are one of the
factors that cause problems that hamper the pace of
food security programs.
2
LITERATURE REVIEW
2.1 Individual Performance
According to Miner (1990), performance is how a
person is expected to function and behave in
accordance with the tasks assigned to him. Every
expectation of how one must behave in carrying out
the task means showing a role in the organization. An
organization, both government and private
organizations in achieving the goals set, must be
through means in the form of an organization that is
driven by a group of people who play an active role
(actors) to achieve the goals of the institution or
organization concerned (Prawirosentono, 1999).
Performance (performance) is an achievement of
certain job requirements that ultimately can be
reflected in the output produced. Performance is one
of the measurement tools for achieving organizational
goals. Performance can be seen as 'thing is done.'
Hasibuan (2002) also defines performance (work
performance) as a result of work in quality and
quantity achieved by an employee in carrying out
their duties in accordance with the responsibilities
given to him (Moeheriono, 2009).
2.2 Work
Motivation, according to Robbins & Judge (2008), is
a process that explains the intensity, direction, and
perseverance of an individual to achieve his goals.
Motivation, according to Hasibuan (2009), is the
provision of driving data that creates the excitement
of one's work, so that they want to cooperate, work
effectively and be integrated with all their efforts to
achieve satisfaction. Meanwhile, according to Mathis
& Jackson (2002) revealed that motivation is a desire
in someone who causes the person to act. Robbins &
Judge (2008) said that the theory of the process of
motivation tries to answer how to strengthen, direct,
maintain, and stop individual behavior. One theory of
the process is the theory of hope. The theory of hope
was put forward by Victor Vroom, who bases his
theory on three important concepts, namely: 1) Hope
(expectancy) is an opportunity given to occur due to
behavior. 2) Value (valence) is the result of certain
behaviors that have a certain value or dignity (power
or value motivating) for each particular individual. 3)
Linkage (instrumentality) is the perception of the
individual that the results of the first level will be
related to the results of the second level.
H1: Work motivation has a positive influence on the
performance of farmers.
2.3 Utilization of Information
Technology
The rapid development of information systems and
information technology makes it a competitive
weapon that must be owned by companies in Winning
the competition. The application of information
systems and information technology can be said to be
successful if it can improve employee performance,
which in turn can improve company performance.
With the implementation of information systems and
information technology, companies need to prepare
human resources (HR) (Lindawati & Salamah, 2012).
Thompson et al. (1991) define the use of technology
as the benefits expected by users of information
ICBEEM 2019 - International Conference on Business, Economy, Entrepreneurship and Management
348
systems in carrying out their duties where the
measurement is based on the intensity of utilization,
frequency of utilization, and the number of
applications or software used. Technology is seen as
a tool used by individuals in carrying out their duties.
Technology is a tool, technique, or way that can help
humans in doing work so that work becomes lighter,
faster, better, or more results (Haryani, 2001). In
relation to the utilization of information technology,
there are two basic theories, namely Theory of
Reasoned Action (TRA) developed by Fishbein &
Ajzen (1975) and Theory of Attitudes and Behavior
developed by Triandis (1971). Theory of attitudes and
behavior developed by Triandis (1971) states that
behavior is determined by what people want to do
(attitude), what they think they will do (social rules),
what they are used to do (habits) and with the
consequences of the behavior they expect. According
to Lucas & Spitler in Jin (2003), information systems
and information technology can be used effectively
one of them by contributing to performance.
H2: The use of information technology has a positive
influence on the performance of farmers
3
RESEARCH METHODS
The object in this study is farmers in Sleman,
Yogyakarta. The population of this research is all
farmers who are members of farmer groups in each
region in one Sleman district. The sampling technique
is the accidental sampling method; this technique is
implemented by inviting farmers from several groups
in Sleman at a Forum Group Discussion, farmers who
come to the event will be used as research samples.
This technique is carried out to facilitate research
activities because this research is still under
development. The total number of farmers who
attended the event was 106 farmers, so the sample in
this study was 102, so that the number met the criteria
for the sample in the SEM study of at least 100 people
(Ghozali, 2006). Data collection techniques using a
Likert scale questionnaire with intervals 1-4, 1,
namely strongly disagree, 2 disagree, 3 agree, and 4
strongly agree (Widiyoko, 2016). The statistical
technique used is Partial Least Squares to show the
results of the validity and reliability test and
hypothesis testing. The questionnaire was sourced
from each variable as follows:
a.
Work motivation, there are 3 indicators of work
motivation measurement, namely the business
relationship with performance, business
relationship with rewards, and relationship of
rewards with personal goals (Lamborn, 1991;
Robbins & Judge, 2008).
b.
Utilization of Technology, there are 3
indicators that have been adopted by
Thompson et al. (1991; 1994), namely
intensity, frequency, and diversity.
c.
Individual performance, there are 2 indicators
of individual measurement, namely the
quantity and quality of products (Moeheriono,
2009).
4
RESULTS
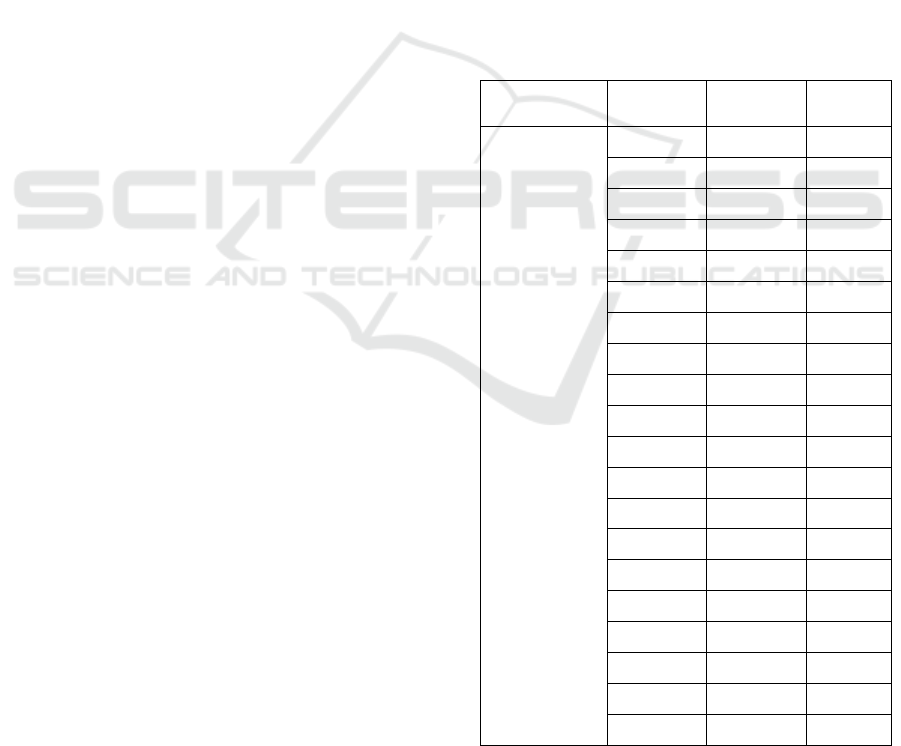
4.1 Characteristics of Respondents
The following characteristics of respondents by age,
sex, marital status, some dependents, length of time
as farmers and education can be seen in table 2:
Table 2. Respondent
Characteristics Respondents Frequency Percentage
Age
15-30 6 6.12
30-40 24 24.48
> 40 72 73.44
Gender
Men 81 82.62
Women 21 21.42
Marital Status
Married 94 95.88
Not Married 5 5.1
Not Married 3 3.06
Number of
Dependents
0 10 10.2
1 11 11.22
2 20 20.4
> 3 61 62.22
Farming Time
> 10 25 25.5
10 - 20 38 38.76
20-30 19 19.38
> 30 20 20.4
Education
SD 26 26.52
SLTP 21 21.42
SLTA 52 53.04
Others 3 3.06
Influence of Work Motivation and Use of Information Technology on Sleman Yogyakarta Farmers Performance
349
From the table above, it can be seen that the
majority of respondents have an age of over 40 years
of 73.44% of the total study respondents. This shows
that the existing farmers are classified as old. In terms
of gender, male respondents dominate 82.62% of the
total respondents; this is natural and has become
common because farming is a profession dominated
by men. Many respondents also already have
families, in the amount of 95.88% of the total
respondents, and the majority have more than 3
children in the amount of 62.22. Experience in
farming can be seen from the length of time he
worked as a farmer, seen from table 4.1. The majority
of respondents became farmers around 10- 20 years
which amounted to 38.76% and the second position
was occupied by respondents with long ten years of
farming <10 years which amounted to 25.5% so that
from this data it can be seen that the respondents were
relatively short-lived as farmers. The level of
education of farmers is dominated by upper
secondary level schools, and its equivalent is 53.04%.
This shows the level of farmers' education is quite
good.
4.2 Test Instrument Research
4.2.1 Validity Test
To conduct the validity test in this study used 2
measurements, namely the Convergent Validity and
Discriminant Validity tests. Based on the instrument
testing that has been done, the convergent validity test
results of each variable can be seen in Table 3, as
follows:
Table 3. Convergent Validity Test Table
Convergent Validity
X11 <- Motivation 0.816
X12 <- Motivation 0.835
X13 <- Motivation 0.768
X21 <- Use of IT 0.933
X22 <- Utilization of IT 0.916
X23 <- Utilization of IT 0.876
Y11 <- performance of Farmers 0.640
Y110 <- performance of Farmers 0.695
Y12 <- performance of Farmers 0.713
Y15 <- performance of Farmers 0.808
Y17 <- performance of Farmers 0.771
Y18 <- Farmer Performance 0.736
Y19 <- Farmer Performance 0.691
Based on table 3, the convergent validity value of
each indicator has fulfilled the requirements that are
above 0.7, 2 items in the farmer performance variable
have values between 5-7 but are still maintained
because they have a value of 0.5- 0.6, this is still
accepted in research that is still under development
(Chin, 1998). The following test results discriminant
validity can be seen in Table 4:
Table 4. Cross Loading
Work
Motivation
Information
Technology
Utilization
Performance
Farmers
X11 0.816 0.109 0.342
X12 0.835 0.245 0.364
X13 0.768 0.376 0.37
X21 0.3 0.933 0.34
X22 0.256 0.916 0.257
X23 0.273 0.876 0.274
Y11 0.219 0.016 0.64
Y11
0
0.221 0.396 0.695
Y12 0.182 0.173 0.713
Y15 0.492 0.303 0.808
Y17 0.37 0.045 0.771
Y18 0.269 0.173 0.736
Y19 0,339 0.342 0.691
Based on the cross-loading in Table 3.5 shows
that each indicator is higher correlated with each
construct is compared with other constructs, so it is
said to have good discriminant validity.
4.2.2 Reliability Test
The test uses composite reliability values. The Rule
of Tumb that is usually used to assess construct
reliability is that the Composite Reliability value must
be greater than 0.7 (Ghozali & Latan, 2013). The
following results of the reliability testing in table 5:
Table 5. Reliability Test
Cronbach' s Alpha Description
Farmer
Performance
0.853
Reliable /
Reliable
Work Motivation 0.731 Reliable / Reliable
Utilization of
Information
Technology
0.895 Reliable / Reliable
ICBEEM 2019 - International Conference on Business, Economy, Entrepreneurship and Management
350
4.2.3 Variables Research Hypothesis Test
Hypothesis
Testing in this study uses the Partial Least Square
(PLS) statistical test with SMART PLS 3.0 software
to analyze the relationship between the data needed
and the relationship between exogenous variables and
endogenous variables. The following hypotheses test
results can be seen in table 6:
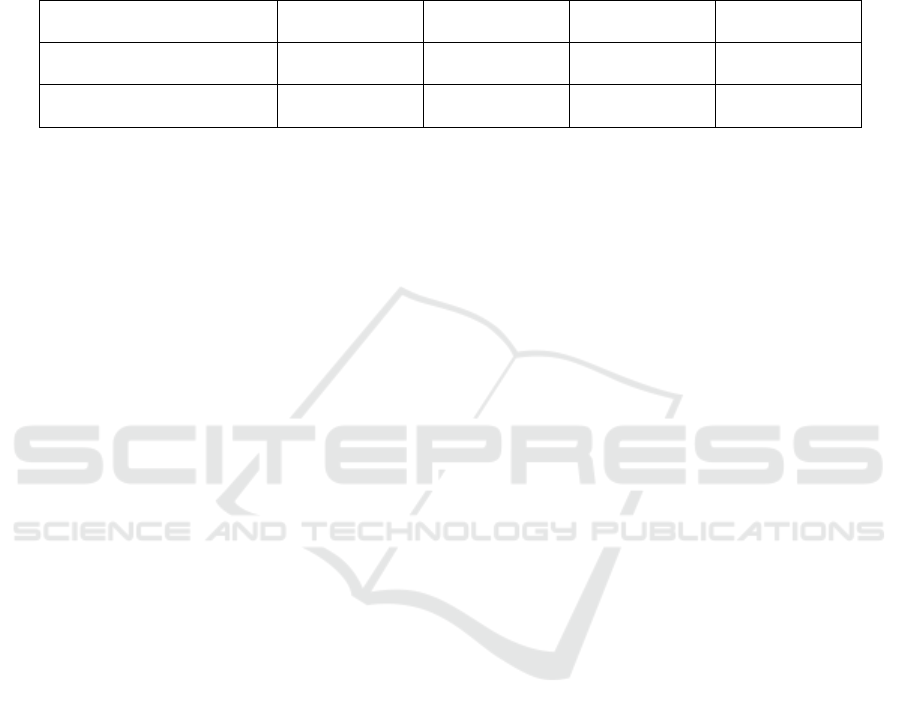
Table 6. Hypothesis Test Results
Original Sample
(O)
T Statistics
( O / STDEV)
P values Information
Work motivation -> Farmer
Performance
0.382 3,894 0,0000 Significant
Use of information Technology
-> Performance Farmers
0.207 2.225 0.027 Significant
From table 6, it can be seen that the relationship
between work motivation and individual performance
shows an estimated coefficient of 0.382, a calculated
t value of 3,894, and a probability value of 0,000.
Probability value indicates less than 0.05, so it can be
concluded that
there is a significant effect between work
motivation (X1) and Individual Performance (Y).
Judging from the estimated coefficient values
indicate that the direction of the relationship between
work motivation and individual performance is
positive; therefore, it can be concluded that
hypothesis 1 that states the work motivation of
farmers has a positive influence on farmer
performance is proven. The relationship between the
use of information technology on individual
performance shows an estimated coefficient value of
0.207, a calculated value of t.225, and a probability
value of 0.027. Probability value indicates less than
0.05, so it can be concluded that there is a significant
influence between the use of information technology
(X2) with Individual Performance (Y). Judging from
the estimated coefficient values indicates that the
direction of the relationship between the use of
information technology with individual performance
is positive; therefore, it can be concluded that
hypothesis 2, which states the use of information
technology, has a positive influence on the
performance of farmers is proven.
5
DISCUSSION
From the results of hypothesis testing that has been
done shows that the work motivation of farmers has a
positive influence on the performance of farmers so
that hypothesis 1 is accepted. These findings support
the research conducted by (Abusharbeh & Nazzal,
2018; Bao & Nizam, 2015; Andriana, 2015; Wahyudi
et al., 2018). By referring to the theory of hope which
assumes that humans will take action to achieve the
goals they deem valuable and they see that what they
do will help them achieve these goals, therefore with
the expectations held by individuals, each individual
strives to achieve or fulfill These expectations will
later aim to improve individual performance (Suripto,
2015). The results also showed that farmers showed
the highest motivation indicator is by building self-
motivation through rewards that are expected and in
accordance with personal goals so that the
performance of individuals will increase due to the
motivation for personal goals that have been wanted.
From the results of hypothesis testing that has
been done shows that the use of information
technology has a positive influence on the
performance of farmers so that hypothesis 2 is
accepted. These findings support the research
conducted by (Igbaria & Tan, 1997; Hasiholan, 2005;
Lindawati & Salamah, 2012). Basically, utilizing
information technology can increase the speed,
accuracy, and efficiency of exchanging large amounts
of information so that the role of utilizing information
technology is very important for improving
individual performance (Igbaria & Tan, 1997). The
results of this study also indicate that the use of
technology increases individual performance by
looking at the more dominant frequency of using
information technology compared to other
technology utilization indicators. This shows that the
use of information technology means that farmers
already have experiences that have a good impact on
their performance so that farmers will continue to use
information technology repeatedly.
Influence of Work Motivation and Use of Information Technology on Sleman Yogyakarta Farmers Performance
351

6
CONCLUSION
Based on the results of the study as described in the
previous chapter, two conclusions can be drawn;
namely, first, work motivation has a positive
influence on farmers' performance. It means that if the
work motivation is high, the farmer's performance
will also increase; on the contrary, if the work
motivation is low, the farmer's performance will also
decrease. The highest motivation indicator is to build
self-motivation through the expected appreciation
and in accordance with personal goals so that the
individual's performance will increase due to the
motivation of personal goals that you want to obtain.
Second, the use of information technology has a
positive influence on the performance of farmers.
This means that if the use of information technology
is high, then the performance of farmers will also
increase; on the contrary, if the information
technology is low, then the performance of farmers
will also decrease. Utilization of technology increases
individual performance by looking at the more
dominant frequency of using information technology
compared to other technology utilization indicators.
REFERENCES
Abusharbeh, M. T., & Nazzal, H. H. (2018). The Impact of
Motivations on Employees Performance: Case Study
from Palestinian Commercial Banks. International
Business Research, 11(4), 142-153.
Andriana, R. (2015). Pengaruh Motivasi dan
Kepemimpinan terhadap Kinerja. Jurnal Maksipreneur:
Manajemen, Koperasi, dan Entrepreneurship, 4(2), 38-
49.
Armstrong, M. (2006). Performance management: Key
strategies and practical guidelines. Handbook.
Bao, C., & Nizam, I. (2015). The impact of motivation on
employee performance in the electronics industry in
China. International Journal of Accounting & Business
Management, 3(2).
Darwanto, D. H. (2005). Ketahanan pangan berbasis
produksi dan kesejahteraan petani. Ilmu Pertanian,
12(2), 152-164.
Fishbein, M., & Ajzen, I. (1975). Belief, Attitude,
Intentions, and Behavior An Introduction to Theory and
Research. Addison Wesely. Boston. Ma.
Ghozali, I. (2006). Aplikasi analisis multivariate dengan
program SPSS. Badan Penerbit Universitas
Diponegoro.
Haryani, S. (2001). Komunikasi Bisnis. Yogyakarta:
UPP AMP YKPN.
Hasibuan, Malayu S.P, (2009). Manajemen Sumber Daya
Manusia, Jakarta : Penerbit PT Bumi Aksara.
Hasiholan, H. M. (2005). Pengaruh faktor kesesuaian tugas-
teknologi dan pemanfaatan teknologi informasi
terhadap kinerja : Analisis pada PT Indonesia Epson
Industry (Doctoral dissertation, Universitas Gadjah
Mada).
Igbaria, M., & Tan, M. (1997). The consequences of
information technology acceptance on subsequent
individual performance. Information & management,
32(3), 113-121.
Jin, T. F. (2003). Analisis faktor-faktor yang
mempengaruhi pemanfaatan teknologi informasi dan
pengaruh pemanfaatan teknologi informasi terhadap
kinerja akuntan publik. Jurnal bisnis dan akuntansi,
5(1), 1- 26.
Lindawati & Salamah, I. (2012). Pemanfaatan Sistem
Informasi dan Teknologi Informasi Pengaruhnya
Terhadap Kinerja Individual Karyawan. Jurnal
Akuntansi dan Keuangan, Vol. 14, No. 1, Hal. 56-68
Miner, J. B., (1990). Organizational Behavior: Performance
and Productivity. New York: Random House
Moeheriono. (2009). Pengukuran Kinerja Berbasis
Kompetensi: Competency Based Human Resource
Management, Jakarta: Ghalia Indonesia.
Prawirosentono, S. (1999). Manajemen sumberdaya
manusia: kebijakan kinerja
karyawan: kiat membangun organisasi kompetitif
menjelang perdagangan bebas dunia. Badan Penerbit
Fakultas Ekonomi (BPFE).
Renstra BKP (2019). Rencana Strategis Badan Ketahanan
Pangan Tahun 2015- 2019. Jakarta: Kementerian
Pertanian.
Robbins, S. P., & Judge, T. A. (2008). Perilaku organisasi
(Organizational behavior). Jakarta: Salemba Empat.
Suripto, T. (2016). Meningkatkan Kinerja Karyawan
Melalui Expectancy Theory Dalam Motivasi. JESI
(Jurnal Ekonomi Syariah Indonesia), 5(2), 115-123.
Thompson, R. L., Higgins, C. A., & Howell, J. M. (1991).
Personal computing: toward a conceptual model of
utilization. MIS quarterly, 125-143.
Triandis, H. C. (1971). Attitude and attitude change (Vol.
8). New York: Wiley.
Wahyudi, R., Poernomo, D., & Puspitaningtyas, Z. (2018).
Effect of Information Technology, Satisfaction and
Motivation to Teacher Performance. The International
Journal of Social Sciences and Humanities Invention,
5(1), 4370-4378.
Widoyoko, E. P. (2016). Teknik Teknik Penyusunan
Instrumen Penelitian. Yogyakarta: Pustaka Pelajar.
ICBEEM 2019 - International Conference on Business, Economy, Entrepreneurship and Management
352
