
SWOT Analysis Development of Yogyakarta Batik
Sri Suryaningsum
1
, Raden Hendri Gusaptono
1
, Sri Luna Murdianingrum
1
, Ni Putu Ayu Mas Sri
Wulan
2
, Rakyan Widowati Tanjung
2
1
Universitas Pembangunan Nasional Veteran Yogyakarta
2Universitas Gadjah Mada
Keyword: Development of Yogyakarta Batik, SWOT Analysis, Strategy Evaluation
Abstract: This study focuses on the development of Yogyakarta Batik using a SWOT analysis. SWOT analysis is a
comprehensive review of company strengths, weaknesses, opportunities, and threats. This analysis is needed
to determine several strategies that must be applied to a company. Yogyakarta has become a famous batik
district in Indonesia. Seeing the development of batik that is getting better and more in demand by tourists,
analysis to determine business strategy is of particular concern to the company. Not only is the quality of the
product in the spotlight, but the promotion and placement (location) of product sales. With opportunities to
increase sales in existing tourist attractions, accompanied by threats from external companies. The threat
comes from other companies that present the same product at prices below the price offered by Bantul Batik
craftsmen. This SWOT analysis is expected to be able to overcome the existing threats. In addition to threats
and opportunities, companies must also analyze their strengths and weaknesses. The advantages possessed
are used as weapons to compete in market share. While weaknesses can be used as guidelines to improve in
terms of quality, both from natural resources and human resources that exist in the company. The analytical
formulation framework according to Fred R. David consists of 3 stages, namely: (1) input stage, consist of
external factor evaluation matrix, competitive profile matrix, and internal factor evaluation, (2) matching
stage, consist of strength-weakness-opportunity-threat (SWOT) Matrix, Boston consulting group (BCG)
matrix, internal-external (IE) matrix, and large strategy matrix, the last stage is (3) decision stage, consist of
two-phase, phase 1 is objectively evaluated alternative strategies identified from and phase 2 is techniques
from the decision stage are quantitative strategic planning matrix (QSPM). Observation is one of the data
collection techniques that not only measure respondents' attitudes (interviews and questionnaires) but can
also be used to record various phenomena that occur (situations, conditions).
1 INTRODUCTION
Yogyakarta is one of the tourist destinations in
Indonesia. Besides being a city of students and
cities, Yogyakarta has many tourist attractions that
are very attractive for tourists to visit Yogyakarta.
Apart from having a lot of potential and tourist
attractions, Yogyakarta also has its own uniqueness
that is not shared by other cities in Indonesia,
including warm, bakpia, and batik. With the
nickname Yogyakarta is the center of batik from
tourists, this is a big challenge for the batik industry
in this student city. All efforts are made to maintain
and control the market to attract tourists. In addition
to maintaining quality, creativity in batik cloth
motifs is also a challenging demand. To foster a love
for various products nuanced with batik, craftsmen
are also required to make various models of clothing
and accessories that follow the era. This can attract
teenagers to wear clothing and accessories with batik
nuances. Batik is the identity of Yogyakarta because
it is called the City of Batik. UNESCO recognizes
batik as belonging to Indonesia and establishes
October 2, 2009, as Batik Day in Indonesia (Sri
Suryaningsum, 2017).
The use of batik further developed into various
fields of clothing, household equipment, and
architecture. As a result of civilization, batik
underwent changes due to technological
developments, circles, and shifts in cultural values. It
broadens the scope of the development of the world
of batik. The use of batik in various modern fashion
creations, also for interior and household needs, as
mentioned, gives a real picture. The widespread
function of batik has opened up many possibilities
158
Suryaningsum, S., Gusaptono, R., Murdianingrum, S., Wulan, N. and Tanjung, R.
SWOT Analysis Development of Yogyakarta Batik.
DOI: 10.5220/0009959901580168
In Proceedings of the International Conference of Business, Economy, Entrepreneurship and Management (ICBEEM 2019), pages 158-168
ISBN: 978-989-758-471-8
Copyright
c
2020 by SCITEPRESS – Science and Technology Publications, Lda. All rights reserved

for the new role of batik in its user community
(Indonesia Indah Batik 8).
Like nowadays, more and more are presenting
printed batik instead of painted batik. With the
existence of this printed batik cloth makes batik
artisans squeezed even more. To maintain the
sustainability and sustainability of the written batik
business, the purpose of this study is to examine the
choice of strategies and what actions are used to deal
with challenges and enter the opportunities that
exist. As well as knowing the advantages possessed
to dominate the market and improve the weaknesses
they have in order to maintain quality and get a
sense of trust from tourists or consumers.
2 STUDY OF LITERATURE
2.1 Definition of SWOT Analysis
SWOT analysis is a comprehensive assessment of
the strengths, weaknesses, opportunities, and threats
of a company. This analysis is needed to determine
several strategies that exist in the company. One of
the things we discuss is the promotion strategy and
product placement (Kotler & Armstrong, 2008: 64).
SWOT is used to assess the strengths and
weaknesses of the company's resources and external
opportunities and challenges faced (Jogiyanto, 2005:
46)
Fred R. David, states that all organizations have
strengths and weaknesses in the functional area of
business. There aren’t company is as strong or weak
in all business areas. The following is an explanation
of SWOT, namely:
a. Strength
Strengths are resources, skills, or other advantages
that relate to the company's competitors and the
market needs that can be served by companies that
are expected to be served. Strength is a special
competition that provides a competitive advantage
for companies in the market (Lita Yulita, etc., 2018).
b. Weakness
Weaknesses are limitations or shortcomings in
resources, skills, and capabilities that effectively
hinder a company's performance. These limitations
are in the form of facilities, financial resources,
management capabilities, and marketing skills that
can be a source of weakness in the company.
c. Opportunities
Opportunities are critical situations that benefit in a
corporate environment. Trends - important trends are
one source of opportunities, such as changing
technology and increasing relationships between
companies and buyers or suppliers is a picture of
opportunities for companies.
d. Threat
Threats are critical situations that do not benefit in
the corporate environment. Threats are the main
intruder for the current position or desired by the
company. The existence of new or revised
government regulations can be a threat to the
company's success.
2.2 The Function of SWOT Analysis
According to Ferrel and Harline (2005), the function
of SWOT analysis is to get information from
situation analysis and separate it from internal issues
(strengths and weaknesses) and external issues
(opportunities and threats). The SWOT analysis will
explain whether the information indicates something
that will help the company achieve its objectives or
provide an indication that there are obstacles that
must be faced or minimized to meet the desired
income.
3 RESEARCH METHODS
3.1 Data Type
The location of this research is the district in the
Yogyakarta region. This data is collected from
January to June 2019. In this study, the variables to
be examined are the condition of the company,
including the external and internal environmental
conditions of the company, as well as company
variables.
The primary data source is a data source that
directly provides data to the data collector. While
secondary data is a data source that does not directly
provide data to data collectors, but sees other people
or with documents (Sugiyono, 2013: 225). Data
obtained from primary data sources is a direct
response received from the subject in question, while
secondary data is data obtained from surrounding
communities that are not related or have a
relationship with this batik center.
3.2 Method of Collecting Data
Observation is one of the data collection techniques
that not only measure respondents' attitudes
(interviews and questionnaires) but can also be used
to record various phenomena that occur (situations,
conditions). This Observation Method is said to be
the most appropriate to observe directly (in
SWOT Analysis Development of Yogyakarta Batik
159

accordance with Sri Suryaningsum, 2016). This
research conducts observations or direct
observations on the object under study, namely
analyzing the advantages and disadvantages of the
company and taking the threats and opportunities
available.
4 DISCUSSION
4.1 Development of Yogyakarta Batik
The development of batik in Yogyakarta is
increasing because Yogyakarta is known as the city
batik. Seeing this condition, batik artisans are
increasingly challenged to present innovations to
maintain and maintain their existence so that batik
can be loved by all walks of life. Yogyakarta itself
has a variety of motifs, both classical and modern
batik. There are around 400 motifs from Yogyakarta
Batik. Besides motives, color games are presented.
The origin of the basic color of the Yogyakarta batik
is black or white. Although Yogyakarta Batik colors
tend to be dark or black, the black color of
Yogyakarta tends to be bluish.
In the development of the typical batik in
Yogyakarta, interference from many parties is
needed, including batik entrepreneurs, the
government, and the people of Yogyakarta. Some of
the efforts made by the Yogyakarta City
Government to develop batik typical of the city of
Yogyakarta are like issuing a Government
Regulation regarding the use of Gagrak Traditional
Service Clothing in Yogyakarta in the Yogyakarta
City Government, making batik training and
socialization about things in the batik business.
According to some batik observers, if observed,
most of Yogyakarta Batik has a strong and valuable
impression because of its firm motives, while Solo
batik emphasizes beauty (edi peni) with a more
refined motif.
4.2 Analytical Framework Strategy
Formulation
Business strategies are needed by every type of
business, both large and small. According to Fred R.
David in his book entitled Strategic Management
Concepts, the analytical framework for formulating
strategies can be applied to all organizational sizes
and types and can help the strategists identify,
evaluate and choose strategies.
The analytical formulation framework, according
to Fred R. David, consists of 3 stages, namely:
1) STAGE 1: INPUT STAGE
This stage contains basic input information needed
to formulate a strategy. The techniques from the
input stage consist of:
a. External Factor Evaluation Matrix (EFE)
b. Competitive Profile Matrix (CPM)
c. Internal Factor Evaluation Matrix (IFE)
2) STAGE 2: MATCHING STAGE
This stage focuses on creating alternative strategies
that come in with respect to the main external and
internal factors. The techniques from the matching
stage consist of:
a. Strength-Weakness-Opportunity-Opportunity
(SWOT) Matrix
b. Strategic Position Matrix and Action
Evaluation (SPACE)
c. Boston Consulting Group (BCG) Matrix
d. Internal-External (IE) Matrix
e. Large Strategy Matrix
3) STAGE 3: DECISION STAGE
This stage uses input information from Phase 1 to
objectively evaluate alternative strategies identified
from Phase 2. The techniques from the decision
stage are the Quantitative Strategic Planning Matrix
(QSPM).
5 RESULT AND DISCUSSION
Stage 1: Input Phase
IFE MATRICS (Internal Factor Evaluation)
Internal factors are factors related to the conditions
that exist in the company and owned by the
company. These internal factors can then become the
strengths and weaknesses of the company. If the
company has these factors well, it will be a strength,
and vice versa, if the condition of these factors is not
good, it will be a weakness for the company.
No Internal Key
Factor
Quality Rating Rating
Quality
Strengths
1. Skilled
Workforce
0.14 4 0.56
2. Advertising 0.08 3 0.24
3. Production
Equipment
and
Machinery
0.12 4 0.48
4. Product
Privileges
0.10 4 0.40
ICBEEM 2019 - International Conference on Business, Economy, Entrepreneurship and Management
160
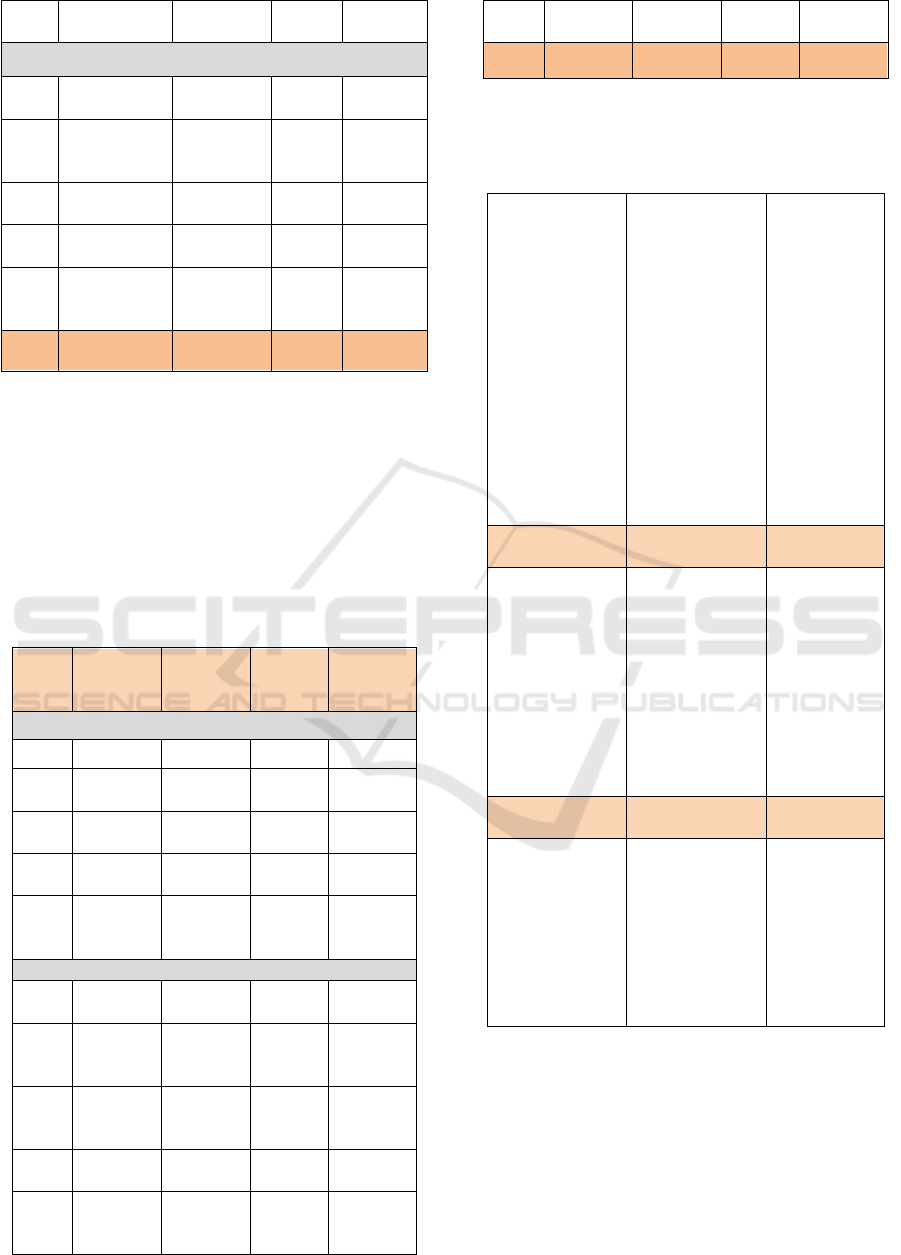
5. Price
Strategy
0.08 3 0.24
Weaknesses
1. Employee
Benefits
0.06 2 0.12
2. Raw
Material
Inventory
0.10 2 0.20
3. Company
Finance
0.12 1 0.12
4. Location of
Company
0.12 1 0.12
5. Working
Relationship
Policy
0.08 1 0.08
Total 1.00 2.56
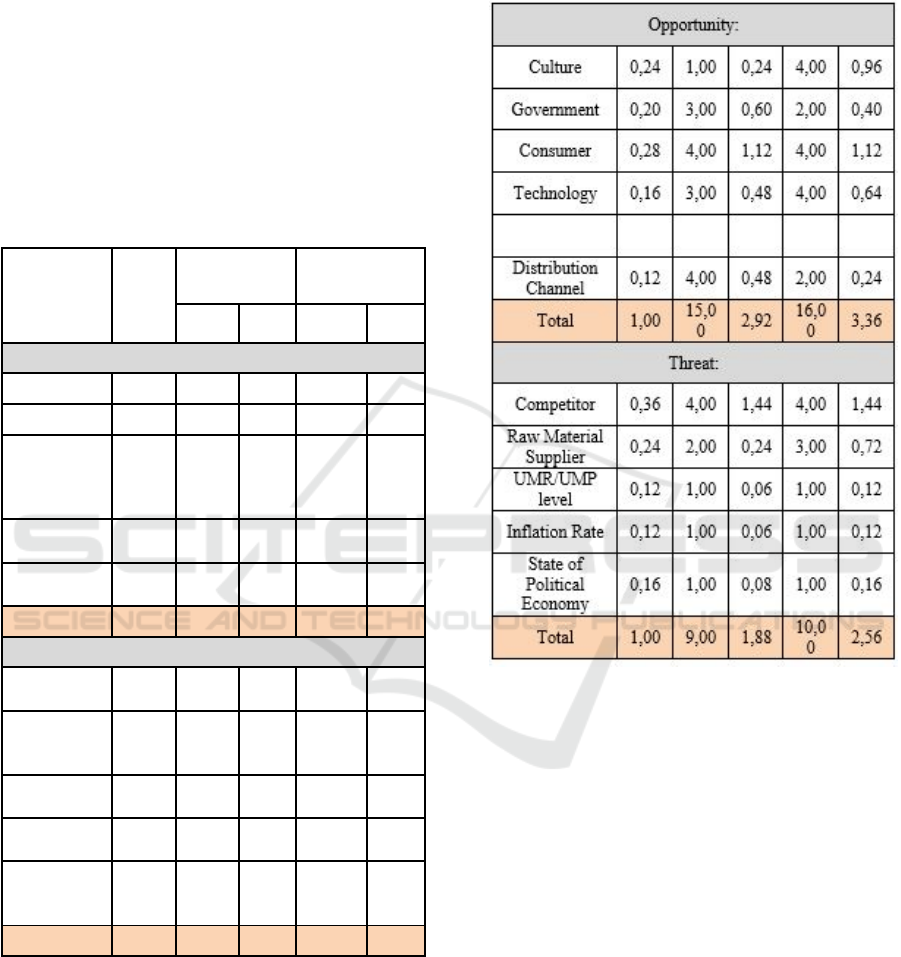
Matriks EFE (Eksternal Factor Evaluation)
External factors are factors related to conditions
outside the company but still affect the company.
These external factors can then become
opportunities and threats for the company. If the
company feels the external factors well and supports
the company, then it will become an opportunity for
the company and vice versa if the conditions of the
external factors are not good, then it will be a threat
to the company.
No Internal
Key
Factor
Quality Rating Rating
Quality
Opportunities
1. Culture 0.12 4 0.48
2. Govern
ment
0.10 3 0.3
3. Consum
er
0.14 3 0.42
4. Technol
ogy
0.08 2 0.16
5. Distribut
ion
Channel
0.06 2 0.12
Threat
1. Competit
or
0.18 4 0.72
2. Raw
Material
Supplier
0.12 3 0.36
3. Minimu
m Wage
Level
0.06 1 0.06
4. Inflation
Rate
0.06 1 0.06
5. Political
and
Economi
0.08 1 0.08
c
Situation
Total 1.00 2.74
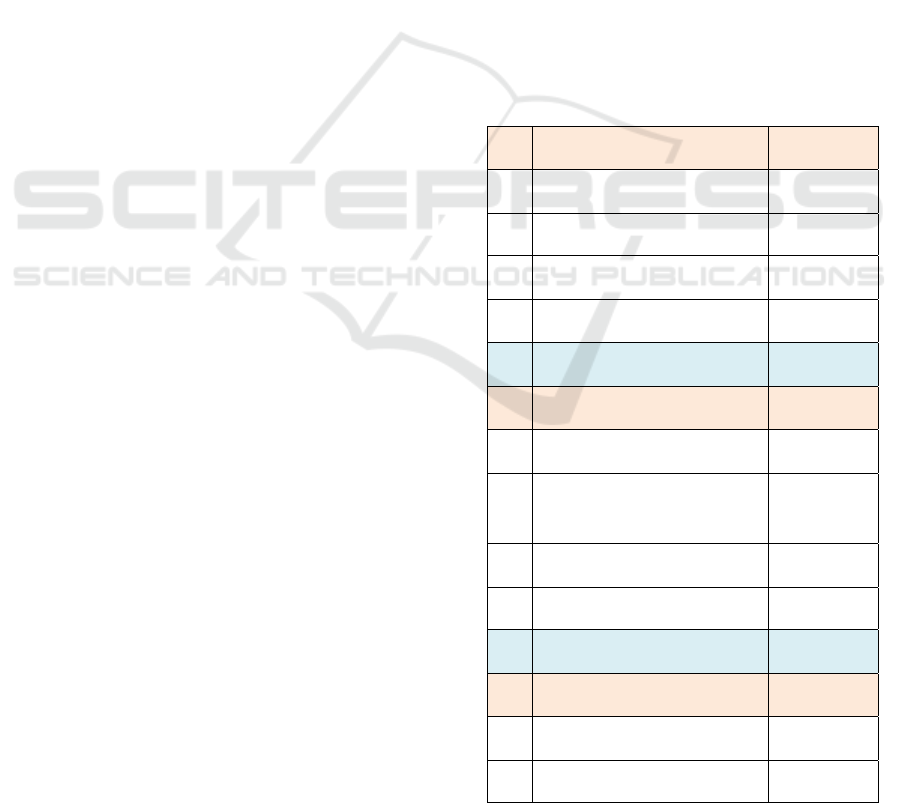
Stage 2: Matching Stage
SWOT Analysis
Internal Factor
External Factor
Strength (S)
1. Skilled
workforce
2. Advertising
3. Equipment
and production
machinery
4. Product
specialty
5. Price strategy
Weakness
(W)
1. raw
material
inventory
2. Corporate
finance
3. Location
of the
company
4. Work
relations
policy
5. Employee
benefits
Opportunity (O) Strategy (SO) Strategy
(WO)
1.Culture
2. Government
3. Consumers
4. Technology
5. Distribution
channels
1. Increasing
innovation in
batik motifs and
designs
(S1, S3, and
O1)
2. Add market
share outside
the city of
Yogyakarta (S4
dan O3, 05)
1. Open new
branches
closer to
cities (W3
and O3, O5)
2. Provide
additional
training for
employees
(W2 and O2)
Threat (T) Strategy (ST) Strategy
(WT)
1. Competitors
2. Raw material
suppliers
3. Level of
UMR / UMP
4. Inflation rate
5. Political and
economic
circumstances
a. Increase
advertising (S2
and T1)
b. Give
discounts on
superior
products (S5
and T1)
Increasing
competitiven
ess in order
to gain new
market share
(W3 and T1)
Based on the results of the SWOT matrix
analysis, the alternative strategies are determined
from the combination of SO, WO, ST, and WT as
follows:
a. Combination of Strengths and Opportunity
(SO)
The advantages possessed by the company are
weapons to introduce products to the market. In
SWOT Analysis Development of Yogyakarta Batik
161
addition to introducing, it is also a weapon as a
defense to maintain existence. Opportunities also
determine which products are capable of or do not
dominate the market with the advantages possessed.
b. Combination of Weaknesses dan
Opportunities (WO)
Batik entrepreneurs have employees from young
people to mothers. The ability possessed by each
employee is limited to batik. The batik writers need
to include every employee in training held by the
government regarding the art of batik. The aim is to
increase productivity so that batik can be better and
also add to the experience of employees in batik
(this combination is obtained from formulations W2
and O2).
c. Combination of Strength and Threat (ST)
One sales strategy that is a strength for the
perpetrators of batik is always innovating written
batik motifs, both combinations of motifs and
creating new motifs. Each of the perpetrators of
batik has a distinctiveness of the batik produced.
Although the type of batik produced is the same as
batik, but every batik artist competes in a healthy
manner and has his own regular customers.
The threat felt by the perpetrators of written batik
is the emergence of new competitors with more
modern production equipment, which costs much
cheaper than other types of batik, and its motives
have been innovating. With such threats, the
perpetrators of batik are careful to produce batik
motifs and treat customers well (this combination is
obtained from formulations (S4, S5, and T1).
The next threat felt by the perpetrators of batik is
if the raw materials sold increase. The strategy
carried out by the perpetrators of written batik is to
buy more raw materials than usual to overcome if
the price of raw materials at any time increases.
Batik entrepreneurs do not need to increase the
selling price of batik if they do not want to lose their
customers (this combination is obtained from
formulas S5 and T2).
d. Combination of Weaknesses and Threats
(WT)
Each of the actors of batik must be able to
produce quality batik from the types of fabrics and
motifs produced to be able to compete with other
batik artisans. Usually, customers who become
permanent consumers of hand-written batik are easy
to re-buy the batik produced because of the
affordable prices and good motives. The better and
more attractive batik produced also helps employees
to increase their income (this combination is
obtained from formulations W3 and T1).
This matrix is a four-point framework that shows
whether an aggressive, conservative, defensive, or
competitive strategy is most suitable for the
development of written batik in the city of
Yogyakarta. The SPACE matrix axis shows two
internal dimensions and competitive advantage and
two external dimensions and industrial strength.
These four factors are probably the most important
determinants of the overall strategy for developing
written writing in Yogyakarta.
SPACE Matrics
This matrix is a four-point framework that shows
whether an aggressive, conservative, defensive, or
competitive strategy is most suitable for the
development of written batik in the city of
Yogyakarta. The SPACE matrix axis shows two
internal dimensions and competitive advantage and
two external dimensions and industrial strength.
These four factors are probably the most important
determinants of the overall strategy for developing
written writing in Yogyakarta.
No
.
Financial Position (FP) Rating
1. Working Capital 3
2. Cash Flow 4
3. Raw Material Inventory 3
4. Sales 4
Average 3.5
Industry Position (IP) Rating
1. Operating Profit 3
2. HR (Human Resources)
available
3
3. Market Share 5
4. Market Demand 5
Average 4
Stability Position (SP) Rating
1. Competitor -2
2. Technological Development -2
ICBEEM 2019 - International Conference on Business, Economy, Entrepreneurship and Management
162
3. Political Stability -4
4. Inflation Rate -1
Average -2,25
Competitive Position (CP) Rating
1. Good Working Relationship -3
2. Wide Market Share -2
3. Product Specialty -3
4. Quality of Raw Materials -1
Average -2.25
X-axis = -2.25 + 4 = 1.75
Y-axis = 3.5 + (-2.25) = 1.2
Koordinat = (1.75 , 1.25)
The SPACE Matrix analysis for the development
of batik in the city of Yogyakarta above indicates an
Aggressive strategy. This Aggressive Strategy
identifies organizations in a very good position in
using internal power to take advantage of external
opportunities, deal with internal weaknesses, and
avoid internal threats. Therefore, market penetration,
market development, product development,
backward integration, future integration, horizontal
integration, or diversification can be feasible
depending on the condition of the company.
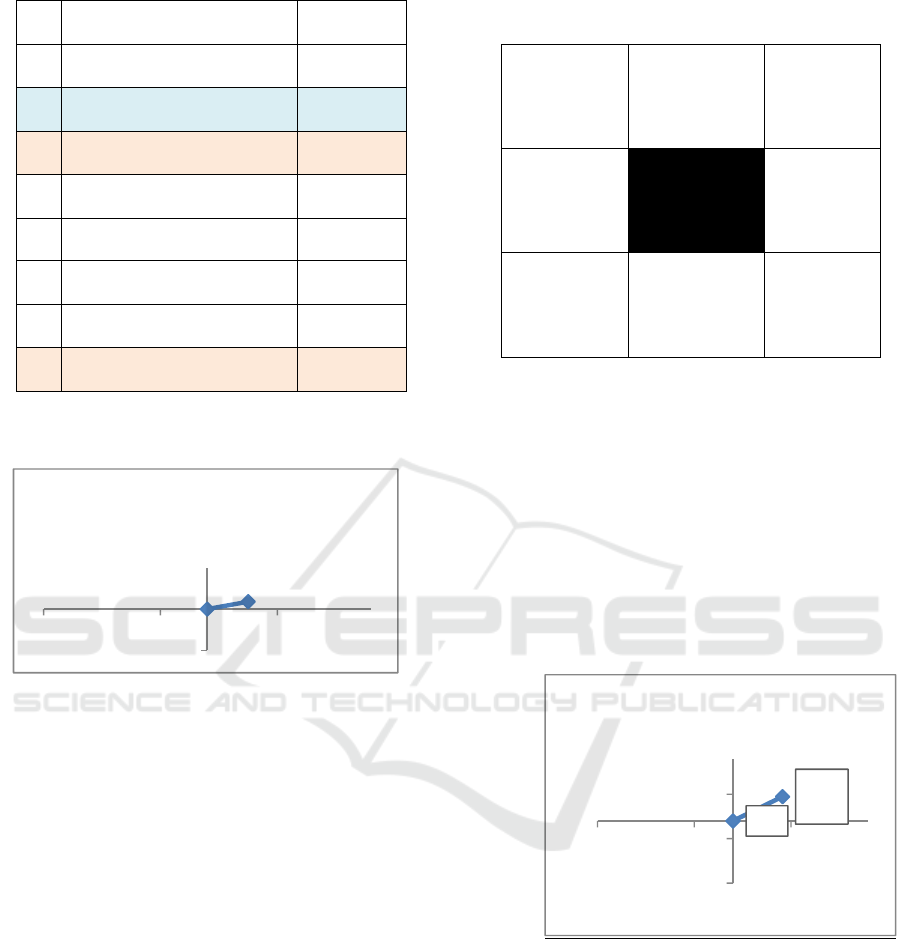
IE Matrics
At this stage, the combination of internal and
external factors will be carried out in which
alternative strategies will be obtained later. The tool
used is an internal-external matrix (IE) consisting of
9 cells. At this stage, it is often called the matching
stage.
TOTAL IFE WEIGHTED SCORE
SEL I
SEL II
SEL III
SEL IV
SEL V
SEL VI
SEL VII
SEL VIII
SEL IX
The internal and external matrix tables above, the
company IFE score 2.56, and EFE 2.74 was
obtained. This shows that for the internal factors to
be responded to on average and for external factors,
the company also responds to the average, which
means that external factors and internal factors have
an effect on determining strategic steps. With these
results, the company is in the position of cell V by
implementing market development and product
development strategies.
Matrics Grand Strategy
Based on the Grand Strategy matrix analysis
above, the development of batik in the area of
Yogyakarta in Quadrant I, namely in the position of
high market growth and strong competitive position.
So the development of Demak Batik is in a very
good strategic position. For this development, the
appropriate strategy is the ongoing concentration of
the current market (market penetration and market
development) and products (product development).
When you have excessive resources, then forward,
backward, or horizontal integration can be an
effective strategy too. When in Quadrant I, it can
0,0
2.56,
2.74
‐7
‐2
3
‐7 ‐23
AxisTitle
AxisTitle
Y‐Values
‐7
‐7 ‐23
X‐axis=1.75,Y‐axis=1.25
Koordinat=(1.75,1.25)
SWOT Analysis Development of Yogyakarta Batik
163
take advantage of external opportunities in several
areas. Besides that, taking risks is aggressive. That
is, dare to take high risks to get big profits.
Stage 3: Decision Phase
This stage is called the decision stage. This stage
uses input from information stage 1 to evaluate
objectively from the results of stage 2 so that a good
alternative strategy can be chosen. The tool used for
this stage is the Quantitative Strategic Planning
Matrix (QSPM).
a. QSPM (Quantitative Strategic Planning
Matrix
This stage uses input from Phase 1 to objectively
evaluate the results of Phase 2. In the QSPM table,
there are 2 alternative strategies given weights so
that a good strategy can be obtained to be selected.
1) Market Penetration
Strength
a. Skilled Workers with AS 3
The presence of skilled labor in the production
process has not yet influenced market penetration.
The energy needed is a marketing manager who is
observant in seeing market opportunities.
b. Advertising with AS 4
Every company always tries to carry out
promotions to get consumers' attention to their
products. Promotion with attractive advertising
methods will certainly invite interest from
consumers to buy products from batik entrepreneurs.
c. Equipment and production processes with AS
3
With the existence of reliable production
machines, it is expected to be able to support
employees in the production process. Timely
production processes are always supported by
reliable production machines.
Critical
Factor
Success
Weig
ht
Market
Penetration
Product
Development
(AS)
(TA
S)
(AS)
(TAS
)
Strength:
Skilled Staf 0,27 3,00 0,81 0,17 0,05
Advertising 0,15 4,00 0,62 4,00 0,62
Production
equipment
and
Machinery
0,23 3,00 0,69 4,00 0,92
Specialty of
product
0,19 4,00 0,77 4,00 0,77
Price
Strategy
0,15 3,00 0,46 3,00 0,46
Total 1,00 17,00 3,35 15,17 2,82
Weakness:
Employee
Benefits
0,13 1,00 0,13 1,00 0,13
Raw
Material
Inventory
0,21 3,00 0,63 3,00 0,63
Company
Finance
0,25 3,00 0,75 2,00 0,50
Location of
Company
0,25 4,00 1,00 1,00 0,25
Work
Relations
Policy
0,17 2,00 0,33 2,00 0,33
Total 1,00 13,00 2,83 9,00 1,83
ICBEEM 2019 - International Conference on Business, Economy, Entrepreneurship and Management
164

d. Employee Benefits with AS 1
Employee benefits have not significantly
affected the company's steps in controlling market
share.
e. Privileges of products with AS 4
By giving innovation to its products, it is
expected that the producers of written batik can get
potential consumers. Products that are different from
batik products, in general, will certainly attract
consumer buying interest.
f. Price strategy with AS 3
The determination of pricing policies is expected
to increase the company's market share. Producers of
written batik offer batik products with prices and
quality that are able to compete with batik products
from other companies.
Weakness
a. Inventory of raw materials with AS 3
Less raw material inventory will certainly reduce
the productivity of the company. Especially if the
price of key raw materials such as rising fabrics, of
course, has an impact on the increase, of course, an
impact on rising prices of batik, which affects the
price of products offered on the market.
b. Corporate Finance with AS 3
In order to capture the market share of batik,
companies must have stable finance so that every
company can be realized. Erisa Batik certainly must
have good financial planning.
c. Company Location with AS 4
The location of a company far from the city
center causes the company's products to be difficult
to reach by consumers. So it is important for
companies to continue to improve promotions so
that consumers can find out the location of the
company.
d. Policies issued by Erisa Batik can affect
employee motivation. Erisa Batika needs to build a
good work culture so that employees have high
loyalty to the company.
Opportunity
a. Culture with the AS 1
The influence of culture influences every product
forcing Erisa Batik to be observant in offering its
products to certain regions. Erisa Batik products that
are dominant with motifs from Javanese culture will
be difficult to accept in areas that have other cultures
because the area has a different culture.
b. Government with AS 3
Collaboration with certain parties or agencies
will increase the market share of Erisa Batik. Some
government policies also help companies get new
customers. As with government policies in the use of
batik uniforms in institutions or school schools.
c. Consumers with AS 4
Consumer purchasing power influences market
share. The higher the consumer's purchasing power
for batik products, the higher the company's
opportunity to increase market share and sales.
Consumers are seen as attractive by companies.
d. Technology with the AS 5
Today many companies use technology as a
marketing tool to get as many consumers as
possible. Maximizing technology starting in the field
of operations and marketing is seen as attractive by
the company.
e. Distribution Channels with AS
Distribution channels are seen as attractive by
companies, due to the presence of good distribution
channels, of course, can add potential customers.
Erisa Batik has opened a showroom to facilitate the
marketing of batik products.
Threat
a. Competitors with AS 4
Competitors represent the biggest threat to
companies in capturing market share. Erisa Batik has
the main competitor, who came from the batik
printing company. In addition, batik originating from
abroad is also one of the competitors because the
price offered is usually below the market price of
local batik.
b. Raw Material Suppliers with AS 3
Raw material suppliers have important
influences on the production process. Raw material
suppliers generally don't only serve one company.
Erisa Batik has suppliers of raw materials that serve
its competitors, as well. Game prices by raw material
suppliers can cause companies to have difficulty in
buying raw materials. Standard suppliers are
attractive to companies.
c. UMR / UMP level with AS 2
Compensation awarding that is in accordance
with the work of the employee is a form of
appreciation for the employee. With the provision of
compensation in accordance with what is determined
by the government, it is deemed attractive by the
company.
d. Inflation rate with AS 1
A stable inflation rate is seen as not attractive by
the company. This is because the company sees that
inflation does not affect consumers' purchasing
power of the company's products.
SWOT Analysis Development of Yogyakarta Batik
165

e. The state of economic politics with the AS 1
The political economy situation has not given a
significant influence on the company, so that it is
considered not attractive to the company.
2) Product Development
Strength
a. Skilled Staff with AS 4
Skilled employees will certainly be able to create
innovations in every product produced. In product
development, innovation is the main key to this
strategy, so that it requires skilled labor. Skilled
workers become very attractive to companies.
b. Advertising with AS 4
Every new product that is produced certainly
requires advertisements to be introduced by
consumers. Erisa's batik products are always
introduced to consumers through brochures and
social networks.
c. Equipment and production machinery with AS
4
A quality product can not be separated from the
engine and equipment. The company has quality
equipment and machinery so that it can produce
quality products.
d. Employee Benefits with AS 1
Employee benefits are considered attractive
enough to motivate employee work performance.
e. Privileges of products with AS 4
Erisa Batik has a striking characteristic in each of
its products. Product features are very attractive,
according to the company, so the company continues
to innovate on its batik products.
f. Price Strategy with AS 3
The price of each product is certainly very
different. The level of difficulty and raw materials
are the determinants of pricing. Price strategies are
considered attractive to companies because they
influence consumer decisions in buying these
products.
Weakness
a. Requires raw materials with AS 4
With sufficient raw materials, of course, the
company is able to run a product development
strategy. Because raw materials are the main factor
in the batik production process. Erisa Batik is
required to have sufficient raw materials in
producing various kinds of batik motifs.
b. Corporate finance with AS 2
Corporate finance that is not overlooked will
certainly have an impact on company productivity
(Sri Suryaningsum and Jogiyanto, Hartono 2018).
Erisa Batik is not yet ready for quite interesting
finances.
c. Location of the company with AS 1
The location of the company is not very
attractive to companies because customers are more
looking at the product while the location of the
company is far from the city center.
d. Policy on employment relations with AS 1
The policies taken are in accordance with the
company's vision and mission. Company policy is
less attractive in the eyes of the company.
Opportunity
a. Culture with the AS 4
Culture is a very influential factor for batik
artisans. The motifs produced by Erisa Batik are
generally rooted in Javanese culture. So that culture
has an important role in product innovation.
b. Government with AS 2
The policies issued by the government have not
had a significant impact on Erisa Batik products, so
that they are quite attractive to companies.
c. Consumers with AS 4
Products produced by Erisa Batik will certainly
greatly affect consumers' buying interest. With
product innovation, consumers will be given a large
selection of batik products from the company. The
company also serves orders whose designs come
from the consumers themselves.
d. Technology with the AS 4
The use of technology will certainly greatly help
Erisa Batik to carry out various product innovations
that are carried out using technology. Technology is
considered attractive to companies.
e. Distribution Channels with AS 1
Distribution channels are considered less
attractive by companies because they have no direct
influence on product innovation.
Threat
a. Competitors with AS 4
Competitors always offer products that are
different from the company. Although there are
some similarities in the motives used, Erisa Batik
always tries to offer products that are different from
competing products.
ICBEEM 2019 - International Conference on Business, Economy, Entrepreneurship and Management
166

b. Raw Material Suppliers with AS 3
Raw material suppliers have a big contribution in
providing quality raw materials for the company. For
companies supplying raw materials, it is considered
attractive because it has a direct impact on the
quality of raw materials for each company's
products.
c. UMR / UMP level with AS 1
The level of UMR / UMP is considered less
attractive because it does not have an impact on
product innovation.
d. Inflation with AS 1
Changing inflation has not affected the company
enough.
e. Political State of Economics with AS 1
The Indonesian political economy is considered
to have less influence on company productivity.
What is obtained from the third problem
statement is that the marketing strategy that is
suitable to be used suitable for Erisa Batik in the
future is the product development strategy with a
total TAS of 5.84. This means that the product
development strategy can be used as a marketing
strategy for Erisa Batik in the years to come.
Strategy Evaluation
A suitable strategy to survive in this industry is an
intensive strategy (market penetration, market
development, product development) and integration
strategies (forward, backward integration, and
horizontal integration) as follows:
a. Market penetration strategy is a strategy to
increase existing market share for products
produced through marketing on a large scale.
b. The market development strategy is a strategy
of introducing existing products to new
marketing areas.
c. The product development strategy is a
substantial modification of existing products
or creating new products but now for
customers through existing channels.
d. The backward integration strategy is a strategy
so that the supervision of raw materials is
increased so that it increases control over the
supplier company.
e. The forward integration strategy is a strategy
so that supervision of goods distribution is
further enhanced so that it further increases
control of the distributor or retailer company.
f. Horizontal Integration Strategy is a strategy of
gaining ownership or increasing control over
competitors.
6 CONCLUSION AND
RECOMMENDATIONS
6.1 Conclusion
In the development of the typical batik in
Yogyakarta, interference from many parties is
needed, including batik entrepreneurs, the
government, and the people of Yogyakarta. Some of
the efforts made by the Yogyakarta City
Government to develop batik typical of the city of
Yogyakarta are like issuing a Government
Regulation regarding the use of Gagrak Traditional
Service Clothing in Yogyakarta in the Yogyakarta
City Government, making batik training and
socialization about things in the batik business.
There are several strategic analyses carried out
for the development of batik in the city of
Yogyakarta, namely:
1)
Input stage: IFE Matrix and EFE Matrix
2) Matching stage: SWOT Analysis, SPACE
Matrix, BCG Matrix, IE Matrix, and Grand
Strategy Matrix.
3) Decision stage: QSPM
Based on the strategy analysis, the most
interesting strategy is the intensive strategy because
the number of attraction scores (5.53) is smaller than
the number of scores on the attraction of the
integration strategy (5.84). That is, the strategy for
developing batik in the city of Yogyakarta is product
development.
6.2 Recommendations
Based on the analysis of data and conclusions, the
author presents several suggestions to the company
as material for consideration in determining
company policy.
1) Creating new innovations in batik motifs from
various cultures in Indonesia and in other
words, producing batik with motifs originating
from motifs of other regions besides
Yogyakarta. For example, making batik motifs
from Papua and marketed in Yogyakarta
because many students and students from
Papua who are in Yogyakarta will certainly
add potential consumers.
2) Dare to open distribution channels outside the
city of Yogyakarta. Because currently, the
number of batik consumers in Indonesia is
increasing.
3) If the company carries out a product
development strategy, the company will need
SWOT Analysis Development of Yogyakarta Batik
167

substantial capital. The capital will later be
used for the addition of competent human
resources, seeking alternative suppliers of raw
materials, and opening strategic distribution
channels. So that the production process and
fulfillment of orders from consumers on time.
REFERENCES
Anas, Biranul. Indonesia Indah: Batik, Jilid 8, Seri
Penerbitan Buku Indonesia Indah, Yayasan Harapan
Kita/BP3 TMII. 1997
David, F. R. dan Forest R. D. 2016. Manajemen Strategik.
(Edisi ke-15). Jakarta: Salemba Empat.
Ferrel,O.C and D, Harline.2005. Marketing Strategy.South
Western: Thomson Corporation.
Jogiyanto. 2005. Analisis dan Desain Sistem Informasi:
Pendekatan Tersruktur Teori dan Praktik Aplikasi
Bisnis. Yogyakarta: Andi
Kotler, Philip and Gary Armstrong. 2008. Prinsip-prinsip
Pemasaran. Erlangga .Jakarta.
Lita Yulita Fitriyani, Sutoyo , Sri Suryaningsum and Vivin
Marlita Rohmawati, 2018. The Influence of
Information Asymmetry, Independent Commissioner
Board, Audit Committee, Managerial Ownership and
Firm Size on Earnings Management. Journal of
Engineering and Applied Sciences, 13: 8148-
8152.DOI: 10.36478/jeasci.2018.8148.8152URL: http
://medwelljournals.com/abstract/?doi=jeasci.2018.814
8.8152
Sugiyono.2013. Metode Penelitian Kuantitatif Kualitatif
Dan R&D. Bandung: Alfabeta
Suryaningsum, Sri. 25 Mei 2017. Lintas Medika. Batik
Tulis Untuk Wisata Dan Perekonomian.
http://www.lintasmedika.com/2017/05/batik-tulis-
untuk-wisata-dan-perekonomian/.
Suryaningsum, Sri. 9 Mei 2017. Peningkatan
Kesejahteraan Dengan Batik.
http://www.lintasmedika.com/2017/05/peningkatan-
kesejahteraan-dengan-baik/
Suryaningsum, Sri. 22 Juli 2017. Perbatikan Nusantara 1.
http://www.lintasmedika.com/2017/07/perbaitikan-
nusantara-1/
Suryaningsum, Sri. dkk. 2019. Bunga Rampai Tata Kelola
Batik Nusantara. Proses terbit.
Suryaningsum, Sri. dkk . 2019. Analisis Perkembangan
Batik Bantul. Jurnal Balitbang Bantul..
Suryaningsum, Sri. dkk . 2019. SWOT Analysis Batik
Bantul. Jurnal MIX Manajemen Bisnis Mercu Buana.
Suryaningsum, Sri. dkk . 2019.Analysis of Kendal Batik
Development. Jurnal Internasional. ISER-658th
International Conference on Economic and Business
Research (ICEBR-2019).
Sri Suryaningsum and Jogiyanto Hartono. 2018. Evidence
of a Shift in the Accrual Earnings Management at
Asian Countries. Journal of Engineering and Applied
Sciences. Volume 13. Issue 10 SI. Page 8136-8141.
DOI1036478/jeasci.2018.8141.
http://medwelljournals.com/abstract/?doi+jeasci.2018.
8136.8141.
Suryaningsum, Sri. Moch. Irhas Effendi. R. Hendri
Gusaptono. 2016. Corporate Social Responsibility
(CSR) PT. Pertamina Terhadap Perbatikan
ICBEEM 2019 - International Conference on Business, Economy, Entrepreneurship and Management
168
