
Policy Evaluation of Purchasing Electricity from Rooftop PV by PT
PLN (Persero) and Its Effectiveness in Increasing the Renewable
Energy Portion on the Energy Mix
R. Andika Bayu Kurniawan and Yudo Anggoro
School of Business and Management, Institut Teknologi Bandung, Jakarta, Indonesia
Keywords: Conversion Factor, Energy Mix, Renewable Energy, Rooftop PV
Abstract: In 2017, global cumulative solar photovoltaic (PV) capacity reached almost 398 GW and generated over 460
TWh. However, total installed solar PV in Indonesia is only 0.017 GWp from the potential capacity of 207.9
GWp. To push the development of solar PV capacity, the government stipulated Minister of Energy and
Mineral Resources Regulation Number 49 of 2018 on Solar Photovoltaic System Utilization by customers of
PT PLN. The energy exported is converted by 65% for non-industrial customers. For industrial customers, it
is subject to capacity charges and emergency energy charges. The objectives of this research are to evaluate
the implementation of the rooftop PV policy, then to observe alternative solutions to optimize it. The program
evaluation method is used. Data obtained through interviews, FGD, and literature reviews. The analysis is
done qualitatively and quantitively. The results are challenges on implementing rooftop faced by utilities
(existing system condition), consumers (65% not appealing), and government (untracked systems); what are
the alternative solutions; how to overcome the intermittent issue.
1 INTRODUCTION
Solar Photovoltaic (PV) technology, which converts
sunlight into electricity, is a rapidly growing
renewable energy resource and assumedly will play a
major role in global energy production. Solar energy
is abundant, and therefore, Solar PV is one of the most
promising renewable energy resources. In 2017,
cumulative solar PV capacity reached almost 398 GW
and generated over 460 TWh, representing around
2% of global power output.
Figure 1: Solar PV Generation and Cumulative Capacity by
Region, 2017 – 2023.
Utility-scale projects account for over 60% of
total PV installed capacity, with the rest in distributed
applications (residential, commercial, and off-grid).
Over the next five years, solar PV is expected to lead
renewable electricity capacity growth, expanding by
almost 580 GW under the Renewables 2018 main
case (Figure 1).
However, the growth in Indonesia is not as
enthusiastic as its peers do. It is a big challenge for
the Directorate General of Electricity (DGE) as a
regulator in the electricity sector in Indonesia on this
matter. As stated in Presidential Regulation Number
24, the Year 2010 concerning Status, Duties, and
Functions of State Ministries and Organization
Structure, Duties, and Functions of Echelon 1 of State
Ministries, Directorate General of Electricity has
duties to formulate and to implement policy and
standards on the electricity sector. One of its mission
is to optimally utilize primary energy sources and
renewable energy by paying attention to their
economics.
Kurniawan, R. and Anggoro, Y.
Policy Evaluation of Purchasing Electricity from Rooftop PV by PT PLN (Persero) and Its Effectiveness in Increasing the Renewable Energy Portion on the Energy Mix.
DOI: 10.5220/0009958905070514
In Proceedings of the International Conference of Business, Economy, Entrepreneurship and Management (ICBEEM 2019), pages 507-514
ISBN: 978-989-758-471-8
Copyright
c
2020 by SCITEPRESS – Science and Technology Publications, Lda. All rights reserved
507

Figure 2: Organizational Structure of DGE.
According to the National Energy Policy, also
mentioned in National Energy Planning Policy, such
objectives of national energy management are:
Optimal energy mix: minimum 23% of
renewable energy in 2025, and minimum 31%
of them in 2050;
Total power generation capacity installed of
115 Gigawatt in 2025 and 430 GW in 2050.
Solar energy is one of the renewable energy
resources that are abundant in Indonesia. However, in
2017, the total installed solar power plant in Indonesia
is merely just 0.017 GWp (Electricity Utilities
Statistic in Indonesia year 2017) from the potential
capacity of 207,9 GWp (RUEN). Therefore, the
government-issued Minister of Energy and Mineral
Resources (MEMR) Regulation Number 49 of 2018
in order to regulate electricity utilization from
Rooftop PV by PLN customers to be absorbed by
PLN without disrupting the operation of the
electricity system given the intermittent electrical
energy from Rooftop PV.
As per MEMR Regulation Number 49 of 2018,
the maximum capacity of Rooftop PV that can be
installed is 100% of the power connected to the
National Electric Company PLN. From this capacity,
the energy exported to the grid is valued at 65% of the
actual exported energy. This provision applies to non-
industry customers, while for industrial customers, it
is subjected to capacity charge and emergency energy
charge costs following the provisions of the Minister
of Energy and Mineral Resources Regulation Number
01 of 2017 on Parallel Operation of Power Plants with
the PT PLN (Persero) Electric Power Network.
From this capacity, the energy exported to the grid
is valued at 65% of the actual export. This provision
applies to non-industry customers, while for
industrial customers, it is subject to capacity charge
and emergency energy charge costs following the
provisions of the Minister of Energy and Mineral
Resources Regulation Number 01 of 2017 on Parallel
Operation of Power Plants with the PT PLN (Persero)
Electric Power Network. These parameters are seen
as discouraging the development of rooftop PV.
2 METHODS
2.1 Conceptual Framework
The exploration of the research is of basis to evaluate
a public policy or regulation that is already
implemented. The program evaluation is chosen
where the policy that will be evaluated could be
associated with the program, where this program
contains an objective to achieve something. And also,
the policy that will be evaluated in this research in
particular.
Framework for program evaluation:
Standards
Utility
Feasibility
Propriety
Accuracy
Engage
stakeholders
Steps
Describe
the program
Gather credible
evidence
Focus the
Evaluation
design
Justify
conclusions
Ensure use
and share
lessons learned
Figure 3: Evaluation Framework.
There are six steps to evaluate a program.
Step 1: engage stakeholders
Step 2: describe the program
Step 3: focus the evaluation design
Step 4: gather credible evidence
Step 5: justify conclusions
Step 6: ensure the use and share lessons learned
ICBEEM 2019 - International Conference on Business, Economy, Entrepreneurship and Management
508

2.1.1 Engage Stakeholder
Table 1: Stakeholder Identification.
No
Stakeholders
Scopes
1
DGE
*
Electrification Ratio, targeting 100%;
Operation Certificate, registered in DGE;
Power purchase agreement approval must be processed via DGE;
BPP calculation approval;
RUPTL of PLN
2
DGNREEC
**
The findings of the evaluation needed by the government in order to make sure that
the program is effectively in line with the government target to meet the RUEN
energy mix target of 23% Renewables Energy in 2025.
3
Jakarta Office of Industrial
and Energy
Solar potential coverage in the region;
Operational Permit must be approved from this agency;
Local Contractor of PV Rooftop must obtain a permit from this agency
4
PT PLN (Persero)
Owner of existing network grid;
The existing contract with IPP;
Energy transaction;
5
Rooftop PV Supplier
Supplier of the equipment of solar PV;
Business affected
*
Directorate General of Electricity
**
Directorate General of New and Renewable Energy and Energy Conservation
2.1.2 Describe the Program
The program here is a product that has been through
a public policy process. There are several motives that
infuse why the policymaker is endorsing the agenda
of issuing the policy. Some of them are energy
trilemma, grid edge, and sustainable development
goals. Paris Agreement on Climate Change also came
out as one of the motives.
The program itself is about the Utilization of
Rooftop Solar Power Generation Systems by
Customers of PT PLN (Persero), as enacted by
Minister of Energy and Mineral Resources
Regulation Number 49 of 2018.
2.1.3 Focus the Evaluation Design
The evaluation designed by conducting several steps:
Literature Review (Background of Public
Policy, Policy Analysis, Energy Trilemma,
Grid Edge overview, Paris Agreement and
SDG, Policy Statement, Levelized Cost of
Electricity)
Arranging interviews with stakeholders to
gather useful data (DGE, DGNREEC, PLN,
and PV Supplier)
Qualitative analysis and calculation if
necessary
Benchmarking with other countries.
2.1.4 Gather Credible Evidence
Collecting interview results to build a
conclusion of policy evaluation
Mapping and collecting necessary data given
by stakeholders or other credible sources
Applicable rules that the current program
related to.
2.1.5 Justify Conclusions
Qualitative and calculation supported the
hypothesis
Benchmark practice in other countries on the
respected matter
Focus Group Discussion related to the issues.
2.1.6 Ensure Use and Shared Lesson
Learned
The evaluation is expected could be reviewed
by the respective agency
And also as an alternative solution for
stakeholders
2.2 Method of Data Collection and
Analysis
Data obtained through interviews, focus group
discussions, as well as literature reviews from books,
journals, publications, and other reliable sources. The
analysis is done qualitatively and also simulates
Policy Evaluation of Purchasing Electricity from Rooftop PV by PT PLN (Persero) and Its Effectiveness in Increasing the Renewable
Energy Portion on the Energy Mix
509

various sensitivity scenarios to calculate the potential
savings that might be obtained by the customer.
3 ANALYSIS
3.1 Business Situation
Generation Cost of Production (BPP) for PLN has
been enacted by Minister of Energy and Mineral
Resources Decree Number 55 K/20/MEM/2019 of
2019 on Cost of Production of Power Plant for PT
PLN (Persero) Year 2018. The decree divided BPP
into one National BPP, six Regional BPP, 25
Distribution BPP, and several systems and sub-
systems BPP. National BPP is 1119 Rp/kWh or 7.86
cents US$/kWh (Rp 14246/US$, Bank of Indonesia
Average Rate Exchange in 2018). The lowest BPP is
in West Java and Central Java Distribution, with 984
Rp/kWh or 6.91 cents US$/kWh, and up to highest
BPP in several Distributions with BPP of 3041
Rp/kWh or 21.34 cent USD$/kWh. Then comes price
constraint on developing solar PV with IPP
mechanism due to regulation of generating
purchasing price by PLN:
In the event that the BPP Generation in the
local electricity system is above the average of
Indonesia National BPP, the purchase price of
electricity from Solar PV shall be a maximum
of 85% (eighty-five percent) of the BPP
Generation in the local electricity system;
In the event that the BPP Generation in the
local electricity system is the same or below the
national BPP average, the purchase price of
electricity from Solar PV shall be determined
based on the agreement of the parties.
The comparison of renewable energy potential in
Indonesia versus its installed capacity based on the
statistic of electricity state in Indonesia year 2017
could be found on this table.
Table 2: Comparison of Potential and Installed Capacity
(the Year 2017 Data).
No
Sources of
Energy
Potential
(MW)
Installed
Capacity
(MW)
Utiliz.
1
Geothermal
29.544
1.805,40
6,11%
2
Hydro
75.091
5.124,06
6,82%
3
Mini-micro
Hydro
19.385
326,08
1,68%
4
Bioenergy
32.654
36
0,11%
5
Solar
207.898
17,02
0,008%
6
Wind
60.647
1,12
0,002%
7
Wave
17.989
n.a
n.a
For solar energy, in 2017, the total installed
capacity of all types of solar PV installed reported to
the government was only 17,02 MW, merely just
0,008% of all its potential could be counted by the
data. So, the potential is there. However, the
utilization is still far from its optimum figure.
Meanwhile, in the roadmap of new and renewable
energy development (EBT) stated on Electricity
Procurement General Plan (RUPTL), 63 MWp of
solar-powered generation newly additional capacity
installed in 2019, from only 17,02 MW installed in
2017. The hope of the installation of rooftop PV
should help to reach this target.
That is why the issuance of Ministry of Energy
and Mineral Resources Regulation number 49 of
2018 on Utilization of Rooftop Solar Power
Generation Systems by Customers of PT PLN
(Persero) should alleviate the number of solar PV
utilization on customers side. However, the
implementation of the regulation should always be
evaluated in terms of attractiveness and the
effectiveness given.
3.2 Results and Discussion
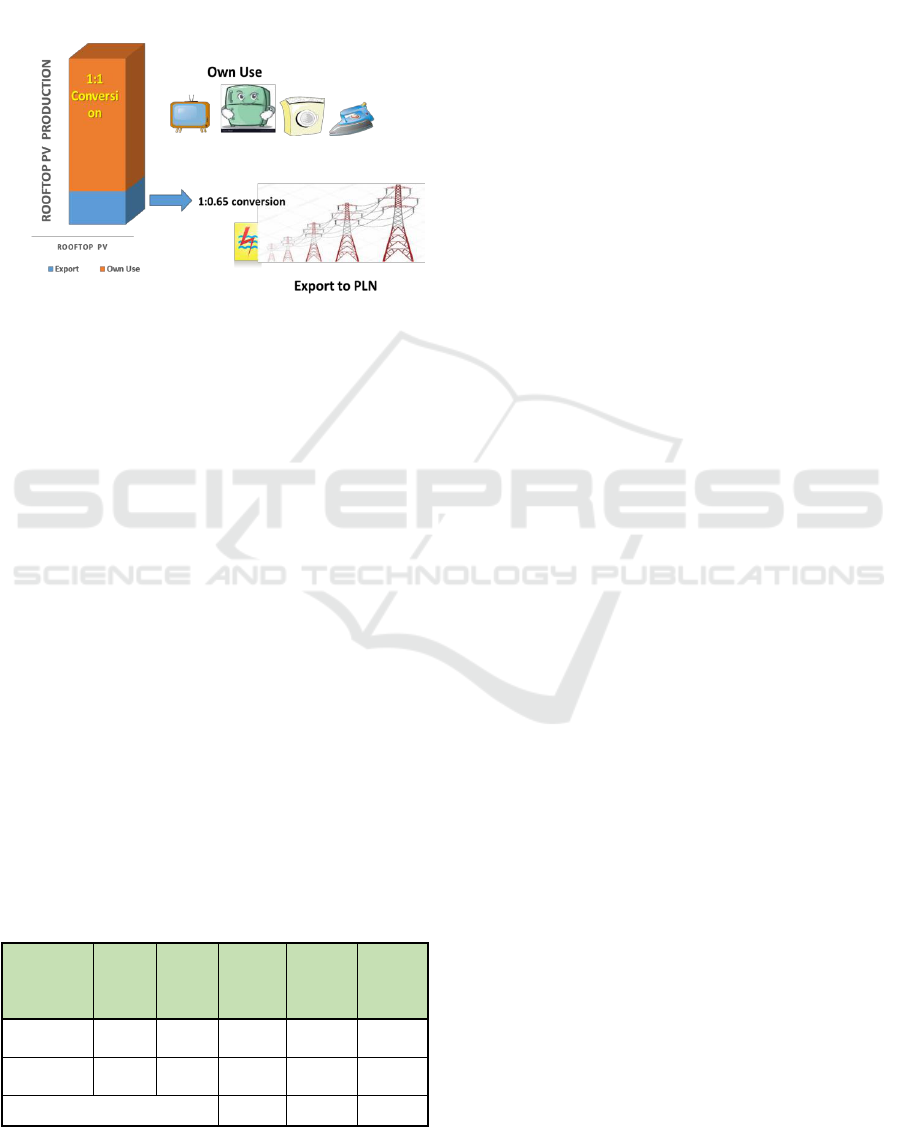
The household consumers of rooftop PV get their
energy from the PV production, all converted in 1:1
ratio if their real energy needs are absorbed for their
own use. Then, if the energy produced from PV is
more than what can they use on their own, the user
may export their surplus of energy (kWh) to the grid
(PLN). However, the conversion would not be in a 1:1
ratio, but a 1:0.65 ratio. Meaning that for every 1 kWh
energy exported to PLN, PLN will count it as 0.65
kWh and will be calculated as energy credit for the
following month's transaction. Illustration of Rooftop
PV Production could be seen in Figure 4.
Customers' electrical energy credit transactions at
the end of the month are calculated as follows:
Customer’s Electricity Bill (kWh) =
Amount of imported kWh – 65% of Amount of
exported kWh
Amount of exported kWh:
amount of kWh exported by customers to PLN,
counted by the export meter
Amount of imported kWh:
amount of kWh imported by customers from
PLN
Notes that:
1. In the case that the amount of electricity
exported is greater than the amount of
electricity imported in the current month, the
ICBEEM 2019 - International Conference on Business, Economy, Entrepreneurship and Management
510
excess will be accumulated and calculated as a
deduction for the following month's bill.
2. The export excess is accumulated for a
maximum of 3 months but will be reset every
April, July, October, and January.
Figure 4: Illustration of Rooftop PV Production of kWh
Calculation.
According to MEMR Regulation No. 49/2018, the
conversion rate of exported kWh to PLN is 1:0.65, or
PLN counted only 0.65 times of the actual kWh it
received from customers with rooftop PV. The 0.65
conversion rate on calculating customers kWh by
PLN is based on the audit result from the Audit Board
of the Republic of Indonesia (BPK) on the 2017 BPP
of generation, which is 62% from the total BPP of
PLN.
The value of the energy produced by PV (export
to PLN) compared to the value of energy imported
from PLN (Electricity Rate) is equal to the value of
PLN's BPP of generation (62% rounded to 65%).
PLN also considered 65% to compensates network
risks.
More consideration is needed since the rooftop
PV would most likely be installed in LV and MV
connected customers and already expensed the
connection charge previously.
3.2.1 Saving Simulation of Residential
Rooftop PV
Table 3: PV Energy Production.
PV
Energy
Production
Power
PU
Durat.
(h)
Energy
PU
% of
total
PV
Energy
% of
Total
Daily
Energy
Self-
Consumed
0.76
4
3.04
76%
16.14%
Exported
to PLN
0.24
4
0.96
24%
5.10%
Total (PU) (Blue Total Area)
4
21.23%
Notes of Table 3:
With this typical production, of the total energy
generated by PV, 76% is self-consumed at
noon and afternoon time (equivalent to 16.14%
of the total kWh (18.84)) when the production
is at peak 1 PU.
Since the energy is excessed by 24% of total
peak production, those energy exported to
PLN’s grid (equivalent to 5.10 % of the total
kWh consumed).
The amount of energy 5.10% (equivalent to
24% of the total energy generated by PV) is
what is affected by the energy transaction
conversion factor.
Of the total energy consumed by households
before installing Rooftop PV, PLN will lose the
selling of kWh of 16.14% plus a 5.10% *
conversion factor (customer savings).
With a conversion factor of 1: 0.65, the total
customer savings is 16.14% + (5.10% * 0.65) =
19.45% of the total kWh consumed.
If the conversion factor for household
consumers is 1:1 instead of 1:0.65, the total
customer savings is 16.14% + 5.10% = 21.24%
of the total kWh consumed, or 1.79% more
saving of energy.
3.2.2 Saving Simulation of Industrial
Rooftop PV
One industry was a customer of PLN with a capacity
contract of 2000 kV (Rate Subclass: I-3), with a load
of 1.500 kW. It was then installed a rooftop PV of 500
kWp capacity.
I-3 rate: 1.115 Rp/kWh (off-peak rate)
L rate: 1.650 Rp/kWh (special service rate)
Assuming peak production time of PV is 3.5
hours, monthly saving from PV production is:
Saving : 3.5 hours x 500 kWp x 30 days x 1.115
equal to Rp. 58.537.500 per month.
Next is the calculation of parallel charge as
additional cost due to parallel operation:
1. Connection charge = Rp. 0
(Already connected with PLN grid, with
contract capacity of 2000 kVA at the first time.)
2. Capacity charge
Highest capacity charge
= Total Net Capable Capacity (MW) x 40
hours x Electricity Rates
= 500 kWp x 40 hours x 1.115 Rp/kWh
= Rp. 22.300.000, -
3. Emergency Energy Charge (EEC)
Assuming Forced Outage Rate (FoR): 5%, then
Policy Evaluation of Purchasing Electricity from Rooftop PV by PT PLN (Persero) and Its Effectiveness in Increasing the Renewable
Energy Portion on the Energy Mix
511

= 1 (time/month) x 2 (hours/trip) x 500 kWp
x 1.650 Rp/kWh
= Rp. 1.650.000, -
Hence,
Total Addition cost of parallel operation
= Rp. 0 + Rp. 22.300.000 + Rp. 1.650.000
= Rp. 23.950.000, -
Thus, the net saving industry gain from
installing 500 kWp capacity (under its contract
capacity) is Rp. 58.537.500 – Rp. 23.950.000 =
Rp. 34.587.500, -.
For the case of rooftop PV with this parallel
operation policy could be associated with grid
compensation that PLN charged to the owner of PV,
for using PLN as backup/supplement. The amount of
capacity charge alone has offset the potential saving
by 38.1% of customers. This should be a
consideration to engage more with industry groups to
help to achieve renewable energy targets of the
energy mix as mandated by RUEN.
This net saving after parallel charges applied
would be the basic calculation on how much would
the investment needed on installing rooftop PV, when
is the BEP, and is it feasible or not considering the
lifetime of the equipment, and so on. These might be
well also addressed as consideration on how the
industry could help them producing cleaner energy
and help the government reach the 23% target of the
renewable energy mix in 2025.
3.2.3 Decreasing Interest of Rooftop PV On-
Grid
Data collected from PT Rekasurya Prima Daya (PT
RPD), one of the distributor and provider of rooftop
PV to be installed on its customer's property. This
company has been marketing its product since 2016,
prior to the commencement of MEMR Regulation
Number 49 of 2018, with total package sold were 25
kWp in 2016, 140 kWp in 2017, and 260 kWp in
2018.
Table 4: PT RDP Rooftop PV Sold in 2016 – 2019 (as of
July 31st).
Year
Capacity
(kWp)
Spots
2016
25
7
2017
140
14
2018
260
9
2019
13
2
"In fact, making customer interest decreases, because
they only got paid 65% of the total kWh exported. In
addition, customers must get permission from PLN,
which sometimes has not been socialized to all PLN
work areas so that the process would take longer."
(Muhammad Fadli Salim, Director of PT RPD, July
29th, 2019).
3.2.4 Distributed Generation Trends
Data collected from FGD, Distributed PV (DPV) is a
disruptive but at the same time unveil opportunities
Rapidly deploy much-needed capacity
Tap new sources of investment capital
Reduce air emissions
Empower consumers
Distributed PV also is challenging on how we
plan, operate, regulate, and even conceptualize the
power system. However, consumers are no longer
waiting for regulatory, legal, and technical issues to
be resolved, leading to untracked systems.
Grid codes/standards are playing an important
role in Distributed PV Grid integration out of 4
trends.
3.2.5 Benchmark
In Malaysia, the Net Energy Metering (NEM) scheme
is similar to what the export-import meter scheme in
Indonesia based on MEMR Regulation Number 49 of
2018. In Malaysia, FiT for Solar PV not viable post-
2017 due to limited RE Fund. It is moving towards
auction since price reduction and NEM to focus on
rooftops (minimize land use). NEM is introduced to
continue the development of the solar PV market. The
difference is, Malaysia applied quota allocation for
NEM; 500 MW for 2016 – 2020 (100 MW per year).
Effective on 1 st January 2019, the Net Energy
Metering (NEM) has been improved by adopting the
true net energy metering concept, and this will allow
excess solar PV generated energy to be exported back
to the grid on a "one on one" offset basis. This means
that every 1 kWh exported to the grid will be offset
against 1 kWh consumed from the grid, instead of at
the Displaced Cost previously. This comparable with
the Indonesia scheme of the conversion rate of 1:0.65,
while in Malaysia, it is 1:1. Since implementing this
1:1 offset basis, the numbers of approved capacity
have been rising double the number of that in the
previous year (Figure 5).
ICBEEM 2019 - International Conference on Business, Economy, Entrepreneurship and Management
512

Figure 5: Total Approved PV Capacity (kWp) by Year in
Malaysia.
Thailand also just launched its Net Energy
Metering scheme. Key points from rooftop PV net
metering launched by Metropolitan Electricity
Authority (MEA) and Provincial Electricity
Authority (PEA) are:
• The capacity quota for MEA: 30 MWp
• The capacity quota for PEA: 70 MWp
• Maximum capacity per meter: 10 kWp
(3-phase power system, 380/220 V) or 5 kWp
(1-phase power system, 220 V)
• Export tariff: 1.68 THB/kWh
• Import tariff: 3.80 THB/kWh
• Tariff period: 10 years
• Connection Charges : 8,500 THB
(9,095 THB incl. tax).
Thailand is currently conducting Peer-to-peer
energy trading using the blockchain pilot project. The
technology of energy transfer's data that would be the
basis of energy transactions will be using blockchain.
The advantage for the nation with this P2P under
blockchain technology:
Support renewable energy
Support Thailand 4.0
Enhance competitive for the Thai industry.
While for the people, it empowers people to
manage energy, besides passive income for
prosumers.
4 CONCLUSIONS
4.1 Challenges of Implementing Rooftop
PV
For utilities, rooftop PV as a distributed generation
can give the opportunities for the system overall and
for utilities by supplying electricity directly to some
percentage of customers, and depending on the status
of the grid infrastructure, allows deferral of capital
investments to maintain and upgrade grids and related
services when these are less economical. However,
grids with distributed generation (including solar
rooftop PV) facing challenges where they become
active and see power flowing in both directions, with
a higher number of active customers to manage and a
change in the load profile by reducing demand from
the central generation. The requirements that allow
management of the flow of electricity in real-time,
including revised roles of network operators and
proper network technology, are yet to be fully
developed in most of the countries. Rooftop PV
utilization requires a network feasibility study, which
should be based on the distribution network grid code,
while there is currently no distribution network grid
code, so there are doubts in it.
For customers, with only 65% of exported kWh
counted in credit, the customer could choose way
under their installed watt capacity rooftop PV, and
use it exclusively for their own use, for a reason that
Cheaper investment
No hassle of re-applying for rooftop PV user to
PLN
No need to change the existing meter.
The export excess is accumulated for a maximum of
3 months, but will be reset every April, July, October,
and January is not really appealing. No benefit for
industry or large-scale rooftop PV with energy
production is bigger than its consumption.
For the government, the preferences of self-
consumed the rooftop PV, not connected with the grid
through net metering, leads to the difficulty of
controlling the amount of intermittent generation
connected to the grid.
4.2 Conversion Factor of 65%
PLN counted only 0.65 times of the actual kWh it
received from customers with rooftop PV. The 0.65
conversion rate on calculating customers kWh by
PLN is based on the audit result from the Audit Board
of the Republic of Indonesia (BPK) on 2017 BPP of
generation, which is 62% from the total BPP of PLN.
The value of the energy produced by PV (export
to PLN) compared to the value of energy imported
from PLN (Electricity Rate) is equal to the value of
PLN's BPP of generation (62% rounded to 65%).
PLN also considered 65% to compensates network
risks.
Policy Evaluation of Purchasing Electricity from Rooftop PV by PT PLN (Persero) and Its Effectiveness in Increasing the Renewable
Energy Portion on the Energy Mix
513

4.3 Possible Alternatives to Conversion
Factor
From the focus group discussion, interviews, and
benchmark on other countries, these could be
alternatives on conversion factor on other rules on
connecting rooftop PV to the grid:
1. 1:1 Conversion Rate for Residential Consumers
that are less commercial
2. 1:0.65 Conversion Rate for Commercial and
Industrial Group of Consumers, however,
eliminating the emergency charge and capacity
charge
3. 1:1 for all groups of consumers, but regulator
limiting the capacity by quota, based on the
feasibility of the sub-system, and according to
the applied grid code.
4.4 Overcoming Intermittent Issue of
Rooftop PV
The difference in network quality in each region
requires rules in rooftop PV interconnection with the
grid as well as rules regarding the operation of
rooftop PV connected to the grid (grid code). The
code is to regulate the technical requirements for
connecting solar power plants based on grid
characteristics. The existence of these codes can
improve the integration of rooftop PV generator
optimization so that the grid is not interrupted by the
presence of intermittent solar PV.
It is better for the customer, especially household
customer, to install rooftop PV with the capacity of
their daylight load capacity, not peak load capacity,
so all production is optimally consumed by house
load.
The evaluation of this research is expected could
be reviewed by respective agencies and stakeholders
and to help the government in reaching the target of
23% Renewable Energy in 2025.
REFERENCES
Chen, Y., 2019, International Collaboration to Foster a
Quality Infrastructure for Globalized PV Markets,
International Renewable Energy Agency.
Denholm, P., Margolis, R. M., Ong, S, et al., 2009, Break-
Even Cost for Residential Photovoltaics in the United
States: Key Drivers and Sensitivities, Technical Report:
NREL/TP-6A2-46909, National Renewable Energy
Laboratory.
Direktorat Jenderal Ketenagalistrikan, 2018, Statistik
Ketenagalistrikan 2017, Edisi 31 Tahun Anggaran
2018.
International Energy Agency, 2018, Renewables 2018,
Analysis and Forecasts to 2023. Available from
https://www.iea.org/renewables2018/ [Accessed in
April 2019].
International Renewable Energy Agency, 2018, Global
Energy Transformation: A roadmap to 2050.
Kementerian Energi dan Sumber Daya Mineral Republik
Indonesia, 2017, Peraturan Menteri Energi dan Sumber
Daya Mineral Nomor 01 Tahun 2017 tentang Operasi
Paralel Pembangkit Tenaga Listrik dengan Jaringan
Tenaga Listrik PT Perusahaan Listrik Negara (Persero).
Kementerian Energi dan Sumber Daya Mineral Republik
Indonesia, 2018, Peraturan Menteri Energi dan Sumber
Daya Mineral Nomor 49 Tahun 2018 tentang
Penggunaan Sistem Pembangkit Listrik Tenaga Surya
Atap oleh Konsumen PT Perusahaan Listrik Negara
(Persero).
Kementerian Energi dan Sumber Daya Mineral Republik
Indonesia, 2019, Keputusan Menteri Energi dan
Sumber Daya Mineral Nomor 55 K/20/MEM/2019
tentang Besaran Biaya Pokok Penyediaan
Pembangkitan PT Perusahaan Listrik Negara (Persero)
Tahun 2018.
Metropolitan Electricity Authority of Thailand, 2019, Peer
to Peer Energy Trading via Blockchain Pilots in
Thailand: A Utility’s Perspective.
Project Information on Power Producer Information
Management System (PPIM) of Provincial Electricity
Authority, Thailand, 2019, Solar power generation
project installed on the roof for the public sector,
housing type, 2019. Available on
https://ppim.pea.co.th/project/solar/detail/5ce68a82de1
e5f00634179ae [Accessed on July 2019].
PT PLN (Persero), 2019, Rencana Usaha Penyediaan
Tenaga Listrik 2019-2028.
Royse, D., Thyer, B.A., & Padgett, D.K., 2010, Program
Evaluation – An Introduction (5
th
ed.), Belmont, US:
Wadsworth.
Sekretariat Negara Republik Indonesia, 2009, Undang-
Undang Republik Indonesia Nomor 30 Tahun 2009
tentang Ketenagalistrikan.
Sekretariat Negara Republik Indonesia, 2014, Peraturan
Pemerintah Nomor 79 Tahun 2014 tentang Kebijakan
Energi Nasional.
Sekretariat Kabinet Republik Indonesia, 2017, Peraturan
Presiden Nomor 22 Tahun 2017 tentang Rencana
Umum Energi Nasional, Lampiran I.
UNFCCC, 2015, Intended Nationally Determined
Contribution Republic of Indonesia.
UNFCCC, 2015, The Paris Agreement.
Vithayasrichareo, P., 2019, The role of flexibility
resources: Policies, regulation and operation practices,
International Energy Agency.
Sustainable Energy Development Authority Malaysia, 2019.
World Economic Forum in collaboration with Bain &
Company, 2017, The Future of Electricity, New
Technologies Transforming the Grid Edge.
World Energy Council and Oliver Wyman, 2018, World
Energy Trilemma Index 2018.
ICBEEM 2019 - International Conference on Business, Economy, Entrepreneurship and Management
514
