
Analysis of Computerization Accounting Information System
Implementation using Technology Acceptance Model (TAM) in
Padang Pratama Tax Service Office
Siti Rahmi, Neva Novianti, Dandes Rifa, Yunilma
Faculty of Economic, Bung Hatta University, Indonesia
Keywords: Infrastructure, Human Resources, Costs, Perception of Use, Perception of Convenience, Accounting
Information System
Abstract: Current technological developments have penetrated the field of information, especially in the field of
accounting information in organizations and companies, because of technological developments, many
companies are switching to using computer-based information technology. This study aims to analyze the
influence of infrastructure, human resources, costs, usefulness perceptions, and perceived ease of
implementation of computerized accounting information systems. The population in this study were
employees of the Padang Primary Tax Service Office. Based on the purposive sampling method, this study
uses a sample of 47 respondents who work as employees of the accounting and finance department. For the
dependent variable (y) of this study is the implementation of computerized accounting information systems.
While for the independent variables are infrastructure (x1), human resources (x2), costs (x3), perceived
usefulness (x4), and perceived ease (x5). The method used is quantitative research methods. This study uses
primary data from the questionnaire. Data were analyzed using multiple regression analysis, which was
processed through IBM SPSS Statistic software ver 20. The results of this study indicate that human resources,
perceived usefulness, and perceived convenience have a positive and significant effect on the implementation
of computerized accounting information systems. But infrastructure and costs do not affect the
implementation of computerized accounting information systems.
1 INTRODUCTION
Current technological developments have penetrated
the field of information, especially the field of
accounting information in organizations and
companies. This is indicated by the existence of
certifications made by the American Institute of
Certified Public Accountants (AICPA) to document
the system expertise of accountants, namely Certified
Information Technology Professional (CITP). Before
the development of technology, as it is today,
individuals in companies carry out accounting
information systems such as recording, processing,
and using information manually. With the existence
of computer-based information technology in
companies, it can provide benefits and convenience
to users in implementing the system. This is
consistent with the research of Wijayanti et al. (2009)
in Devi and Suartana (2014: 170) which shows that
the higher the level of personalization, computer self-
efficacy, and trust, the user will feel the use of
information systems is more useful and easier for
him.
Companies that have sophisticated (computerized
and integrated) information technology and are
supported by modern technology supporting
applications are expected to have a positive impact on
the sustainability of the company's performance by
producing timely, accurate, and reliable financial
reports. (Ratnaningsih and Suaryana, 2014: 2)
The process of developing accounting
information systems often experiences obstacles and
becomes a serious problem for the company. With
these obstacles and constraints, the company must be
able to face the risk of failure and understand how the
accounting information system applied in the
company is said to be successful.
Future events are difficult to predict so that the
planning process to achieve company goals becomes
heavier. Management needs tools to coordinate and
plan limited resources to be able to compete in ever-
Rahmi, S., Novianti, N., Rifa, D. and Yunilma, .
Analysis of Computerization Accounting Information System Implementation using Technology Acceptance Model (TAM) in Padang Pratama Tax Service Office.
DOI: 10.5220/0009958704570468
In Proceedings of the International Conference of Business, Economy, Entrepreneurship and Management (ICBEEM 2019), pages 457-468
ISBN: 978-989-758-471-8
Copyright
c
2020 by SCITEPRESS – Science and Technology Publications, Lda. All rights reserved
457

changing environmental conditions. (Dharmayanti
and Suardhika, 2015: 410)
The combination of individuals, hardware,
software, communication networks, and data
resources that collect, change, and distribute
information in an organization is an information
system. Information obtained from information
processing can be used as the material in decision
making by the authorities in order to advance the
company. (Rosani, 2011 in Devi and Suartana, 2014:
168).
The success of a system is closely related to the
performance possessed by the system. The
benchmark in determining the good and bad
performance of an information system will be seen
through the satisfaction of the user of the accounting
information system itself and the user of the
accounting information system. (Soegiharto, 2001 in
Mardiana et al., 2014: 2)
Modern use of SIDJP is not only for one particular
DGT unit but for all KPPs throughout Indonesia.
KPP, which is a work unit of DGT, has undergone a
modernization of the system and organizational
structure into a function-oriented agency, not on the
type of tax since 2002. So that there are three types of
modern KPP: Large KPP, Medium KPP, and Primary
KPP. (Lestari et al., 2013: 2)
The Attorney General's Office determined six
suspects in the case, namely Bahar as Chairman of the
Management Information System Procurement
Process Committee, Pulung Sukarno as Commitment
Making Officer. Riza Noor Karim, former Director of
Tax Information for the Special Jakarta Regional
Office, and Achmad Sjarifuddin Alasah, former
Secretary-General of the Directorate General of
Taxes. While from the private sector from PT Berca
Herdaya Perkasa, namely Mikael Surya Gunawan and
Liem Wendra Halilingkar. The suspects are subject to
Articles 2 and 3 of the Law on Corruption Crime
(Tipikor) and Presidential Decree (Presidential
Decree) Number 80 of 2003 concerning Guidelines
for the Implementation of Procurement of Goods and
Services.
The ALshbiel and Al-Awaqleh (2011) and
Haleem (2016) studies examine the same thing,
namely the influence of infrastructure and human
resources on the implementation of computerized
accounting information systems. The results of
ALshbiel and Al-Awaqleh (2011: 50) and Haleem
(2016: 137) studies show that infrastructure and
human resources have a significant positive effect on
the implementation of computerized accounting
information systems. But the Soerosemito study
(2014: 73) has different results than research
conducted by ALshbiel and Al-Awaqleh (2011) and
Haleem (2016). The results of this study indicate that
there is no influence between infrastructure and
human resources on the implementation of
computerized accounting information systems.
2 LITERATURE REVIEW
2.1 Technology Acceptance Model
(TAM)
Some models are built to analyze and understand the
factors that influence the acceptance of the use of
technology, including the Theory of Reasoned Action
(TRA), Theory of Planned Behavior (TPB),
Technology Acceptance Model (TAM). (Muslichah,
2015: 171). The Technology Acceptance Model was
introduced by Fred D. Davis in 1986, adopted from
the Theory of Reasoned Action (TRA). The aim of
the Technology Acceptance Model is to give the
theory of developers the success of the design,
evaluation of planning, and implementation of
information systems. The Technology Acceptance
Model is said to adopt the Theory of Reasoned Action
because TRA is the basis for developing a technology
acceptance model to adapt information systems
specifically. The two models have something in
common; they both find the underlying reason for the
user to accept or reject the information system.
Theory of Reasoned Action suggests that interest
in behaving is closely related to an individual specific
behavior, while subjective attitudes and norms are
antecedents of such behavior. According to Davis
(1989: 320), in the concept of the Technology
Acceptance Model, there are two main constructs that
predict interest in behaving in using information
technology, namely perceived usefulness and
perceived ease of use. (Davis, 1989: 320).
The development models in the Technology
Acceptance Model are (1) determining how to
measure the relevant behavioral components of
attitudes, (2) differentiating between beliefs and
attitudes, and (3) determining how external
stimulation, such as objective features and causal
objects connected with beliefs, attitude, and behavior.
(Muslichah, 2015: 171)
Overall, the Technology Acceptance Model
consists of five concepts, namely (1) perceived
usefulness, (2) perceived ease of use, (3) attitudes
towards use, (4) intention to use, and (5) actual use.
(Davis, 1989: 320)
ICBEEM 2019 - International Conference on Business, Economy, Entrepreneurship and Management
458
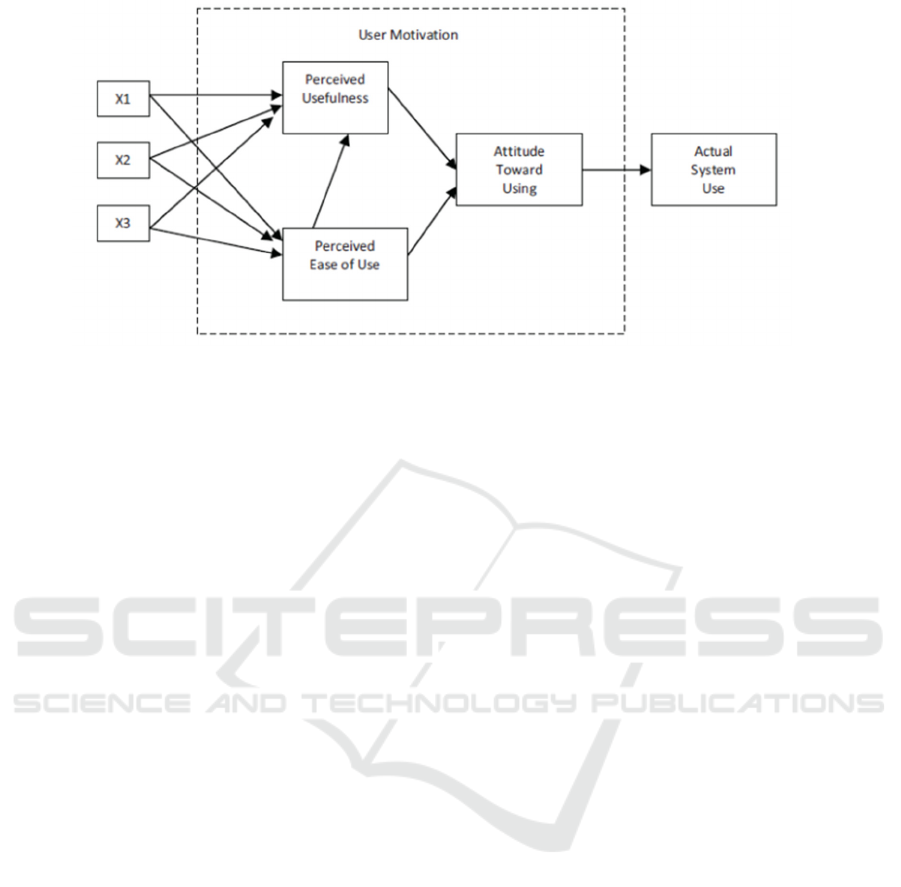
Figure 1 Original Model proposed by Fred Davis in 1989
2.2 Accounting Information System
According to West Churchman in Krismiaji
(2015: 1), the system is a series of components that
are coordinated to achieve a series of goals. The
system has three characteristics, namely (1) the
component is something that can be seen, heard or
felt, (2) the process is an activity to coordinate the
components involved in a system, and (3) the goal is
the ultimate goal to be achieved from the coordination
of these components.
Krismiaji (2015: 14) defines information as data
that has been organized and has uses and benefits.
The characteristics that must be present in the
information to be useful are as follows: (1) relevant,
(2) trustworthy, (3) complete, (4) timely, (5) easy to
understand, (6) verifiable.
Accounting Principles Board (APB) is a
committee for the preparation of accounting
principles established by the American Institute of
Certified Public Accounts (AICPA). The committee
defines accounting as the art of recording, classifying,
and summarizing financial transactions and events in
an efficient manner and in the form of units of money
and interpretation of the results of the process.
Directorate General of Tax Information System
Currently, the modern taxation information
system used is SIDJP (Directorate General of Tax
Information System). SIDJP is a tax administration
system application that replaces SIP (Tax Information
System) and SIPMOD (Modification Tax
Information System). (Saputra et al., 2014: 2)
The definition of SIDJP, according to Directorate
General of Tax Regulation Number PER-160 / PJ /
2006 dated November 6, 2006, is "information
systems in tax administration in the Directorate
General of Tax's modern office environment by using
hardware and software associated with a network at
the Head Office." Whereas according to SE-19 / PJ /
2007 dated April 13, 2007, the application of SIDJP
is "the Directorate General of Tax Information
System application that combines all taxation
applications available at DGT, namely SIP, SAPT,
SISMIOP, SIG, and SIDJP in the current version."
(Saputra, 2014: 4)
The Information System of the Directorate
General of Taxation provides supporting facilities for
the creation of accurate taxpayer data with the active
participation of each section in monitoring taxpayer
data. The system produces reports that can be
accessed by KPP, Regional Offices, and DGT
Headquarters.
2.3 Implementation of Computerized
Accounting Information Systems
According to ALshbiel and Al-Awaqleh (2011: 45),
the implementation of computerized accounting
information systems is the integration of manual
accounting science and applying it to computers by
balancing tasks performed manually with computer
activities.
System implementation is the process of installing
hardware and software and making accounting
information systems become and can be run. This
process generally consists of developing plans,
developing and testing software, preparing locations,
installing, and testing systems. (Romney and
Steinbart, 2005: 395)
2.4 Infrastructure
According to Romney and Steinbart (2014: 11),
information technology infrastructure is technology-
Analysis of Computerization Accounting Information System Implementation using Technology Acceptance Model (TAM) in Padang
Pratama Tax Service Office
459

based equipment to be used in order to process data,
including computers, peripheral devices, and
equipment for network communication. This
component together allows accounting to fulfill three
important functions in the organization, namely:
1. Collect and store data about the activities
carried out by the organization, the resources affected
by these activities, and the actors involved in the
various activities so that the management, employees,
and other interested parties can reviewing things that
happened.
2. Change the data in the information that is useful
for management to make decisions in planning,
implementing, and monitoring activities.
3. Provide adequate controls to safeguard
organizational assets, including organizational data,
to ensure that the data is available when needed,
accurate, and reliable.
2.5 Human Resources
Human resources include all people who are members
of an organization, each of which has roles and
functions. Human resources are human potential that
is inherent in someone who includes physical and
non-physical potential. Whereas human resources in
the context of public organizations are understood as
human potential inherent in an employee consisting
of physical potential and non-physical potential. The
physical potential is the physical ability that
accumulates in an employee, while the non-physical
potential is the ability of an employee to accumulate
both from the background of knowledge, intelligence,
expertise, skills, human relations. (Sulistyani and
Rosidah, 2009: 10)
The performance of human resources is the ability
of a person or individual, an organization
(institution), or a system to carry out its functions or
authority to achieve its objectives effectively and
efficiently. Its capacity must be seen as the ability to
achieve performance, to produce outputs and results.
(Winidyaningrum and Rahmawati, 2010: 6)
Rivai and Sagala (2011: 6) explain that human
resources need to be managed properly and
professionally in order to create a balance between
human resource needs and the guidance and progress
of business enterprises. This balance is the main key
to success for companies to be able to develop and
grow productively and naturally. The development of
the company's business is very dependent on the
productivity of the workforce in the company. If
human resource management can be carried out
professionally, it is expected that HR can work
productively. Professional HR management must
start from recruitment, selection, classification,
placement according to ability, upgrading or training,
and career development.
2.6 Cost
According to Mulyadi (2010: 8), costs in the broadest
sense are sacrifices of economic resources measured
in units of money that have occurred or that are likely
to occur for certain purposes. In the narrow sense of
costs can be interpreted as a sacrifice of economic
resources to obtain assets.
Seyal and Rahim (2006) in Haleem (2016: 135)
concluded that costs have a direct and significant
relationship to technology adoption. Organizations
are reluctant to adopt computerized accounting
systems when setting up initial costs is high.
Donaldkiso (2009) in Haleem (2016: 135) states
that the cost of a computerized accounting system
consists of equipment costs, assembly costs,
installation costs, and testing costs. Specially trained
staff is needed to operate the system. Therefore, large
training costs are incurred to understand hardware and
software usage continuously because newer types of
hardware and software are needed to ensure the
effectiveness and efficiency of the use of
computerized accounting systems. (Haleem, 2016:
135)
2.7 Perception of Benefit
Benefit perception is a level where someone believes
that the use of a particular system can improve
performance. The concept can describe the benefits of
the system for its users relating to productivity, task
performance, effectiveness, the importance of tasks,
and overall usefulness. (Davis, 1989: 320)
When users feel confident, and the use of
technology is not difficult, users will provide greater
benefits and improve performance. So, the higher the
quality of information technology systems will
further improve the usefulness so that it can
determine the success of the implementation of
information technology systems. (Davis, 1989: 320)
2.8 Ease of Perception
Ease of perception is a level where someone believes
that a system used is easy to understand and use, so no
heavy effort is needed. This concept provides an
explanation that the use of information systems and
the ease of use of the system to achieve goals in
accordance with the wishes of users. (Davis, 1989:
320)
ICBEEM 2019 - International Conference on Business, Economy, Entrepreneurship and Management
460
Ease perception is a person's belief about the
decision-making process. If someone feels confident
that the information system is easy to use, that person
will use it. Conversely, if someone does not believe
that the information system is not easy to use, that
person will not use it. (Davis, 1989: 320)
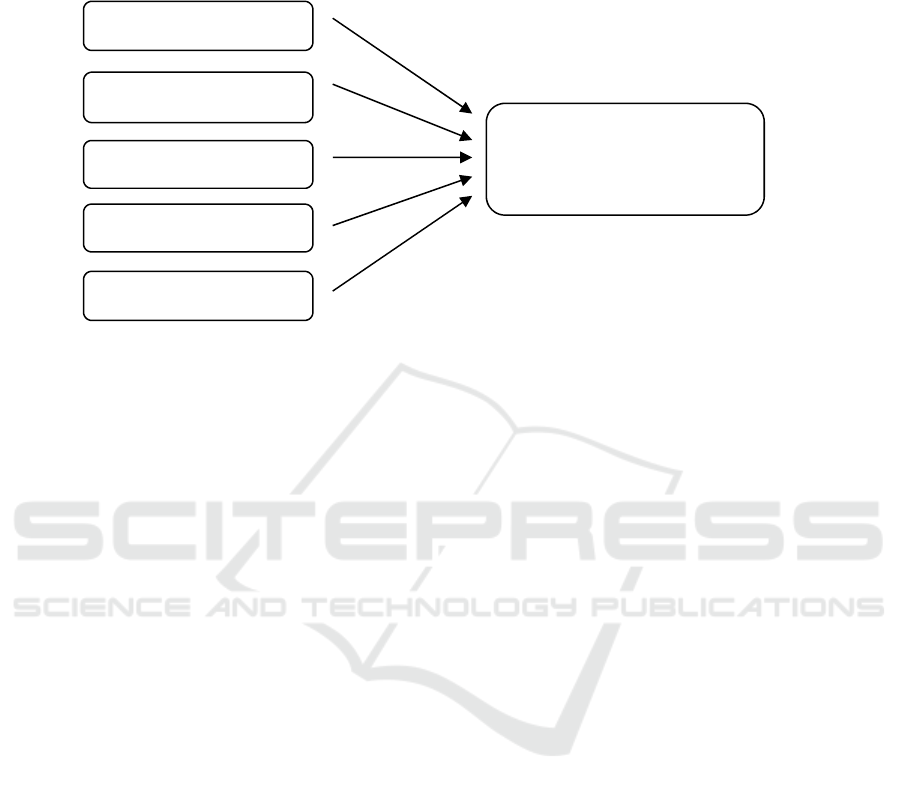
Figure 2 Framework
3 METHOD, DATA, AND
ANALYSIS
The type of research used in this study is quantitative
research. Quantitative methods are methods by which
research data is in the form of numbers as a result of
observation or measurement (Widoyoko, 2012: 21).
This method is used to examine the effect of
infrastructure, human resources, costs, perceived
usefulness, and perceived ease of implementation of
computerized accounting information systems at the
Pratama Tax Office in Padang.
The sample in this study were employees of the
Padang Primary Tax Service Office who used or
played a role in the implementation of computerized
accounting information systems, employees who
worked in accounting and finance, and employees
who were allowed to become respondents. The
sample collection technique used was purposive
sampling method.
3.1 Data Sources
The data sources used in this study are primary data
and secondary data, primary data obtained from
respondents' answers to questionnaires that have been
given to respondents. Respondents in this study were
employees of the Padang Primary Tax Service Office.
Secondary data, obtained from literature, journals,
books, articles, and internet sites.
3.2 Data Collection Technique
The data collection technique used in this study is
survey research because it is done using a
questionnaire as a primary data collection tool that
uses written questions given to respondents. The
technique of data collection is done through a
questionnaire survey that is distributed by a public
relations officer at the Primary Tax Office.
3.3 Data Analysis Technique
Data processing techniques in this study are directed
to test hypotheses and answer all existing problem
formulations. Data analysis techniques used in this
study are as follows:
3.4 Test Reliability
According to Ghozali (2011: 47), a questionnaire is
said to be reliable if the answer to the question given
to someone is consistent or stable over time. To find
out whether or not a variable is reliable, Cronbach
Alpha statistical tests are carried out. A constructor
variable is said to be reliable if it gives the Cronbach
Alpha value> 0.70, so the statement used is reliable.
If Cronbach Alpha is <0.70, the statement used is not
reliable.
3.5 Validity Test
Validity tests are used to measure the validity or
validity of a questionnaire. Ghozali (2011: 52)
Infrastructure
HumanResource
Costs
Perceived usefulness
Perceived ease
Implementation of
computerized accounting
information systems
Analysis of Computerization Accounting Information System Implementation using Technology Acceptance Model (TAM) in Padang
Pratama Tax Service Office
461

explains that a questionnaire is said to be valid if the
question in the questionnaire is able to express
something measured by the questionnaire.
3.6 Descriptive Analysis
Descriptive analysis is a statistic that functions to
describe or explain the distribution of data from one
variable under study, without analyzing and making
conclusions that apply to the public (Indriantoro and
Supomo, 2002).
3.7 Classic Assumption Test
The classic assumption test is used to detect the
presence or absence of classic assumption deviations
or multiple regression equations used.
3.8 Multiple Linear Regression
Multiple linear regression analysis is used to
determine the effect of infrastructure, human
resources, costs, usefulness perceptions, and
perceived ease of computerized accounting
information systems. Model Accuracy Test
3.9 Test F
The F test basically shows whether the model used in
this study is feasible or not feasible continued in this
study. Testing is carried out using a significance level
of 0.05 (alpha = 5%). If the value of Fcount> Ftable,
then the independent variables together have an effect
on the dependent variable.
3.10 Determination Coefficient Test
(R2)
R2 test is used to measure how far the ability of the
model to explain the variation of the dependent
variable. According to Ghozali (2012: 97) in the
regression equation that uses more than one
independent variable, then
R2 value that is well used to explain the regression
equation is the adjusted coefficient of determination
because it has considered the number of independent
variables in a regression model.
3.11 T-test
According to Ghozali (2011: 98), the t-test basically
shows how far the influence of one independent
variable individually explains the variation of the
dependent variable. If t count> t table or p-value
<0.05, it can be concluded that the independent
variable influences the dependent variable.
Conversely, if t count <t table or p value> 0.05, then
the independent variable does not affect the
dependent variable.
4 RESULT AND DISCUSSION
4.1 Reliability Test Results
To measure reliability, Cronbach's Alpha test was
used. A variable is said to be reliable if it gives the
Cronbach's Alpha value> 0.60.
Table 1 Reliability and Reliability Test Results
Variables Cronbach’s Alpha
Corrected item Information
Infrastructure 0,761 0,444 Reliable and valid
Human Resource 0,678 0,528 Reliable and valid
Costs 0,689 0,666 Reliable and valid
Perceived usefulness 0,623 0,816 Reliable and valid
Perceived ease 0,702 0,477 Reliable and valid
Implementation of computerized
accounting information systems
0,885 0,528 Reliable and valid
Source: Primary data processed, SPSS 20
ICBEEM 2019 - International Conference on Business, Economy, Entrepreneurship and Management
462

The table above shows Cronbach's Alpha value for
infrastructure variables of 0.761, human resources of
0.678, costs of 0.689, usefulness perceptions of 0.623,
ease of perception of 0.702, and implementation of
computerized SIA of 0.85. Thus, it can be concluded
that the statement in this questionnaire is reliable
because the value of Cronbach's Alpha is greater than
0.60. The table above shows the variables of
infrastructure, Human Resources, Costs, Perceptions
of Use, Perception of Ease and Implementation of
SIA Computerization has valid criteria for all
question items with a calculated r-value (0.444,
0.528, 0.666, 0.816, 0.477, 0.528) greater than r table
(0.3338) and has a positive value, so the questions or
indicators used are declared valid.
4.2 Normality Test Results
In this study, the normality test was carried out using
the Kolmogorov Smirnov test. The results of the
Kolmogorov Smirnov test can be seen in the table
below:
Table 2 Normality Test Results Using Kolmogorov Smirnov One-Sample Kolmogorov-Smirnov Test
TI TSDM TB TPKEB TPKEM TISIAK
N 47 47 47 47 47 47
Normal Parameters
a
Mean 12.98 20.74 11.26 17.11 23.85 21.28
Std.
Deviation
1.310 2.221 1.799 2.139 1.978 2.243
Most Extreme Differences Absolute .198 .156 .192 .154 .190 .124
Positive .198 .135 .119 .144 .172 .124
Negative -.165 -.156 -.192 -.154 -.190 -.119
Kolmogorov-Smirnov Z 1.357 1.069 1.319 1.053 1.300 .847
Asymp. Sig. (2-tailed) .050 .203 .062 .218 .068 .470
a. Test distribution is Normal.
That data is normally distributed. This can be seen
from the value of Asymp. Sig. (2-tailed) in the
amount of 0.050,0.203,0,062,0,218,0,068,0,470
which is greater than 0.05. So that this research model
meets the test of the classical assumption of
normality.
4.3 Multicollinearity Test Results
The following are the results of multicollinearity tests
using tolerance values and VIF, as follows:
Table 3 Multicollinearity Test Results
Model
Collinearity Statistics
Information
Tolerance
VIF
(Constant)
0,803 1,245
There is no multicollinearity
I
SDM 0,731 1,368
There is no multicollinearity
B 0,914 1,094
There is no multicollinearity
PKEB 0,811 1,233
There is no multicollinearity
PKEM 0,728 1,374
There is no multicollinearity
Source: Primary data processed, SPSS 20
Based on the table above, the tolerance value is close
to 1 or> 0.10, and the VIF value is around 1 or <10
for each variable. The tolerance value for
infrastructure is 0.83, human resources are 0.731,
costs are 0.914, usefulness perceptions are 0.811, and
convenience perceptions are 0.728. Whereas for VIF
Analysis of Computerization Accounting Information System Implementation using Technology Acceptance Model (TAM) in Padang
Pratama Tax Service Office
463

value for infrastructure is 1,245, human resources are
1,368, costs are 1,094, usefulness perceptions are
1,233, and perceived convenience is 1,374. Thus it
can be concluded that the regression model used does
not have a multicollinearity problem and can be used
in this study.
Heteroscedasticity Test Results. The following are
the results of the heteroscedasticity test using the
values of the glejser method, as follows:
Table 4 Heteroscedasticity Test Results
Variable
Sig Information
I
0,623
There is no heteroscedasticity
SDM
0,570
There is no heteroscedasticity
B
0,153
There is no heteroscedasticity
PKEB
0,611
There is no heteroscedasticity
PKEM
0,667
There is no heteroscedasticity.
Based on the table above, the probability values of
infrastructure are 0.623, human resources are 0.570,
costs are 0.153, benefit perceptions are 0.611, and
ease of perception is 0.667. Thus it can be concluded
that there is no heteroscedasticity in all independent
variables because the probability value is more than
0.05.
4.4 Multiple Linear Regression Test
Results
To find out the multiple linear regression equation
used in this study, it can be seen in the table below:
Table 5 Multiple Linear Regression Test Results Coefficients
Model
Unstandardized Coefficients
Standardized
Coefficients
t Sig. B Std. Error Beta
1 (Constant) 7.193 4.445 1.618 .113
TI -.261 .243 -.153 -1.076 .288
TSDM .363 .150 .359 2.418 .002
TB .129 .166 .103 .777 .442
TPKEB .351 .148 .335 2.375 .022
TPKEM .104 .169 .092 .618 .040
a. Dependent Variable: TISIAK
From the table above it is known that the equation in
multiple linear regression in this study is
ISIAK = 7,193– 0,261 X1 + 0,363 X2 + 0,129 X3 –
0,351 X4 + 0,104 X5 + e
The interpretations of each variable coefficient are as
follows:
1. The constant value in this study is 7.193, which
means that if the five variables are 0, then the value
of the implementation of the computerized
accounting information system (Y) is constant at
7.193.
2. The infrastructure variable coefficient (X1) is -
0.261 which means that if the infrastructure value
rises by 1 unit, then the value of the implementation
of computerized accounting information system (Y)
will decrease by 0.261 assuming other variables
remain
3. The variable human resource coefficient (X2) is
0.363, which means that if the value of human
resources rises by 1 unit, then the value of the
implementation of a computerized accounting
information system (Y) will increase by 0.363
assuming other variables remain.
4. The cost variable coefficient is 0.129, which means
that if the cost value (X3) rises by 1 unit, then the
value of the implementation of a computerized
accounting information system (Y) will increase by
0.129, assuming other variables remain.
ICBEEM 2019 - International Conference on Business, Economy, Entrepreneurship and Management
464

5. The variable usefulness perception coefficient (X4)
is 0.351, which means that if the value of the
usefulness perception rises by 1 unit, then the value
of the implementation of the computerized
accounting information system (Y) will decrease by
0.351 assuming other variables remain.
6. The ease of perception variable coefficient (X5) is
0.104, which means that if the perceived ease of value
rises by 1 unit, then the value of the implementation
of a computerized accounting information system (Y)
will increase by 0.104 assuming other variables
remain.
4.5 Model Accuracy Test
4.5.1 F Test Results
The F test results can be seen in the table. The F test
is used to see the suitability of the regression model
that has been made, and the rejection area is p-value
(Sig.) <α
Table 6 F Test Results
ANOVA
Model Sum of Squares df Mean Square F Sig.
1 Regression 78.220 5 15.644 4.187 .004
a
Residual 153.184 41 3.736
Total 231.404 46
a. Predictors: (Constant), TPKEM, TI, TB, TPKEB, TSDM
b. Dependent Variable: TISIAK
Source: Primary data processed, SPSS 20
In the above table it is known that the F count value
is 4.187 which means that it is greater than the F table
value of 2.55 with a significance level of 0.004 which
means it is smaller than 0.05, simultaneously has a
significant effect and it can be concluded that the
chosen regression model is appropriate for this
research.
4.5.2 Determination Coefficient Test Results
(R2)
The coefficient of determination test (R2) is used to
determine how much the ability of the dependent
variable can be explained by independent variables.
In this study, using independent variables, namely
infrastructure, human resources, costs, usefulness
perceptions, and perceived ease. While the dependent
variable is the implementation of computerized SIA.
The results of the determination coefficient test (R
Square) are presented in the following table:
Table 7 Determination Coefficient Test Results (R2)
Model Summary
Model R R Square Adjusted R Square
Std. The error of the
Estimate
1 .581
a
.338 .257 1.933
a. Predictors: (Constant), TPKEM, TI, TB, TPKEB, TSDM
The table above shows that the R square value is
0.338. This explains that 33.8% of computerized SIA
implementation variables can be explained by
infrastructure variables, human resources, costs,
usefulness perceptions, and perceived ease. While the
remaining 66.2% is explained by other variables
outside the research model.
4.5.3 Test Results t
The t-test is used to determine the influence of each
independent variable individually on the dependent
variable. The table presents the results of the t-test as
a whole in this study, namely:
Analysis of Computerization Accounting Information System Implementation using Technology Acceptance Model (TAM) in Padang
Pratama Tax Service Office
465
Table 8 Test Results t
Model
t count
t table Sig Information
(Constant) 1,618 2,045 0,000
I -1,076 2,045 0,288
N
o effect
SDM 2,418 2,045 0,002 Significant Positive Effect
B 0,777 2,045 0,442
N
o Effect
PKEB 2,375 2,045 0,022 Significant Positive Effect
PKEM 2,618 2,045 0,040 Significant Positive Effect
Source: Primary data processed, SPSS 20
This test shows a significant level of 0.05. In the table
above, we can see the value of t count for each
independent variable. If the t count is greater than the
t table, then H0 is rejected, which means that there is
an influence of independent variables on the
dependent variable.
4.6 Infrastructure Variable
The results of the t-test analysis for infrastructure
variables obtained t count value of -1.076 <t table of
2.045 with a probability value of 0.288, which means
greater than 0.05, then H0 is accepted, or it can be
said that infrastructure does not affect the
implementation of computerized SIA.
4.6.1 Variable Human Resources
The results of t-test analysis for human resource
variables obtained t count value of 2.418> t table of
2.045 with a probability value of 0.002, which means
smaller than 0.05, then H0 is rejected, or it can be said
that human resources have a significant effect on the
implementation of computerized SIA.
Cost variable
The results of the t-test analysis for the cost variable
obtained by the value of t arithmetic of 0.777 <t table
of 2.045 with a probability value of 0.442 which
means greater than 0.05 then H0 is accepted or it can
be said that the cost does not affect the
implementation of computerized SIA.
4.6.2 Variables of Usefulness Perception
The results of the t-test analysis for the usefulness
perception variable obtained a value of t count of -
2.375 <t table of 2.045 with a probability value of
0.022 which means smaller than 0.05 then H0 is
rejected or it can be said that useful perceptions have
a significant effect on computerized SIA
implementation.
4.6.3 Variable Perception of Ease
The results of t-test analysis for perceived
convenience variables obtained t count value of
0.618> t table of 2.045 with a probability value of
0.540, which means it is more than 0.05, then H0 is
accepted, or it can be said that perceived ease does not
affect the computerized SIA implementation.
5 CONCLUSION
This study examines infrastructure, human resources,
costs, perceived usefulness, and perceived ease of
implementation of computerized accounting
information systems at the Pratama Tax Office in
Padang. The analysis was carried out using the
multiple regression analysis methods with the
Statistical Package for Social Science (SPSS)
Program Ver. 20.
Based on the results of the research that has been
obtained, it can be concluded as a few points below:
1. Infrastructure does not affect the implementation of
computerized accounting information systems.
The results of this study can be seen in the results
of the t test, which shows that the value of t count
(-1,076) is smaller than the t table (2,045) with a
probability value of 2,888, which means greater
than 0.05. The results of this hypothesis test
contradict the results of research from ALshbiel
and Al-Awaqleh (2011: 50) and Haleem (2016:
137), which show that infrastructure has a
significant positive effect on the implementation
of computerized accounting information systems.
This can be caused in the infrastructure there are
some problems that may not have been covered,
such as inadequate modern programs and
ICBEEM 2019 - International Conference on Business, Economy, Entrepreneurship and Management
466

networks used, lack of databases that contribute to
the implementation of computerized accounting
information systems.
2. Human resources have a significant positive effect
on the implementation of computerized
accounting information systems. The results of
this study can be seen in the results of the t test,
which shows the value of t arithmetic (2.418)
greater than the t table (2.045) with a probability
value of 0.002, which means it is smaller than
0.05. The positive regression coefficient value in
the results of this hypothesis can be interpreted
that the better the human resources that contribute
to the utilization of the system, the better the
implementation of existing computerized
accounting information systems.
The results of this hypothesis test support the
results of research from ALshbiel and Al-
Awaqleh (2011) and Haleem (2016), which show
that human resources have a significant positive
effect on the implementation of computerized
accounting information systems.
3. Costs do not affect the implementation of
computerized accounting information systems.
The results of this study can be seen in the results
of the t-test, which shows that the value of t count
(0.777) is smaller than t table (2.045) with a
probability value of 0.442, which means greater
than 0.05. The results of this hypothesis test are
contrary to the results of research from ALshbiel
and Al-Awaqleh (2011: 50), showing that costs
have a significant negative correlation to
computerized accounting information systems.
This can be caused by a lack of financial
allocations for infrastructure improvement, lack
of financial allocations for employee training, and
the development of modern networks in the
implementation of computerized accounting
information systems.
4. Perception of use affects the implementation of
computerized accounting information systems.
The results of this study can be seen in the results
of the t test, which shows the value of t count
(2.377) smaller than the t table (2.045) with a
probability value of 0.022, which means it is
smaller than 0.05. This shows that employees
have perceptions of ease with the existence of a
computerized accounting information system that
greatly helps their work so that employees can
maximize work with the implementation of
computer-based information systems.
5. Perception of ease has a significant positive effect
on the implementation of computerized
accounting information systems. The results of
this study can be seen in the results of the t test,
which shows the value of t arithmetic (2.618)
greater than the t table (2.045) with a probability
value of 0.040, which means smaller than 0.05.
The value of the positive regression coefficient in
the results of this hypothesis can be interpreted
that the higher the perception of a person's ease of
the system, the more it will optimize the
implementation of computerized accounting
information systems. The lower the perception of
a person's ease of the system, the lower the
optimization of the computerized accounting
information system implementation.
REFERENCES
ALshbiel, S. O., and Al-Awaqleh Q. A. (2011). Factors
Affect the applicability of the computerized accounting
system. International Research Journal of Finance and
Economics. ISSN 1450-2887, Issue 64.
Armanda, R., and Hermanto, S. B. (2015). Analysis of the
factors of acceptance and use of technology in
accounting information systems with the TAM
approach. Journal of Accounting Science & Research
Vol. 4 No. 3.
Awosejo, O. J., Kekwaletswe, R. M., Pretorius, P., and
Zuva, T. (2013). The effect of accounting information
systems in accounting. International Journal of
Advanced Computer Research. ISSN (print): 2249-
7277 ISSN (online): 2277-7970) Volume-3 Number-3
Issue-12 September 2013.
Davis, F. D. (1989). Perceived usefulness, perceived ease
of use, and user acceptance of information technology.
Management Information Systems Quarterly Vol. 13
September 3, 1989, pp. 319-340.
Devi, N. L. N. S., and Suartana, I. W. (2014). Analysis of
technology acceptance model (TAM) on the use of
information systems at Nusa Dua Beach Hotel & SPA.
Accounting E-Journal of Udayana University 6.1: 167-
184. ISSN: 2302-8556.
Dharmayanti, N. M., and Suardikha M. S. (2015). Analysis
of factors that influence management performance due
to the use of accounting information systems.
Accounting E-Journal of Udayana University 12.2:
409-421. ISSN: 2302-8556.
Estiningrum, S. D. (2013). Accounting. Tulungagung:
STAIN Tulungagung Press.
Ghozali, I. (2011). Multivariate Analysis Application with
IBM SPSS 20 Program.Semarang: BP UNDIP. ISBN
979.704,015.1. (2012). Multivariate Analysis
Application with IBM SPSS 20 Program. Semarang:
BP UNDIP. ISBN 979.704,015.1.
Analysis of Computerization Accounting Information System Implementation using Technology Acceptance Model (TAM) in Padang
Pratama Tax Service Office
467

Githinji, C. K., Kiminda, R. W., Ofunya. F. A. (2014).
Adoption of computerized accounting systems by
Coffee Societies in Nyeri County, Kenya. European
Journal of Business and Social Sciences, Vol. 3, No.3,
p.p 88-103, June 2014. ISSN: 2235 -767X
Haleem, A. (2016). The factor affecting is computerized
accounting system with the reference to government
department in the Ampara District. EPRA
International Journal of Economic and Business Review
Vol. 4, Issue. 7, July 2016. e-ISSN: 2347 - 9671, p-
ISSN: 2349 - 0187. http://www.kppbumn.depkeu.go.id
Indriantoro, N., and Supomo B. (2014). Business Research
Methods (For Accounting and Management).
Yogyakarta: BPFE Yogyakarta.
Jogiyanto. (2009). Information Technology System.
Yogyakarta: Andi Offset.
Prosecutor's Office Delivers SIDJP Corruption File to
Corruption. December 11, 2014
http://news.liputan6.com
Krismiaji. (2015). Accounting information system.
Yogyakarta: STIM YKPN.
Kurniawan. (2012). IT experts become witnesses to the case
of the Directorate General of Tax Information System.
August 29, 2012. http://news.okezone.com.
Lestari, M., Kertahadi., And Suyadi, I. (2013).
Effectiveness of the Directorate General of Tax
Information System (SIDJP). Journal of Business
Administration (JAB) Vol. 6 No. December 2, 2013.
Mardiana, I.G.E.P., Sinarwati, N.K., and Atmadja, A.T.
(2014). Analysis of factors that influence the
performance of the accounting information system
(SIA) in Village Credit Institutions (LPD) in Susut
District. S1 E-Journal Ak University of Education
Ganesha Accounting Department S1, Volume: 2 No. 1
of 2014.
Mulyadi. (2010). Cost accounting. Yogyakarta: STIE
YKPN.
Muslichah, I. (2015). An antecedent analysis of the
attitudes and intentions of using a Blackberry with the
basis of a technology acceptance model. Business
Strategy Journal. Volume 19 No 2, July 2015. ISSN
0853-7666.
Ratnaningsih, K. I., and Suaryana, I. G. N. A. (2014). The
influence of information technology sophistication,
management participation, and accounting manager
knowledge on the effectiveness of accounting
information systems. Accounting E-Journal of Udayana
University 6.1: 1-16. ISSN: 2302-8556.
Rivai, V., and Sagala, E. J. (2011). Human Resource
Management for the Company. Jakarta: Rajawali Press.
Romney, M. B., and Steinbart, P. J. (2005). Accounting
Information System (Ed. 9th). Jakarta: Salemba Empat.
Romney, M. B., and Steinbart, P. J. (2014). Accounting
Information System (Ed. 13th). Jakarta: Salemba
Empat.
Saputra, R., Astuti, E. S., and Rahardjo, K. (2014). Analysis
of the use of directorate general tax information system
applications (SIDJP) and employee performance.
Journal of Taxation Vol. 3 No. November 1, 2014.
Soerosemito, V.N. (2014). Effect of Infrastructure, Human
Resources, Managerial Performance, E-Decision, and
Software on the Implementation of Computerized
Accounting Information Systems. (Thesis. Sebelas
Maret University Surakarta).
Sugiyono. (2014). Quantitative, qualitative, and R & D
research methods. Bandung:
Sulistyani, A. T., and Rosidah. (2009). Human Resource
Management. Yogyakarta: Graha Ilmu.
Sulistyowati, L. (2013). Analysis of Factors Affecting the
Implementation of Computerized Accounting
Information Systems. (Thesis. Sebelas Maret
University Surakarta.
Sutrisno, E. (2015). Human Resource Management.
Jakarta: Kencana.
Winidyaningrum, C., and Rahmawati. (2010). The
influence of human resources and the use of
information technology on the reliability and timeliness
of local government financial reporting with
intervening variables on internal accounting controls.
National Accounting Symposium XIII. October 13-14,
2010.
Wiyono, G. (2011). Designing Business Research with the
SPSS 17.0 and Smart PLS 2.0 Analysis Tools.
Yogyakarta: STIM YKPN.
ICBEEM 2019 - International Conference on Business, Economy, Entrepreneurship and Management
468
