
Real-time Measurement for Controlling Grounding Resistance
Ismujianto
1
, A. Damar Aji
1
, Isdawimah
1
, Nuha Nadhiroh
1
1
Department of Electrical Engineering, Politeknik Negeri Jakarta, Depok, Indonesia
Keywords: Grounding resistance, real-time, monitoring system, LabVIEW
Abstract: Grounding is the protection system that is useful for transferring the leakage current from an electrical system
to the ground through a grounding electrode buried in the ground. Types of grounding electrodes can be in
the form of rod electrodes, plate electrodes, mesh-connected electrodes or other forms. In order for the
grounding system to function properly, it must be ensured that the grounding system has very small earth
resistance, close to zero. In addition, earth resistance value is influenced by soil resistivity, mineral content,
soil moisture and temperature particularly due to weather changes. Indonesia has two seasons, the dry season
and the rainy season. During the dry season, soil temperatures increase, causing the soil to dry up and the
earth resistance to increase as well. Therefore, to prevent an increase in the value of earth resistance due to
weather change, a grounding system that can be monitored and controlled automatically is needed. The
proposed grounding resistance monitoring system is developed in LabVIEW environment. The voltage
applied to the electrodes will cause current to flow to the ground, so the earth resistance value can be
measured. Experimental results show that the earth resistance value can be measured in real-time, and the
data obtained can be used as feedback to control the earth resistance value.
1 INTRODUCTION
In an electrical system, the safety of equipment
and users or operators against leakage currents and
the danger of thunder is the first priority (Vilacha,
Otero, Moreira, & Miguez, 2015). Therefore, an
grounding system must be used as part of a safety
system. Grounding system is a system that is
intentionally made to connect parts of the equipment
that are secured with a grounded conductor, to
prevent the touch voltage being too high (Lee, Chang,
& Jiang, 2015).
The main purpose of the earthing system is to
provide safety for the system and the personnel
involved in it. There are two main things in the
grounding system, namely a grounding system must
have a ground resistance value close to zero and
prevent potential differences (voltage) between the
electrical system and other elements during
operation(Caetano, Lima, Paulino, Boaventura, &
Cardoso, 2018). In the electrical system, to provide
protection for components from damage caused by
high voltage and leakage currents, a good isolation
and grounding system is needed (Androvitsaneas,
Alexandridis, Gonos, Dounias, & Stathopulos, 2016).
The distance between the grounding electrodes is
one of the important subjects in the design of the
earthing system(Harid et al., 2015; IEEE Guide for
Improving the Lightning Performance of Electric
Power Overhead Distribution Lines, 1997). The
greater the distance between the earth electrodes, the
earth resistance value is also greater. In this study,
another important subject is the depth of the
electrodes burial. The deeper, the smaller the earth
resistance value(Garip & BAL, 2014; Powering and
Grounding Electronic Equipment, 2005).
Some grounding methods that have been
developed at present are the use of grounding
electrodes, associated grounding systems, meshed
(mesh) grounding systems, and plate grounding
systems(Guo et al., 2014).
The amount of grounding resistance value
depends on the specific soil resistance at that location
and the type and dimensions of the grounding system
installed. A location makes it possible to have
different soil structure, both horizontally and
vertically(Clark et al., 2014).
Increasing the value of grounding resistance can
pose a risk to human safety or components in the
system(Clark et al., 2014). To prevent this situation,
there are many different ways to reduce the resistance
120
Ismujianto, ., Aji, A., Isdawimah, . and Nadhiroh, N.
Real-time Measurement for Controlling Grounding Resistance.
DOI: 10.5220/0009910800002905
In Proceedings of the 8th Annual Southeast Asian International Seminar (ASAIS 2019), pages 120-125
ISBN: 978-989-758-468-8
Copyright
c
2022 by SCITEPRESS – Science and Technology Publications, Lda. All rights reserved
value between grounding electrodes and the surface
touch ground. To get the ideal grounding conditions
studies need to be conducted to meet the standard
earth resistance values(Jafari, Kanabar, Member, &
Sidhu, 2019).
In this study, a grounding resistance measurement
method is applied continuously, so that resistance
values can be monitored in real time. Not only
grounding resistance data, ambient temperature is
also measured. The monitoring results will be used as
a baseline in controlling ground resistance values to
overcome changes in grounding resistance values due
to weather change.
2 SYSTEM ESTABLISHMENT
Grounding resistance plays a large role in
planning a good earthing system. The most effective
method of improving the quality of a grounding
system is to make the ground resistance value (R
g
) as
small as possible, ideally zero ohms(Mohos &
Ladanyi, 2015; Saleh et al., 2015). This R
g
value
depends on the resistivity of the soil type (ρ), the
length of the ground electrode (L) and the cross-
sectional area (A) of the ground
electrode(Shariatinasab & Gholinezhad, 2017;
Yamamoto, Yoshioka, Sumi, Yanagawa, & Sekioka,
2015). The value of R
g
on the ground rod is expressed
in the following equation:
(1)
According to the equation above, one of the most
influential factors in determining the value of Rg is
the factor ρ. The value of ρ is influenced by soil
conditions, where the more moist the smaller the ρ is.
Not only that, the resistance value of soil types is also
influenced by acidic pH, soil temperature, salt
content, soil density, weather, and soil type.
In addition, the Rg value can be improved by
enlarging the cross-sectional area, namely by
changing the shape of the ground rod to the shape of
the ground mesh(Kumar & Bharadwaj, 2015). R
g
value on the ground mesh is equal to:
(2)
In this study measurements of ground resistance
at 2 grounding points that have been buried and not
connected to the lightning protection system. The
grounding system used in this research is a ground
mesh system installed in the area of the Jakarta State
Polytechnic Electrical Engineering Laboratory as
shown in Figure 1. Both grounding points are buried
at the same depth, which is 1.5 meters, and have the
same soil conditions. At the first point no treatment
was added to the burying of the ground mesh, while
at the second point the addition of bentonite powder
was made to reduce the ground resistance
value(Manikandan, 2015). Therefore, 2 different
earth resistance values are obtained.
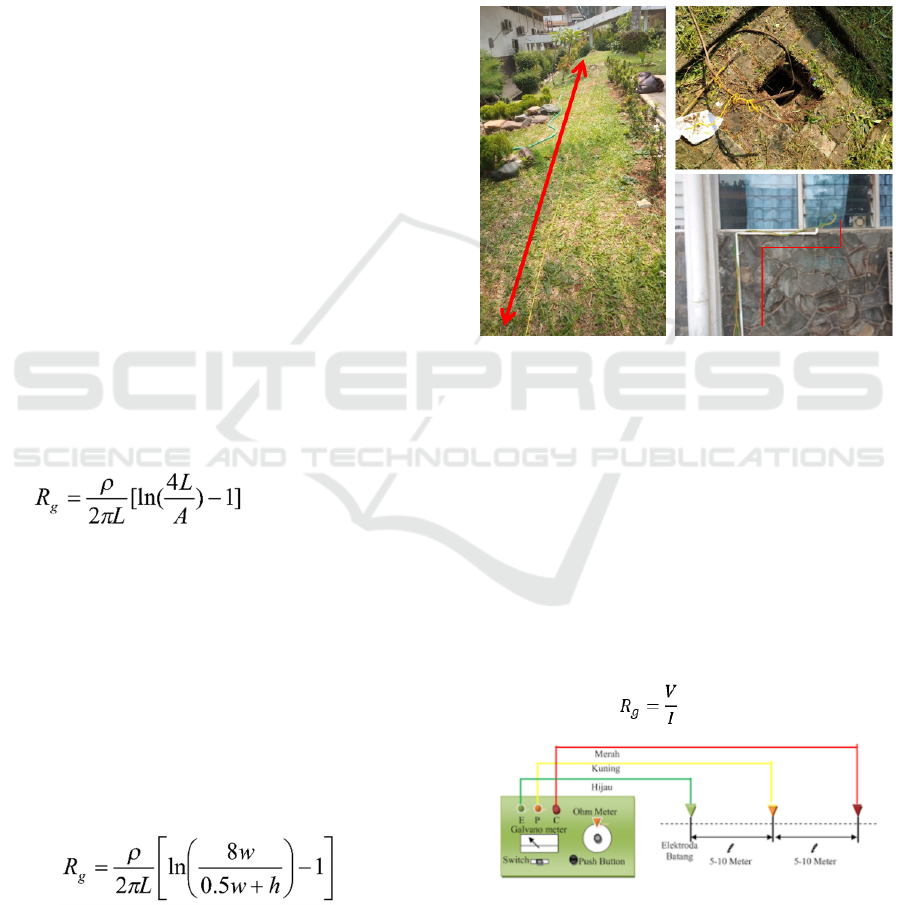
Figure 1. Ground Mesh Location and Wiring
The system developed in this study is in
accordance with the working principle of the earth
tester meter, as shown in Figure 3. The P electrode is
mounted as far as 10 meters from the earthing point,
while the C electrode is mounted as far as 20 meters
from the earthing point. Then the measurement of
earth resistance is made using the inline method. The
current is injected into the earth electrode circuit with
2 auxiliary electrodes, then voltage measurements are
taken. The results of the measured voltage
distribution (V) and the injected current (I) show the
value of Rg, as stated in the following equation:
(3)
Figure 3. Earth Tester Configuration
Real-time Measurement for Controlling Grounding Resistance
121
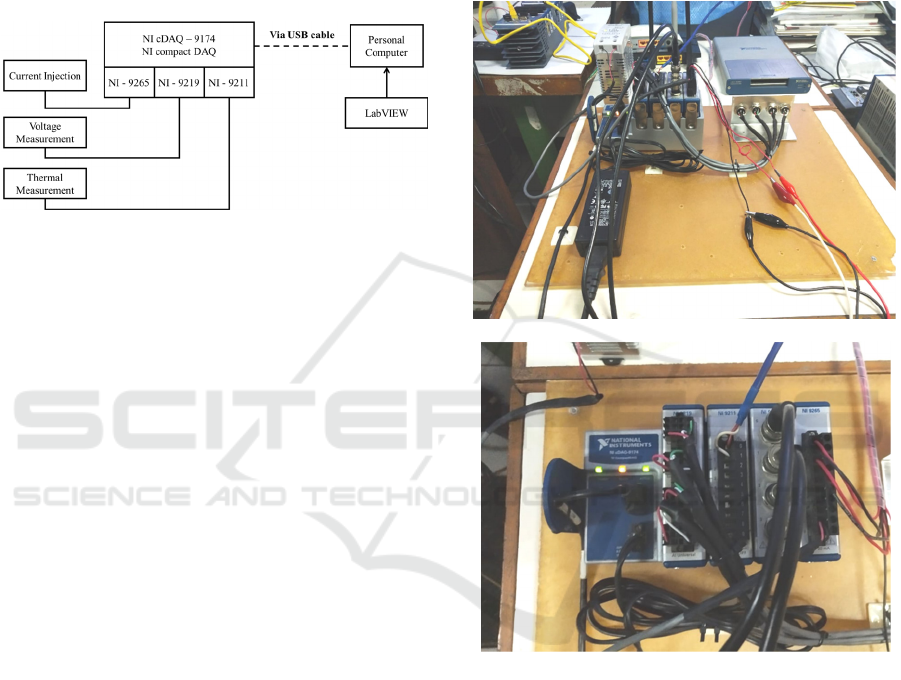
2.1 Hardware
The implementation of the measurement of
grounding resistance continues is developed in the
LabVIEW environment. LabVIEW is a programming
language in the form of graphical languages (Nicola
et al., 2016). This graphical language, like visual
basic, can be used to conduct data acquisition and
analysis. Figure 4 shows the hardware system
architecture in this study.
Figure 4. Hardware Architecture
National Instrument Data Acquisition Card (NI-
cDAQ) 9174 is used to carry out physical data
acquisition such as injection of current, voltage and
temperature (NI cDAQ
TM
-9174 NI CompactDAQ
Four-Slot USB Chasis, 2013). The NI-9265 module
is a current output module(NI 9265 Datasheet, 2015).
Each analog channel has a DAC (digital-to-analog
converter) that can produce current injection. NI-
9219 module is a 4-channel C series universal analog
input module that can be used to measure voltage(NI
9219 Datasheet, 2017). Whereas NI-9211 is C series
temperature input module which is used to measure
ambient temperature(NI 9211 Datasheet, 2015).
The three physical parameters (current, voltage
and temperature) are then acquired by NI cDAQ -
9174. cDAQ communicates with personal computers
via USB cable type B. So users can obtain data in real-
time and continuously. The working principle of this
system is in accordance with the working principle of
the grounding resistance meter as explained above.
Figure 5 shows the use of the NI-module in this study.
2.2
Software
In principle, the software developed in this study,
reads all measurements taken. Communication
between software and hardware takes place through
Ni CDAQ-9174.
Figure 6 shows the software flowchart.
Programming is divided into 2 parts, namely the data
acquisition process and the data logging process. In
the data acquisition process, after being given an
injection of current to the ground of 15 mA, the
measured voltage will be averaged every 10
measurements, so that Vmean is obtained.
Temperature measurements are carried out to
determine the ambient temperature when measuring.
Because the characteristics of temperature change are
very slow, no average temperature is needed. The
output of the data acquisition process is the earth
resistance value at both points (R
GA
and R
GB
) and
ambient temperature (T). The obtained data processed
in the form of time function waveform graphs.
(a)
(b)
Figure 5. NI module installation (a) side view (b) top view
Data logging process is the process of storing data
in the form of a .txt file. Data storage is done in 1
minute intervals. Measuring ground resistance has
been carried out for several days in October 2019.
The output of this data logging process is a
spreadsheet file containing measurement data, as
shown in Figure 7.
ASAIS 2019 - Annual Southeast Asian International Seminar
122
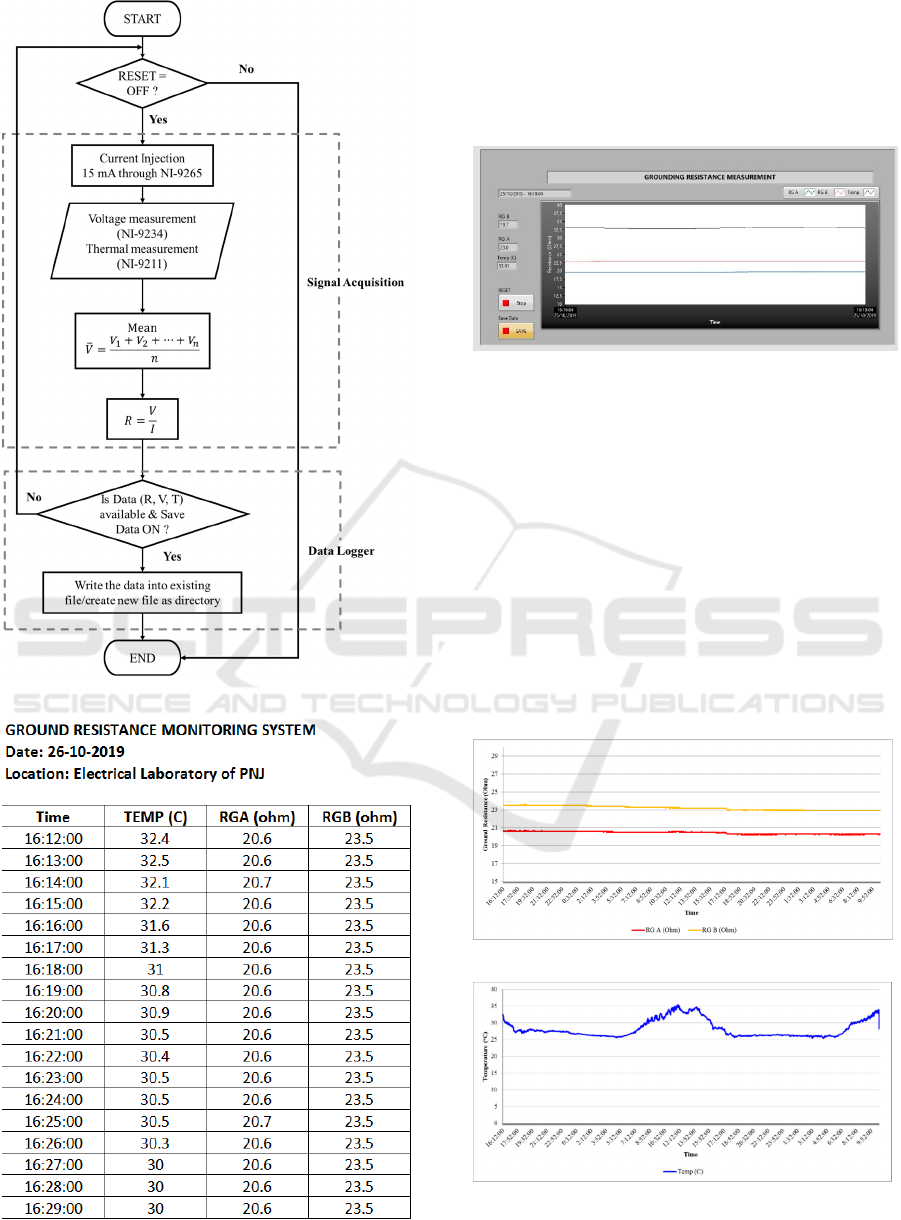
Figure 6. Flowchart of the Software
Figure 7. Spreadsheet file from data logging
3 RESULTS AND DISCUSSION
Real-time measurement of grounding resistance
software successfully shows and records the earth
resistance value, as shown in Figure 8.
Figure 8. Display of Measurement Software
On the front panel, it can be seen the date of
measurement, the magnitude of grounding resistance
at points A and B (R
GA
and R
GB
), and ambient
temperature (T). Not only that, the three physical
parameters are displayed in the waveform graph. The
front panel is also equipped with a "Reset" and "Save
Data" button. The reset button functions to repeat the
measurement, while the save data button must be
activated if the data is stored according to the
specified folder directory.
The continuous testing of the performance of the
grounding measurement system was carried out
during October 2019. The measurement results are
shown in Figure 9 and Figure 10.
Figure 9. Graphic of R
GA
and R
GB
Figure 10. Value of Ambient Temperature
Real-time Measurement for Controlling Grounding Resistance
123

Based on the graph above, the average value
during measurements in October showed an R
GA
value of 23.2 Ohms; R
GB
of 20.4 Ohms; and ambient
temperature of 28.2
o
C. Grounding resistance value is
still very high, this is because special controlling
treatments have not been done to reduce the value of
earthing resistance. The R
GA
value is greater than the
R
GB
value due to the addition of bentonite at point B.
In figure 10, ambient temperature does not show a
significant impact on the measurement of grounding
resistance.
In general it can be stated that the measurement
system developed in the study works well, so that it is
able to measure the value of earth resistance at both
points. Measured data, it can be recorded at intervals
every 1 minute.
4 CONCLUSIONS
In this study, the development of a real-time and
continuous grounding resistance measurement
system shows excellent results. The measurement
system was developed in LabVIEW language and
uses a reliable sensor module and output module.
From the data taken, it is found that the earth
resistance at both earthing points is still far from
ideal, the R
GA
of 23.2 Ohms; R
GB
of 20.4 Ohms. In
subsequent studies the data obtained can be used as
feedback to control the grounding resistance value.
ACKNOWLEDGEMENTS
This research was funded by the Jakarta State
Polytechnic under contract number 215 / PL3.18 / PN
/ 2019 in the Decentralized Research Program "Skim
Penelitian Produk Terapan".
REFERENCES
Androvitsaneas, V. P., Alexandridis, A. K., Gonos, I. F.,
Dounias, G. D., & Stathopulos, I. A. (2016). Wavelet
neural network methodology for ground resistance
forecasting. Electric Power Systems Research, 140,
288–295. https://doi.org/10.1016/j.epsr.2016.06.013
Caetano, C. E. F., Lima, A. B., Paulino, J. O. S.,
Boaventura, W. C., & Cardoso, E. N. (2018). A
conductor arrangement that overcomes the effective
length issue in transmission line grounding. Electric
Power Systems Research, 159, 31–39.
https://doi.org/10.1016/j.epsr.2017.09.022
Clark, D., Guo, D., Lathi, D., Harid, N., Grif, H., Ainsley,
A., & Haddad, A. (2014). Controlled Large-Scale Tests
of Practical Grounding Electrodes — Part II :
Comparison of Analytical and Numerical Predictions
With Experimental Results. IEEE Transactions on
Power Delivery, 29(3), 1240–1248.
Garip, I., & BAL, G. (2014). A New Approach to Measure
and Control Grounding Resistance. 16th International
Power Electronics and Motion Control Conference and
Exposition, 1154–1158.
Guo, D., Clark, D., Lathi, D., Harid, N., Grif, H., Ainsley,
A., & Haddad, A. (2014). Controlled Large-Scale Tests
of Practical Grounding Electrodes — Part I : Test
Facility and Measurement of Site Parameters. 29(3),
1231–1239.
Harid, N., Griffiths, H., Mousa, S., Clark, D., Robson, S.,
& Haddad, A. (2015). On the Analysis of Impulse Test
Results on Grounding Systems. 51(6), 5324–5334.
https://doi.org/10.1109/TIA.2015.2442517
IEEE Guide for Improving the Lightning Performance of
Electric Power Overhead Distribution Lines. (1997).
The Institute of Electrical and Electronic Engineers,
Inc.
Jafari, R., Kanabar, M., Member, S., & Sidhu, T. S. (2019).
A Continuous Monitoring for Neutral Grounding
Resistors and Reactors With Hardware Validation.
IEEE Transactions on Power Delivery, 34(4), 1341–
1349. https://doi.org/10.1109/TPWRD.2019.2894770
Kumar, A., & Bharadwaj, P. D. (2015). Effect of Grid
Parameter Variation on the Performance of Grounding
System. (11), 29–35. Retrieved from http://www.iraj.in
Lee, C. H., Chang, C. N., & Jiang, J. A. (2015). Evaluation
of ground potential rises in a commercial building
during a direct lightning stroke using CDEGS. IEEE
Transactions on Industry Applications, 51(6), 4882–
4888. https://doi.org/10.1109/TIA.2015.2399618
Manikandan, P. (2015). Characterization and comparison
studies of Bentonite and Flyash for electrical
grounding. Proceedings of 2015 IEEE International
Conference on Electrical, Computer and
Communication Technologies, ICECCT 2015.
https://doi.org/10.1109/ICECCT.2015.7225972
Mohos, A., & Ladanyi, J. (2015). Effect of resistance to
earth improvement on performance of pole earthing.
2015 IEEE 15th International Conference on
Environment and Electrical Engineering, EEEIC 2015
- Conference Proceedings, 1409–1413.
https://doi.org/10.1109/EEEIC.2015.7165376
NI 9211 Datasheet. (2015).
NI 9219 Datasheet. (2017).
NI 9265 Datasheet. (2015).
NI cDAQ
TM
-9174 NI CompactDAQ Four-Slot USB Chasis.
(2013).
Nicola, C., Voicu, V., Popescu, S., Niţu, M. C., Iovan, D.,
Duţǎ, M., … Andreescu, S. (2016). Quality analysis of
electric energy using an interface developed in
LabVIEW environment. 2016 International
Conference on Applied and Theoretical Electricity,
ICATE 2016 - Proceedings.
https://doi.org/10.1109/ICATE.2016.7754669
ASAIS 2019 - Annual Southeast Asian International Seminar
124

Powering and Grounding Electronic Equipment (Vol.
2005). (2005). Institute of Electrical and Electronics
Engineers, Inc.
Saleh, S. A., Aljankawey, A. S., Meng, R., Meng, J., Chang,
L., & Diduch, C. P. (2015). Impacts of Grounding
Configurations on Responses of Ground Protective
Relays for DFIG-Based WECSs-Part I: Solid Ground
Faults. IEEE Transactions on Industry Applications,
51(4), 2804–2818.
https://doi.org/10.1109/TIA.2014.2387479
Shariatinasab, R., & Gholinezhad, J. (2017). The effect of
grounding system modeling on lightning-related studies
of transmission lines. Journal of Applied Research and
Technology, 15(6), 545–554.
https://doi.org/10.1016/j.jart.2017.06.003
Vilacha, C., Otero, A. F., Moreira, J. C., & Miguez, E.
(2015). Analysis of a grounding system under a
lightning stroke. IEEE Transactions on Industry
Applications, 51(6), 4907–4911.
https://doi.org/10.1109/TIA.2015.2411663
Yamamoto, K., Yoshioka, K., Sumi, S., Yanagawa, S., &
Sekioka, S. (2015). Mutual Influence of a Deeply
Buried Grounding Electrode and the Surrounding
Grounding Mesh. IEEE Transactions on Industry
Application, 51(6).
Real-time Measurement for Controlling Grounding Resistance
125
