
Comparison of Data Mining Classification Algorithm Performance for
Data Prediction Type of Social Assistance Distribution
Moh. Hidayat Koniyo
1
and Made Sudarma
2
1
Department of Informatics Engineering, State University of Gorontalo, Gorontalo, Indonesia
2
Department of Electrical Engineering, Udayana University, Bali, Indonesia
Keywords:
Classification, Decision Tree, Neural Network, Prediction, Evaluation.
Abstract:
Data on the distribution of social assistance consisting of 11 types of assistance needs to be optimized through
the application of classification algorithms to predict the receipt of types of assistance. Data on aid distribution
was obtained from the Department of Social Services of Gorontalo City. The data will then be used to build
a classification model with the Decision Tree C4.5 algorithm and Neural Network. Furthermore, it will be
evaluated using the confusion matrix method with several testing parameters. The classification model and
evaluation process are carried out using WEKA 3.8.3 data mining tools. Evaluation results are then compared
and analysed so that the algorithm with the best model and performance is selected based on the accuracy
and classification modelling categories on the ROC (Receiver Operating Characteristic) curve, to be used in
predicting new data in the form of prospective recipient social assistance data.
1 INTRODUCTION
Data distribution of social assistance in Gorontalo
City Government, which consists of 11 types of assis-
tance, needs to be optimized through the application
of data mining classification algorithms to predict the
receipt of types of social assistance. The data min-
ing classification algorithm used in this research are
a decision tree C4.5 and a neural network. The se-
lection of these two algorithms is based on various
research results that show the results of performance
analysis with a reasonable degree of accuracy in solv-
ing several classification problems, including: an ef-
ficient and fair scholarship evaluation system can be
realized (Wang et al., 2019), classification trees can be
used to evaluate (Pradeep and Naveen, 2018), used to
construct predictive models (Daoud and Mayo, 2019),
used to predict the occurrence of lost circulation (Ab-
bas et al., 2019), produce mood classification type la-
bels (Sudarma and Harsemadi, 2017), used to classify
Balinese script features (Sudarma and Surya, 2014).
To optimize the performance of data mining clas-
sification algorithms by applying C4.5 and neural net-
works it is expected to know the performance of each
algorithm using the confusion matrix method with
several test parameters to predict data type distribu-
tion for a certain period. In this paper the performance
of the two classification algorithms will be compared,
namely C4.5 and neural network using several param-
eters. The best results are based on accuracy and clas-
sification modeling categories on the ROC (Receiver
Operating Characteristic) curve, to be used in predict-
ing new data in the form of prospective social assis-
tance data.
2 LITERATURE REVIEW
2.1 C4.5 Algorithm
C4.5 algorithm is a machine learning algorithm that is
included in the classification and prediction methods,
forming a decision tree that is useful for exploring
data and finding hidden relationships, so that infor-
mation or knowledge from classified datasets can be
more easily identified (Breslow and Aha, 1997). To
overcome the shortcomings of the decision tree algo-
rithm (ID3) that is too sensitive to work attributes that
have many values (Hssina et al., 2014). In a compar-
ative study conducted (Hssina et al., 2014), explain-
ing that the C4.5 algorithm acts similar to ID3 but en-
hances some ID3 behavior, such as the ability to use
continuous data, unknown value data, using attributes
with different weights, and the ability to trim trees de-
cision made. At each tree node, C4.5 selects one data
336
Koniyo, M. and Sudarma, M.
Comparison of Data Mining Classification Algorithm Performance for Data Prediction Type of Social Assistance Distribution.
DOI: 10.5220/0009910003360342
In Proceedings of the International Conferences on Information System and Technology (CONRIST 2019), pages 336-342
ISBN: 978-989-758-453-4
Copyright
c
2020 by SCITEPRESS – Science and Technology Publications, Lda. All rights reserved
attribute that most effectively divides its sample set
into a set of enriched sections in one class or another.
The criterion is the acquisition of normalized infor-
mation that results from the selection of attributes to
separate data. The attribute with the highest normal-
ized information acquisition was chosen to make a de-
cision (Korting, 2006).
In the C4.5 algorithm, the gain value is used to de-
termine which variable will be the node of a decision
tree (the variable with the highest gain).
Gain(A) = Entropi(S) − Σ
k
i=1
|S
i
|
|S|
xEntropi(S
i
) (1)
This process uses the parameter ”entropy” to mea-
sure the level of heterogeneity of the dataset, where
the greater the value of entropy, the greater the level
of heterogeneity of a data set.
Entropi(S) = Σ
k
j=1
− p jlog
2
p j (2)
Information : S = dataset (case) k = number of
partitions S pj = probability obtained from Sum (Yes)
divided by total cases
2.2 Neural Network Algorithm
Neural Network or better known as ANN (Artifi-
cial Neural Network) is a data mining method that is
widely used to do classification and prediction (Mc-
Culloch and Pitts, 1943). A Neural Network generally
consists of input, output, and hidden layer. And one of
the most popular algorithms used in learning of ANN
is Backpropagation (McClelland et al., 1986). ANN
or Artificial Neural Networks (ANN) is a parallel sys-
tem consisting of many, special non-linear processors,
known as neurons (Markopoulos et al., 2016). Like
the human brain, they can learn from its examples,
they can generalize and fault tolerance, and they can
respond intelligently to new triggers. Each neuron is a
primary processing unit, which receives one or more
external inputs and uses it to produce an output. The
whole system is considered parallel because many
neurons can implement calculations simultaneously.
The most important feature of neural networks is the
structure of the neurons that are connected because
they determine how the calculations are performed.
Starting from the source layer that receives input and
the output layer where the input layer is mapped, neu-
ral networks can have one or more hidden layers be-
tween. Neural networks, known as one or more hid-
den layers, are multilayer perceptron (MLP). These
networks, unlike simple perceptron, are capable of
linearly classifying inseparable patterns and can solve
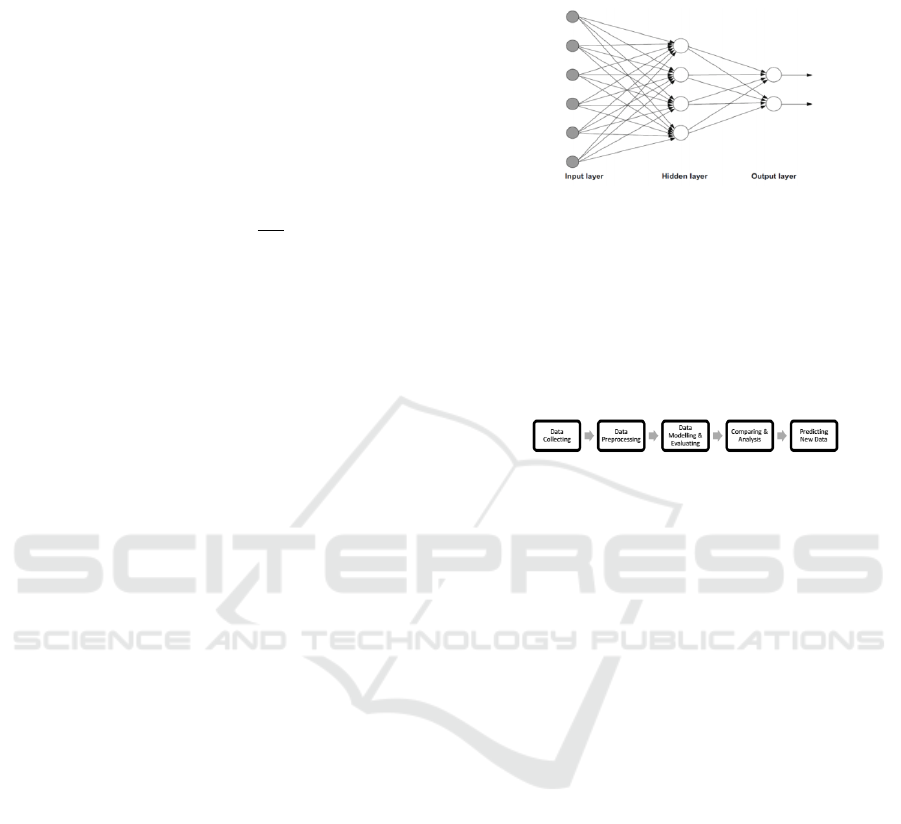
complex problems. Examples of ANN with a single
hidden layer consisting of four units, six source units,
and two output units are shown in Figs.1
Figure 1: Single Hidden Layer Feed Forward ANN 6-4-2
(Markopoulos et al., 2016)
3 RESEARCH METHOD
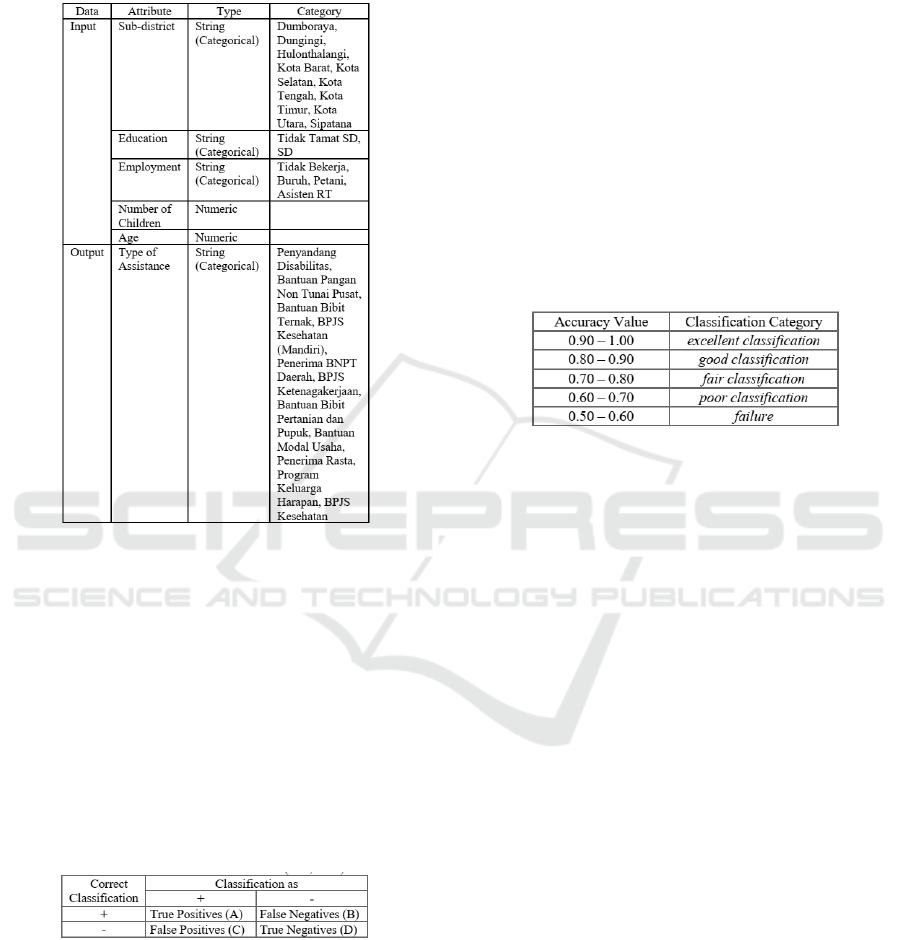
3.1 Research Design
Figure 2: Research Design
Data is collected and selected from a collection of
operational data, then processed to obtain data with
good, complete, and consistent quality. The data that
has been pre-processed is determined as a dataset
which will then be used to build a classification model
with the Decision Tree C.45 and Neural Network al-
gorithm and at the same time be evaluated using the
Confusion Matrix method with several test parame-
ters. The classification model and evaluation process
are carried out using WEKA 3.8.3 data mining tools.
The results of the evaluation are then compared and
analysed so that the algorithm with the best model
is chosen based on the level of accuracy and classi-
fication modelling categories on the ROC (Receiver
Operating Characteristic) Curve, to be used in mak-
ing predictions of new data in the form of prospective
social assistance data.
3.2 Datasets
The data used in this study were recipients of so-
cial assistance data sourced from the Department of
Social Services of Gorontalo City in the database
of aid distribution totalling 123 records. Each data
record consists of 11 criteria with numeric and string
types, namely Trans Code, KKK, Name, Address,
Village, Sub-District, Education, Employment, Num-
ber of Children, Age, and Type of Assistance.
Comparison of Data Mining Classification Algorithm Performance for Data Prediction Type of Social Assistance Distribution
337
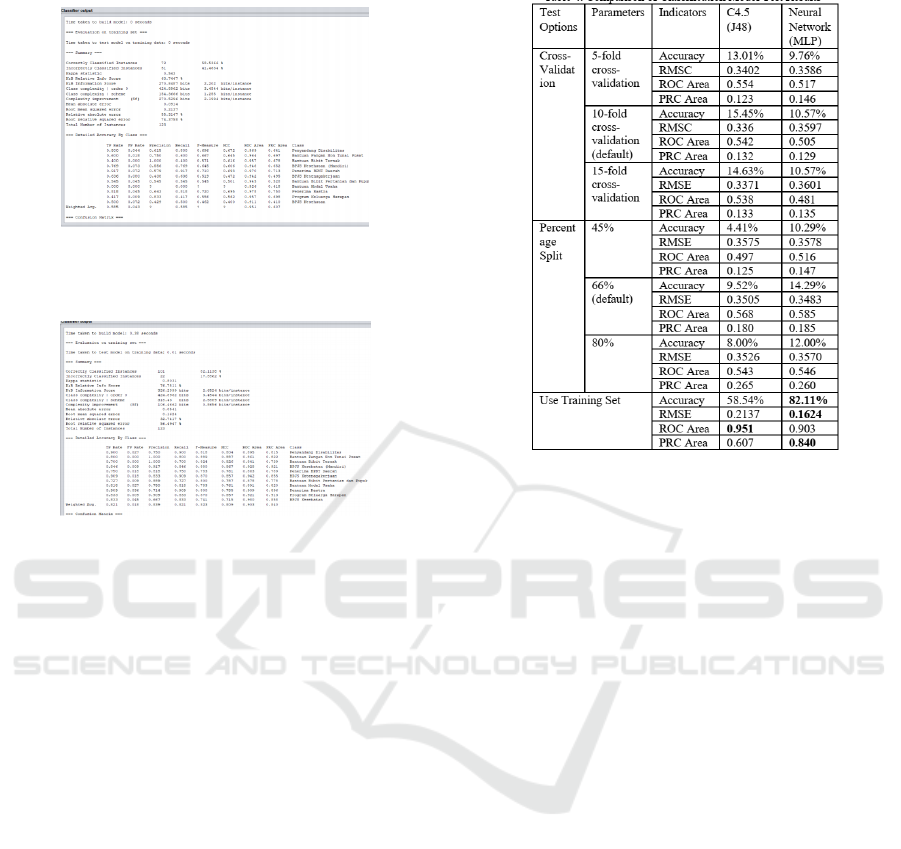
The data is then pre-processed, and 5 (five) benefi-
ciary data criteria are selected as input attributes and 1
(one) criterion as output or label class attributes (Fig-
ure 3).
Figure 3: Characteristics of Attribute Data.
3.3 Evaluation Measures
Evaluation of the classification results is done by the
Confusion Matrix method. Evaluation of the Con-
fusion Matrix produces accuracy, precision, and re-
call. Accuracy in classification is the percentage of
accuracy of data records that are correctly classified
instances after testing the classification results (Han
et al., 2011). Precision is the proportion of positive
predicted cases that are also true positive on actual
data, while Recall is the proportion of positive cases
that are positively predicted correctly (Powers, 2011).
Figure 4: Characteristics of Attribute Data.
Accuracy = (A + D)/(A + B +C + D) (3)
The performance of classification algorithms can
also be analysed through Area ROC (Receiver Op-
erating Characteristic) and PRC (Precision-Recall
Curve). The ROC curve is based on the values ob-
tained in the Confusion Matrix calculation, which is
between the False Positive Rate (FPR) and the True
Positive Rate (TPR).
FPR = C/(C + D) (4)
T PR = A/(A + B) (5)
The PRC area is created based on values obtained
from the Confusion Matrix calculation, namely Preci-
sion and Recall.
Precision = A/(A +C) (6)
Recall = A/(A + D) (7)
AUC (area under the curve) is calculated to mea-
sure the difference in the performance of the method
used. ROC has a diagnostic value (Gorunescu, 2011).
Figure 5: AUC Classification.
4 RESULT AND ANALYSIS
4.1 Data Model and Evaluation
The classification model and evaluation process car-
ried out with WEKA 3.8.3 data mining tools use
two algorithms, namely Decision Tree C4.5, which
is implemented into J48 and Neural Network, which
is implemented as Multilayer Perceptron. The pro-
cess of testing the classification results using three
test options available in WEKA tools, namely Cross-
Validation, Percentage Split, and Use Training Set.
For Cross-Validation testing techniques, the selected
test parameters are the default parameters (10 folds),
five-folds, and 15 folds to analysed whether there is
an influence of adding and subtracting the number of
folds to the accuracy value. As for the Percentage
Split Testing Technique, the chosen test parameters
are the defaults (66%), 45%, and 80% to analysed
whether there is an influence of the distribution of the
amount of training data and test data on the accuracy
value. Examples of displaying the results of classi-
fication and testing of social assistance distribution
datasets using the Decision Tree C4.5 (J48) and Neu-
ral Network (Multilayer Perceptron) algorithm with
the Use Training Set testing model are shown in Fig-
ure 6 and Figure 7.
CONRIST 2019 - International Conferences on Information System and Technology
338
space
Figure 6: WEKA Display Classification Process using De-
cision Tree C4.5 (J48) Algorithms with the Use Training
Set test option
Figure 7: WEKA Display Classification Process using Neu-
ral Network Algorithms (Multilayer Perceptron) with the
Use Training Set test option
4.2 Comparison and Analysis
Indicators of test results that will be used in the com-
parison process include accuracy (correctly classi-
fied instances), RMSE (Relative Mean Square Error),
ROC Area, and PRC Area. The four indicators were
tested with three techniques for testing CrossValida-
tion, Percentage Split, and Use Training Set. The re-
sults of the comparison can be seen in Figure 8.
space
Figure 8: Comparison of Classification Model Test Results.
Based on the results of comparison of test data
in Figure 8, it is known that the best Classification
Model chosen for use in predicting data on prospec-
tive social assistance recipients is the Classification
Model produced by the Neural Network Algorithm
which was built through the Use Training Set testing
technique, with the highest accuracy value (82.11 %),
the lowest RMSE value (0.1624), and the highest PRC
Area number (0.840), even though the highest ROC
Area value obtained is generated by the Classification
Model produced by the Decision Tree C4.5 Algorithm
(0.951). But if it is measured using AUC (the area un-
der the curve) for ROC, then the level of diagnosis
produced by the ROC Area of the two Classification
Models (Decision Tree C4.5 and Neural Network) are
both in the category of excellent classification (0.90 -
1).
As for the results of the analysis of the parame-
ter changes made on the Cross-Validation and Per-
centage Split Testing Techniques, it shows that the
addition or reduction of the number of folds on the
Cross-Validation will result in a decrease in the accu-
racy value, except for the Neural Network algorithm,
increasing the number of folds results in a fixed or
not influence the value of accuracy. As for the Per-
centage Split, the addition or reduction of the num-
ber of datasets that are divided into training data and
test data results in a decrease in the accuracy value
of the two algorithms. But the accuracy generated by
these two testing techniques, either using default pa-
rameters or the results of testing parameter changes,
results in values that are much lower than the accu-
Comparison of Data Mining Classification Algorithm Performance for Data Prediction Type of Social Assistance Distribution
339
racy values generated through the Use Training Set
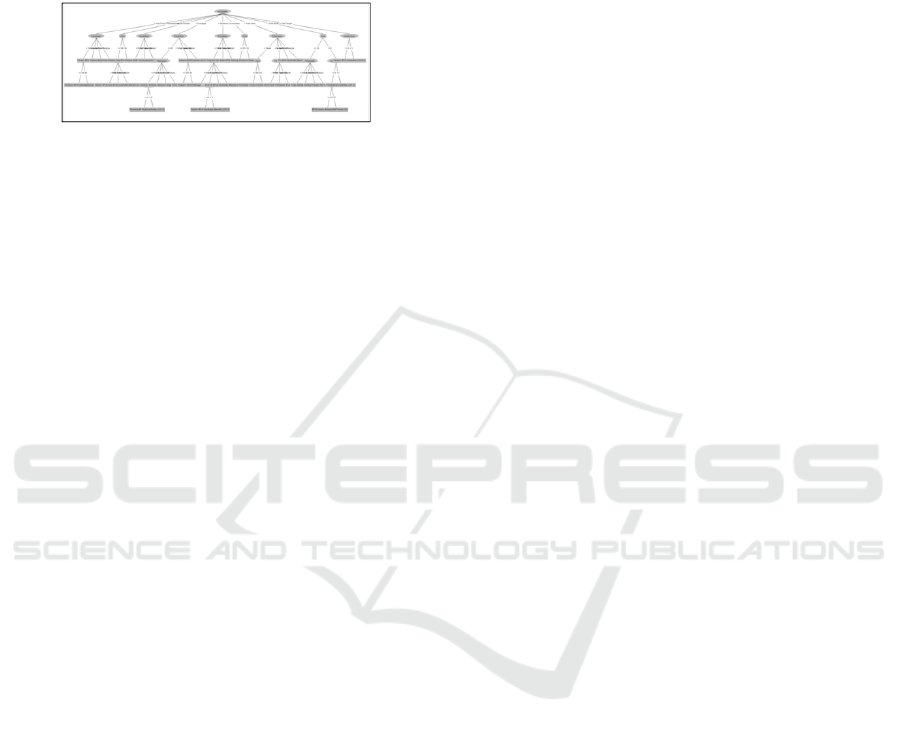
testing technique. Further analysis of the classifica-
tion results using the Decision Tree Algorithm C4.5
with the Use Training Set testing technique, can be
seen through the Tree visualization shown by Figure
9 and the formed Rule.
Figure 9: Tree Visualization
Based on the rule formed from the tree, it is known
that the attribute that becomes the root as the main
determinant in the classification process is the ”Sub-
district” attribute, then at the next second-level fol-
lowed by the attribute ”Occupation” if the beneficiary
is located in the sub-district of Kota Timur and Kota
Utara, the ”Education” attribute if the recipient is lo-
cated in the sub-district of Kota Selatan, Dungingi,
and Sipatana, the ”Age” attribute if the beneficiary is
located in the sub-district of Hulonthalangi, Dumbo-
raya & Kota Barat, and the attribute ”Number of Chil-
dren” if the beneficiary is located in sub-district of
Kota Tengah. The rules formed from the results of
the model classification using the Decision Tree C4.5
(J48) algorithm are as follows:
Kecamatan = Kota Timur
| Pekerjaaan = Petani
||Usia <= 44: Penyandang Disabilitas
(2.0/1.0)
||Usia > 44: BPJS Ketenagakerjaan
(2.0/1.0)
| Pekerjaaan=Buruh: Penerima BPNT Daerah
(3.0/1.0)
| Pekerjaaan = Assiten RT: BPJS
Kesehatan (Mandiri) (3.0/2.0)
| Pekerjaaan = Tidak Bekerja: Bantuan
Bibit Pertanian dan Pupuk (4.0/2.0)
Kecamatan = Hulonthalangi
| Usia <= 59
||Pendidikan = SD: Penerima BPNT Daerah
(5.0/2.0)
||Pendidikan = Tidak Tamat SD: BPJS
Kesehatan (Mandiri) (3.0/1.0)
||Pendidikan = Tidak Sekolah: BPJS
Kesehatan (Mandiri) (0.0)
| Usia > 59: Bantuan Pangan Non Tunai
Pusat (4.0/1.0)
Kecamatan = Kota Selatan
|Pendidikan = SD: Penerima BPNT Daerah
(5.0/3.0)
|Pendidikan = Tidak Tamat SD: Bantuan
|Pendidikan = Tidak Sekolah: Penyandang
Disabilitas (2.0/1.0)
Kecamatan = Dungingi
| Pendidikan = SD
||Pekerjaaan = Petani
|||Jumlah Anak <= 3: Penerima BPNT
Daerah (2.0/1.0)
|||Jumlah Anak > 3: Penerima Rastra
(2.0/1.0)
||Pekerjaaan = Buruh: Bantuan Pangan Non
Tunai Pusat (2.0)
||Pekerjaaan = Assiten RT: Bantuan
Pangan Non Tunai Pusat (0.0)
||Pekerjaaan = Tidak Bekerja: Bantuan
Pangan Non Tunai Pusat (0.0)
|Pendidikan = Tidak Tamat SD
||Usia <= 45: Penerima Rastra (4.0/2.0)
||Usia > 45: Program Keluarga Harapan
(2.0)
|Pendidikan = Tidak Sekolah: Bantuan
Bibit Pertanian dan Pupuk (1.0)
Kecamatan = Sipatana
| Pendidikan = SD
||Pekerjaaan = Petani: BPJS
Ketenagakerjaan (3.0/1.0)
||Pekerjaaan = Buruh
|||Jumlah Anak <= 4: Penerima BPNT
Daerah (2.0/1.0)
|||Jumlah Anak > 4: BPJS Kesehatan
(Mandiri) (2.0/1.0)
||Pekerjaaan = Assiten RT: BPJS
Kesehatan (Mandiri) (1.0)
||Pekerjaaan = Tidak Bekerja: BPJS
Kesehatan (Mandiri) (0.0)
|Pendidikan = Tidak Tamat SD: Program
Keluarga Harapan (3.0/1.0)
|Pendidikan = Tidak Sekolah: Bantuan
Bibit Ternak (1.0)
Kecamatan = Dumboraya
| Usia <= 55: BPJS Ketenagakerjaan
(11.0/7.0)
| Usia > 55: Penerima Rastra (2.0)
Kecamatan = Kota Utara
| Pekerjaaan = Petani
||Usia <= 54: Penyandang Disabilitas
(4.0/1.0)
||Usia > 54: Penerima BPNT Daerah (2.0)
| Pekerjaaan = Buruh
||Pendidikan = SD: Penyandang
Disabilitas (2.0/1.0)
||Pendidikan = Tidak Tamat SD: BPJS
Kesehatan (Mandiri) (2.0/1.0)
||Pendidikan = Tidak Sekolah: Penyandang
Disabilitas (0.0)
CONRIST 2019 - International Conferences on Information System and Technology
340
| Pekerjaaan = Assiten RT: Penerima
Rastra (1.0)
| Pekerjaaan = Tidak Bekerja: BPJS
Kesehatan (Mandiri) (3.0/2.0)
Kecamatan = Kota Barat
| Usia <= 53
|| Pekerjaaan = Petani: BPJS Kesehatan
(4.0/2.0)
|| Pekerjaaan = Buruh: Program Keluarga
Harapan (1.0)
|| Pekerjaaan = Assiten RT: Bantuan
Pangan Non Tunai Pusat (0.0)
|| Pekerjaaan = Tidak Bekerja: Bantuan
Pangan Non Tunai Pusat (2.0/1.0)
| Usia > 53
||Jumlah Anak <= 4
|||Usia <= 57: BPJS Kesehatan (Mandiri)
(4.0/1.0)
|||Usia > 57: Bantuan Bibit Ternak (3.0)
||Jumlah Anak > 4: Penyandang
Disabilitas (3.0/1.0)
Kecamatan = Kota Tengah
|Jumlah Anak <= 3: Penerima Rastra
(5.0/2.0)
|Jumlah Anak > 3: BPJS Kesehatan
(10.0/6.0)
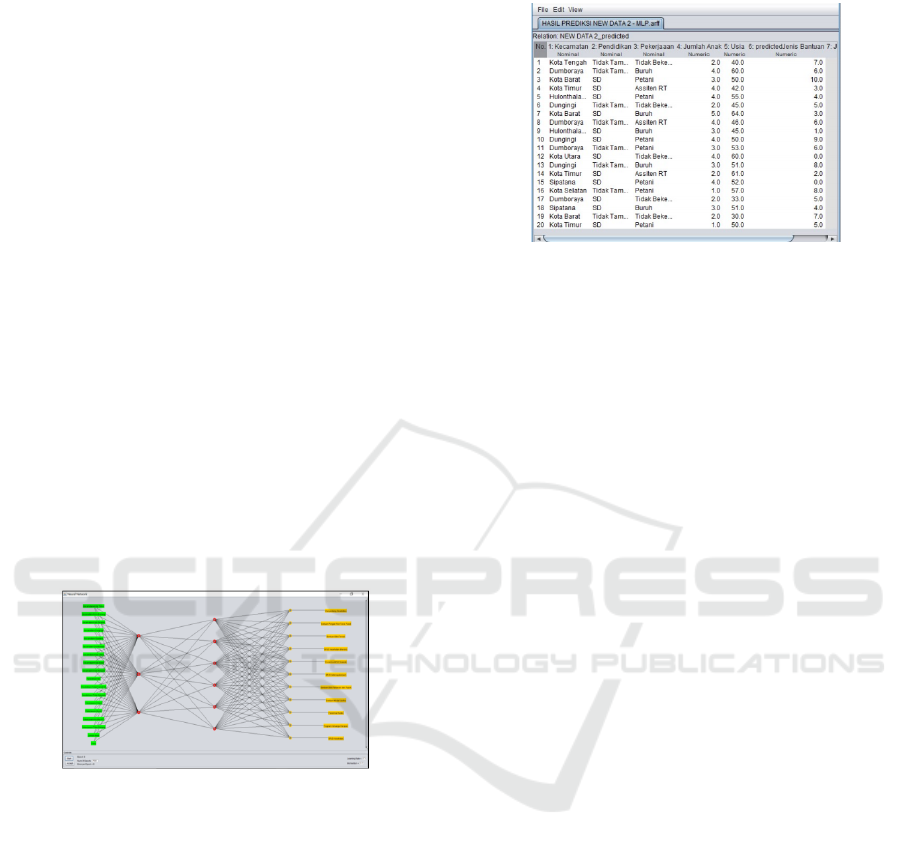
Figure 10: Neural Network Visualization
The implementation of the Neural Network algo-
rithm in the WEKA data mining tools can also be
demonstrated by the visualization output space of the
Multilayer Perceptron (Figure 10). The visualiza-
tion was obtained from the results of the construc-
tion of a classification model with a testing technique
(use training set) which produced the best accuracy
(82.11%) and had made changes to the default num-
ber of hidden layers parameters.
4.3 Prediction
The classification model with the best accuracy is then
chosen to be used in predicting new data, namely
prospective social assistance data, which in this study
were tested with 20 dataset records. The classification
results are displayed by the WEKA ARFF Viewer in
the form of numerical data, as shown in Figure 11.
space
Figure 11: Prediction Results of Prospective Social Assis-
tance Recipients
5 CONCLUSIONS
This research compares two classifier algorithms,
namely C4.5 and neural networks, to classify social
assistance distribution datasets. Based on the exper-
imental results in this research it can be concluded
that from the evaluation results it is known that the
Neural Network Algorithm with the Use Training Set
testing technique has the highest accuracy compared
to the C4.5 Algorithm. Neural Network algorithm
which can be used to classify beneficiary data based
on the Social Assistance Distribution dataset will un-
doubtedly make it easier for the government as the
policymaker to determine the type of assistance from
prospective social assistance data as an effort to opti-
mize the mechanism of social assistance distribution
by minimizing subjectivity that can be done by autho-
rized in the management of these activities.
The success rate of the research can be increased
by adding data processed in the study and taking data
from a variety of beneficiary criteria from various lo-
cations. The best algorithm in this research can be
compared with other classification methods so that the
most accurate algorithm is obtained.
Comparison of Data Mining Classification Algorithm Performance for Data Prediction Type of Social Assistance Distribution
341

REFERENCES
Abbas, A. K., Al-haideri, N. A., and Bashikh, A. A. (2019).
Implementing artificial neural networks and support
vector machines to predict lost circulation. Egyptian
Journal of Petroleum, 28(4):339–347.
Breslow, L. A. and Aha, D. W. (1997). Simplifying decision
trees: A survey. The Knowledge Engineering Review,
12(01):1–40.
Daoud, M. and Mayo, M. (2019). A survey of neu-
ral network-based cancer prediction models from mi-
croarray data. Artificial intelligence in medicine.
Gorunescu, F. (2011). Data Mining: Concepts, models and
techniques, volume 12. Springer Science & Business
Media.
Han, J., Pei, J., and Kamber, M. (2011). Data mining: con-
cepts and techniques. Elsevier.
Hssina, B., Merbouha, A., Ezzikouri, H., and Erritali, M.
(2014). A comparative study of decision tree id3 and
c4. 5. International Journal of Advanced Computer
Science and Applications, 4(2):13–19.
Korting, T. S. (2006). C4. 5 algorithm and multivariate deci-
sion trees. Image Processing Division, National Insti-
tute for Space Research–INPE Sao Jose dos Campos–
SP, Brazil.
Markopoulos, A. P., Georgiopoulos, S., and Manolakos,
D. E. (2016). On the use of back propagation and ra-
dial basis function neural networks in surface rough-
ness prediction. Journal of Industrial Engineering In-
ternational, 12(3):389–400.
McClelland, J. L., Rumelhart, D. E., Group, P. R., et al.
(1986). Parallel distributed processing. Explorations
in the Microstructure of Cognition, 2:216–271.
McCulloch, W. S. and Pitts, W. (1943). A logical calculus
of the ideas immanent in nervous activity. The bulletin
of mathematical biophysics, 5(4):115–133.
Powers, D. M. (2011). Evaluation: from precision, recall
and f-measure to roc, informedness, markedness and
correlation.
Pradeep, K. and Naveen, N. (2018). Lung cancer surviv-
ability prediction based on performance using classi-
fication techniques of support vector machines, c4. 5
and naive bayes algorithms for healthcare analytics.
Procedia computer science, 132:412–420.
Sudarma, M. and Harsemadi, I. G. (2017). Design and anal-
ysis system of knn and id3 algorithm for music clas-
sification based on mood feature extraction. Interna-
tional Journal of Electrical and Computer Engineer-
ing, 7(1):486.
Sudarma, M. and Surya, I. W. A. (2014). The identification
of balinese scripts’ characters based on semantic fea-
ture and k nearest neighbor. International Journal of
Computer Applications, 91(1).
Wang, X., Zhou, C., and Xu, X. (2019). Application of c4.
5 decision tree for scholarship evaluations. Procedia
Computer Science, 151:179–184.
CONRIST 2019 - International Conferences on Information System and Technology
342
