
K-Means Clustering Optimization using the Elbow Method and Early
Centroid Determination Based-on Mean and Median
Edy Umargono
1
, Jadmiko Endro Suseno
2
and Vincensius Gunawan S. K.
2
1
Departement of Information System, Post Graduated School Diponegoro University, Jl. Imam Barjo, Semarang, Indonesia
2
Departement of Physics, Faculty of Science and Mathematics, Diponegoro University, Semarang, Indonesia
Keywords:
K-Means clustering, The Elbow Method, mean formula, median formula, centroid optimization.
Abstract:
The most widely used algorithm in the cluster partitioning method is the K-Means algorithm. Historically K-
Means is still the best grouping algorithm among other grouping algorithms with the ability to group a number
of data with relatively fast and efficient computing time. The KMeans algorithm is widely implemented in
various fields in industrial and scientific applications and is very suitable for processing quantitative data with
numeric attributes but there are still weaknesses in this algorithm. Weaknesses of the K-Means algorithm
include determining the number of clusters based on assumptions and relying heavily on initial selection of
centroids to overcome this weakness, in this study, we propose the use of the elbow method to determine the
best number of clusters and determination of centroid based-on mean and median data. The results of this study
indicate that using initial centroid determination based on mean data makes the number of iterations needed to
achieve uniformity in clusters 22.58% less than using initial random cluster determination and determining the
best number of clusters using the elbow method makes the required iteration 25% less than using the number
of other clusters.
1 INTRODUCTION
Clustering is a process of grouping a set of data in a
dataset by dividing data into groups or clusters with
the principle of maximizing the high similarity in in-
traclass and minimizing the similarity in interclass
so that objects in one cluster have high similarity
but are very different from objects in other clusters
(Han et al., 2011) . Attribute values that describe
objects are used to assess dissimilarity and similar-
ity and usually involve distance measurements (Li
and Wu, 2012). The cluster method can generally be
classified as a partition method with mean or medoid
values that represent the cluster centroid values with
one level of grouping, hierarchical method with sev-
eral levels of grouping, density-based method, grid-
based method to handle spatial data. Judging from the
characteristics, ease of implementation and computa-
tional performance for grouping small and medium
data partition method with the average (mean) is the
most effective and efficient (Wilks, 2011) .The data
to be grouped in this study are relatively small and of
medium-size so the partitionbased clustering method
using the mean is the most suitable method used in
this study.
The most widely used algorithm in the partition
method is the K-Means algorithm, K-Means is an it-
eration algorithm where the user determines the num-
ber of clusters to be used in grouping datasets and
determining the centroid for each cluster (Simovici
and Djeraba, 2014) so that the level the similarity
between members in one cluster is high whereas the
level of similarity with members in other clusters is
very low (Shakeel et al., 2018). Historically K-Means
is still the best clustering algorithm among other clus-
tering algorithms with the ability to group a number
of data with relatively fast and efficient computing
time (L
´
opez-Rubio et al., 2018), (Bholowalia and Ku-
mar, 2014), (Kodinariya and Makwana, 2013)) and
become one of the most important algorithms in data
mining. KMeans algorithm is widely implemented in
various fields in industrial and scientific applications
(Shakeel et al., 2018) and is very suitable for process-
ing quantitative data with numerical attributes, how-
ever there are still weaknesses in this algorithm.
The weaknesses of the K-Means algorithm in-
clude the determination of the number of clusters
based on assumptions and relying heavily on the ini-
tial selection of cluster center (centroid) to overcome
these weaknesses, it is necessary to optimize, one of
234
Umargono, E., Suseno, J. and S. K., V.
K-Means Clustering Optimization using the Elbow Method and Early Centroid Determination Based-on Mean and Median.
DOI: 10.5220/0009908402340240
In Proceedings of the International Conferences on Information System and Technology (CONRIST 2019), pages 234-240
ISBN: 978-989-758-453-4
Copyright
c
2020 by SCITEPRESS – Science and Technology Publications, Lda. All rights reserved

the popular cluster optimization methods is the El-
bow method (L
´
opez-Rubio et al., 2018) (Bholowalia
and Kumar, 2014), (Kodinariya and Makwana, 2013)
, (Liu et al., 2018). The Elbow method is a visual
method to test the consistency of the best number of
clusters by comparing the difference of the sum of
square error (SSE) of each cluster, the most extreme
difference forming the angle of the elbow shows the
best cluster number. In some of these studies, the fo-
cus is still on optimizing the determination of the best
number of clusters by the Elbow method while the
initial selection of centroid is still random. This al-
lows the number of iterations to place objects in the
cluster based on the center of the new cluster to be
more numerous so that the achievement of similarity
of patterns formed becomes longer.
Much research has been done related to determin-
ing the centroid value to improve the performance of
the K-Means algorithm including the idea of weight-
ing on each cluster variant as min-max K-Means
(Tzortzis and Likas, 2014), there are also studies with
a simple formula through weighting the highest and
lowest averages to be used as a centroid value (Fab-
regas et al., 2017) with better computational perfor-
mance results than the original K-Means, in this study
proposes the use of simple statistical mean and me-
dian formulas in initial determination of the centroid
and combined with the method Elbow to determine
the number of clusters used so that the performance
of the K-Means algorithm is better in terms of the
number of iterations needed and the consistency of
the generated cluster members compared to the origi-
nal K-Means method.
The K-means clustering algorithm in this research
will be implemented in the case study of mapping
data of teaching staff in public schools in districts,
cities in province of Central Java, with this grouping it
can be seen which schools have excess teaching staff
or lack of teaching staff so that they can be used as
a basis for distribution teaching staff as an effort to
equalize teaching staff placement in public schools in
Central Java so that there are no problems with ex-
cess or lack of teaching staff, excessive concentration
of teaching staff in certain areas, and aging teaching
staff population in placement in major city centers be-
cause of the distribution of teaching staff which is un-
even (Szelkagowska-Rudzka, 2018). In this study, it
is assumed that three main groups are formed that rep-
resent deficiency, sufficient and excess conditions, to
improve the performance of the KMeans algorithm in
this study using the elbow method to evaluate the de-
termination of the best number of clusters and com-
bined with determining the initial centroid by compar-
ing the minimum value, the median value , the mean
value and maximum object values of the results of
the comparison of this experiment are used as a de-
terminant of the initial centroid, so it is expected to
reduce the number of iterations to achieve similarity
in the formed cluster rather than using the initial ran-
dom centroid determination.
2 MATERIALS AND METHODS
2.1 Materials
The data used in this study is a sample recapitulation
of Public high school data in Central Java Province
covering 16 of Public Senior High School data in Se-
marang City, 11 of Public Senior High School data
in Semarang Regency and 3 of Public Senior High
School data in Salatiga City and its attributes in-
cluding the name of the school, number of students
(ns), number of teachers (nt), number of study groups
(nsg), number of subjects (nsbc), data obtained from
http: //sekolah.data.kemdikbud.go.id and the Office
of Education and Culture of the Central Java Provin-
cial Government, the data is downloaded in the form
of CSV file.
The tools used in this study are a set of computers
with AMD Dual Core A9-9420 3.6 GHz CPU hard-
ware specifications, 4GB RAM with Windows 10 op-
erating system, Excel applications, Orange Data Min-
ing, Python programming and Visual Studio Code ed-
itors as supporting software
2.2 Methods
In this study conducted using the following stages, the
first stage is problem analysis at this stage a problem
analysis is carried out in the case study of equal dis-
tribution of teaching staff, especially in public schools
in districts, cities in Central Java, which results in the
formulation of the problem needed by mapping the
teaching staff in public schools.
The second stage is literature review, at this stage
a literature study method is conducted which will be
used to clustering data on existing case studies, the re-
sult of this stage is the use of the K-Means clustering
method for grouping data that enables improved per-
formance by determining the best number of clusters
and determining the initial centroid.
The third stage is data collection, the data used
are secondary data obtained from the website of
the Ministry of Education and Culture of the Re-
public of Indonesia at the address http: //seko-
lah.data.kemdikbud.go.id and other data from the
Office of Education and Culture of Central Java
K-Means Clustering Optimization using the Elbow Method and Early Centroid Determination Based-on Mean and Median
235
Province. Data attribute relationships are determined
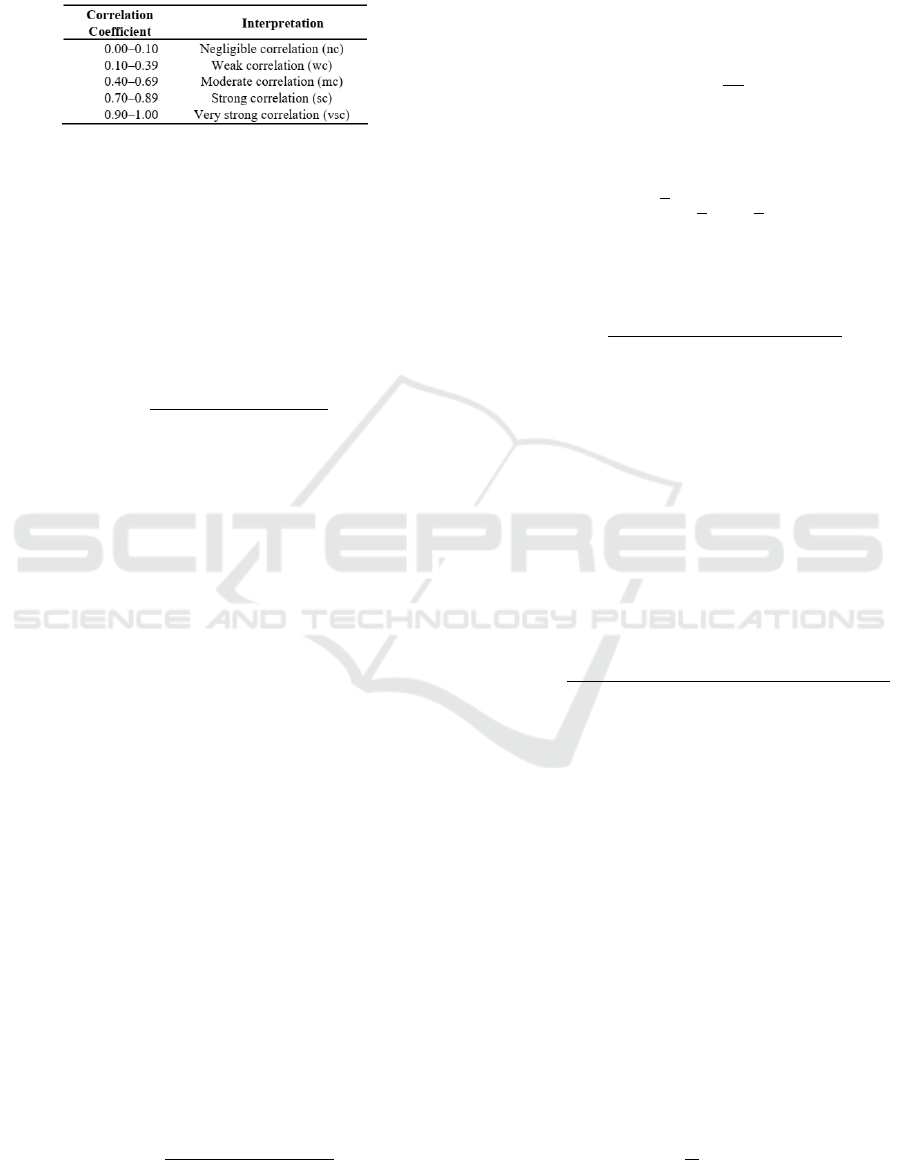
with the Pearson Correlation Coefficient are shown in
the Figure 1
Figure 1: Pearson Correlation Coefficient (Schober et al.,
2018).
The fourth stage is data preparation, at this stage,
data cleaning is done from inconsistent data, incom-
plete data and then integrating data from different
sources, to eliminate attribute dominance, normaliza-
tion using the min-max method which places data in
the range of 0 as a minimum value up to 1 as a max-
imum value. With the following formula (Jain et al.,
2018).
X∗ =
x − minValue
maxValue − minValue
(1)
with x is the value to be normalized.
The fifth stage is modeling, at this stage using the
K-Means algorithm to group data into a number of
groups that have been determined. K-Means Cluster-
ing is a prototype based clustering method where the
dataset is divided into a number of (k) - clusters, in
this method the user determines the number of clus-
ters (k) to be used. The purpose of KMeans Cluster-
ing is to find a prototype for each cluster, all data ob-
jects are then assigned to the nearest prototype, which
then forms a cluster. The prototype is called centroid,
the center of the cluster. Centroid is the average of
all data objects in a cluster or the most representative
data object. K-Means clustering creates partitions (k)
in n-dimensional space, where n is the number of at-
tributes in the dataset. To partition data, proximity
measurements must be determined. The most com-
monly used measure for numerical attributes is the
Euclidean distance. Following are the stages of the
K-Means Clustering process (Simovici and Djeraba,
2014)
1. Determining the number of clusters by the user
2. Centroid initialization
The first step in the k-means algorithm after deter-
mining the number of clusters is to start randomly
determining centroids. In this study it is proposed
to use the mean formula as a description of the av-
erage value of the cluster members shown in for-
mula (Sarkar and Rashid, 2016)
µ
i
=
x
1
+ x
2
+ x
3
+ ... + x
j
j
(2)
with xj is object value in cluster and j number of
objects in cluster, and the formula for the single
data median as follows (Sarkar and Rashid, 2016),
if the data is odd and n is the amount of data then
the medians formula becomes
ME = X
n+1
2
(3)
If the amount of data is even then the median for-
mula becomes
ME =
1
2
(x
(
n
2
)
+ x
(
n
2
+1)
) (4)
Median data by dividing the smallest and largest
addition values by formula
X∗ =
smallestvalue − largestvalue
2
(5)
3. Data allocation
Every data or object will be located to the clos-
est cluster. The distance between the two ob-
jects determines the proximity of the object. Dis-
tance measurement with Euclidean distance is
the most commonly used proximity measure, al-
though other measurements such as Manhattan
size and Jaccard coefficient can be used. The Eu-
clidean distance (d) between two data points x
(x1, x2, ... xn) and c (c1, c2, ..., cn) with n at-
tributes is described in the Euclidean Distance for-
mula as follows (Draisma et al., 2016)
d =
q
(x1 − c1)2 + (x 2 − c2)
2
+ .. + (xn − cn)
2
(6)
with d is the distance of points x and c, xn is the
criterion data and cn is the centroid of the nth clus-
ter.
4. Calculate the new centroid
For each cluster, after the first iteration data al-
location stage is completed then a new centroid
is calculated for the next iteration data allocation.
This new centroid is the most representative data
point of all data points in the cluster obtained from
the cluster average. Mathematically, this step can
be expressed as minimizing the sum squared er-
rors (SSE) from all data points in a cluster to the
centroid cluster. The overall goal of this step is
to minimize the SSE of each group. Here is the
new centroid determination formula(Sarkar and
Rashid, 2016)
µ
i
=
1
ji
Σ
x∈C
i
X (7)
CONRIST 2019 - International Conferences on Information System and Technology
236
with µ
i
is center point (centroid), X is object in the
cluster, ji the number of objects in the cluster.
5. Termination
The step of calculating a new centroid, and the
step to assign data points to the new centroid are
repeated until no more changes in the assignment
of data points occur. In other words, no significant
changes in centroids were noted. The final cen-
troid is declared as a prototype cluster and is used
to describe the whole grouping model. The stages
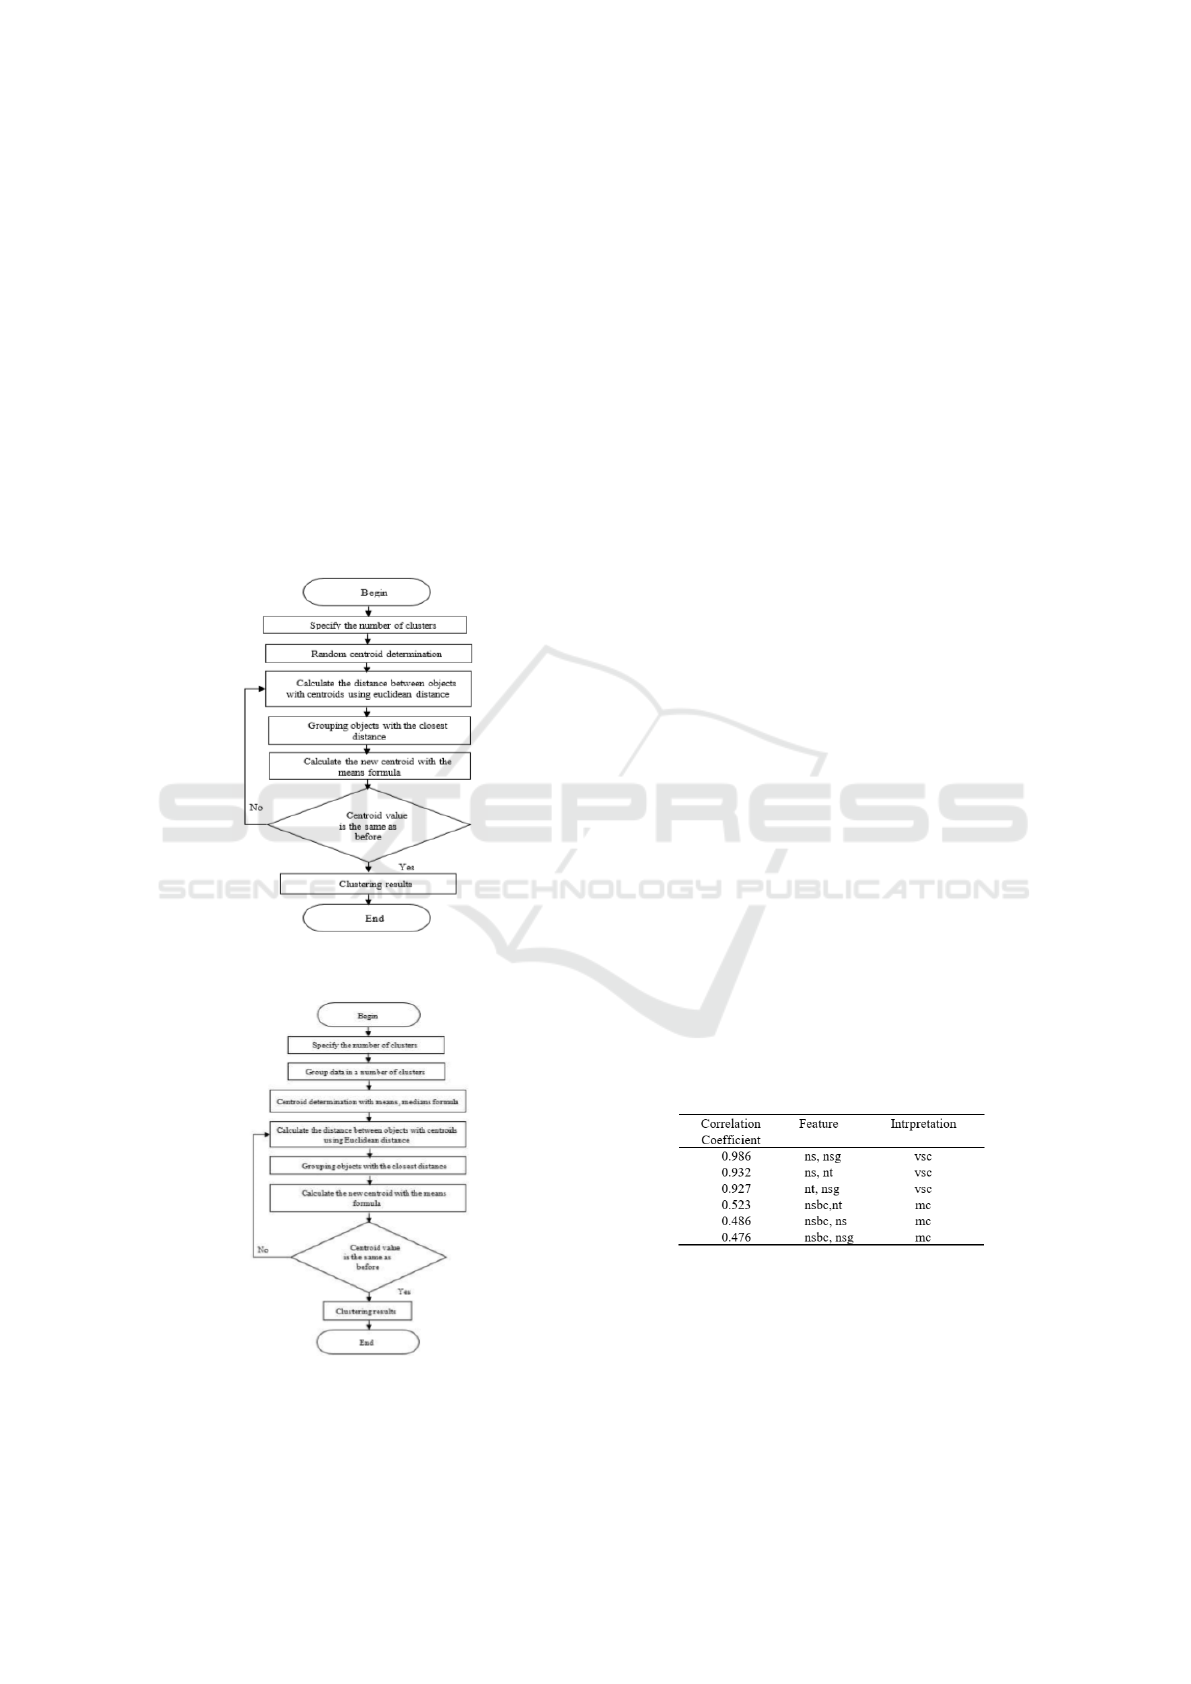
of the original K-Means algorithm are illustrated
in Figure 2and the proposed K-Means algorithm
by determining the initial centroid of the cluster
using the median formula and the mean formula
illustrated in Figure 3
Figure 2: Original K-Means algorithm
Figure 3: Proposed K-Means algorithm optimization
The sixth stage is Evaluation, evaluate the results
of the cluster using the Elbow method, this method
is a visual method to test the consistency of the best
number of clusters. The idea is to determine the num-
ber of clusters then add clusters, calculate the sum
squared error (SSE) per cluster until the maximum
number of clusters that have been determined, then
by comparing the difference SSE of each cluster, the
most extreme difference forming the angle of the el-
bow shows the best cluster number.(Bholowalia and
Kumar, 2014) (Madhulatha, 2012), here is the SSE
formula
SSE = Σ
k
i=1
Σ
x j∈C
i
||x
j
− µ
i
||
2
(8)
with xj is object in the cluster ci and centroid of the
cluster
The Elbow method algorithm in determining the
value of k in K-Means is as follows:
1. Initialization k = 1
2. Starting
3. Increment k value
4. Calculate SSE Y
5. Observe the value of SSE which drops dramati-
cally
6. The value of k at the SSE of a drastic decrease is
the optimal k value
7. End.
3 RESULTS AND DISCUSSION
In this study, the data preparation stage is performed
feature correlation analysis using Pearson Correlation
on data mining tools with the final result using four
features with interpretation using the Pearson Corre-
lation coefficient table (Schober et al., 2018), a com-
parison of correlations between features is presented
in Figure 4
Figure 4: Pearson Correlation Coefficient result.
Base on Figure 4 it can be seen that features of the
number of students with the number of study groups,
the number of students to the number of teachers, the
number of teachers with the number of study groups
has a very strong correlation and the others has a mod-
erate correlation, then to eliminate the dominance of
attributes so the data is normalized using the min-max
K-Means Clustering Optimization using the Elbow Method and Early Centroid Determination Based-on Mean and Median
237
normalization method with the following results in
Figure 5
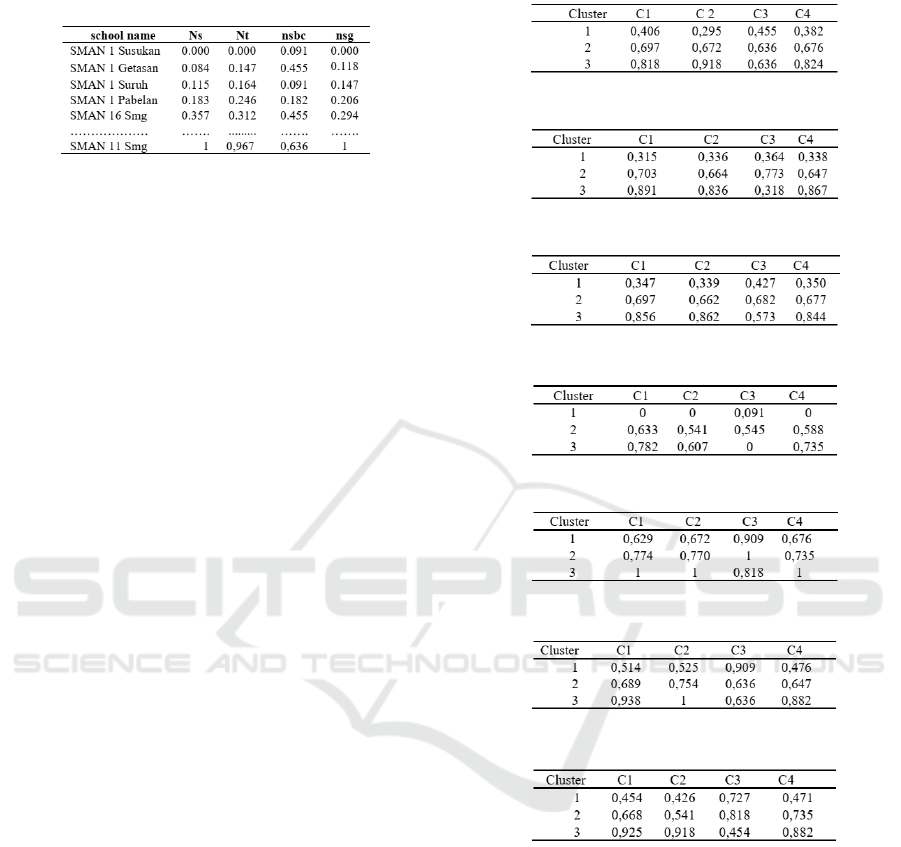
Figure 5: Sample of data normalization results.
Before the clustering process is carried out with
the K-Means algorithm the data is divided into a num-
ber of (k) clusters and the data is sorted from the
smallest to the largest value, this is done so that the
median and average group data can be calculated. The
results of the K-means clustering algorithm are very
dependent on the initial determination of the number
of clusters to be formed and the selection of the ini-
tial centroids on grouping objects in the cluster, re-
lated to these problems in this study conducted exper-
iments using the mean statistical formula, and the me-
dian formula to determine initial centroids compared
to random initial centroid determination to test the
effect of initial determination of centroids in the K-
Means algorithm on the number of iterations needed
to reach the data uniformity in the cluster formed. In
the KMeans algorithm, the initial determination of the
centroid is done by randomly selecting an object as-
suming each data object has a level of similarity to be
chosen as the initial centroid. In this research, the re-
sults of three clusters that represent the excess teach-
ing staff, the adequacy of the teaching staff and the
lack of teaching staff are needed then a random value
is used that refers to the initial, middle and end val-
ues to represent the distribution of existing data ob-
jects. The median formula is used in this experiment
as a representation of the mean value of the data in
the group assuming that the middle value is a coun-
terbalance to the minimum and maximum values that
exist in the data group, also conducted an experiment
with the average formula (mean) with the assumption
of representing all the values of objects in the group
because the mean formula divides all the values of
data objects in the group with the amount of data in
the group. The initial centroid value is taken from the
number of students as centroid 1, the number of teach-
ers as centroid 2, the number of subjects as centroid 3
and the number of study groups as centroid 4, here is
the centroid table of all clusters
space
Figure 6: Early centroid based-on median value.
Figure 7: Early centroid based-on median 2 value.
Figure 8: Early centroid based-on mean value.
Figure 9: Early centroid based-on minimum value.
Figure 10: Early centroid based-on maximum value.
Figure 11: Early centroid based-on random 1 value.
Figure 12: Early centroid based-on random 2 value.
Determination of the number of clusters that are
formed greatly affects the results of grouping data us-
ing K-Means clustering because this is the earliest
stage of this algorithm, if incorrectly determining the
number of clusters used will cause the number of iter-
ations needed to be more and allows there are empty
clusters that do not have members. In this study the
evaluation of determining the best number of clusters
to be used in clustering uses the Elbow method which
in principle observes the most drastic decrease in SSE
that forms the angle of the elbow, the evaluation re-
sults of determining the best cluster number in this
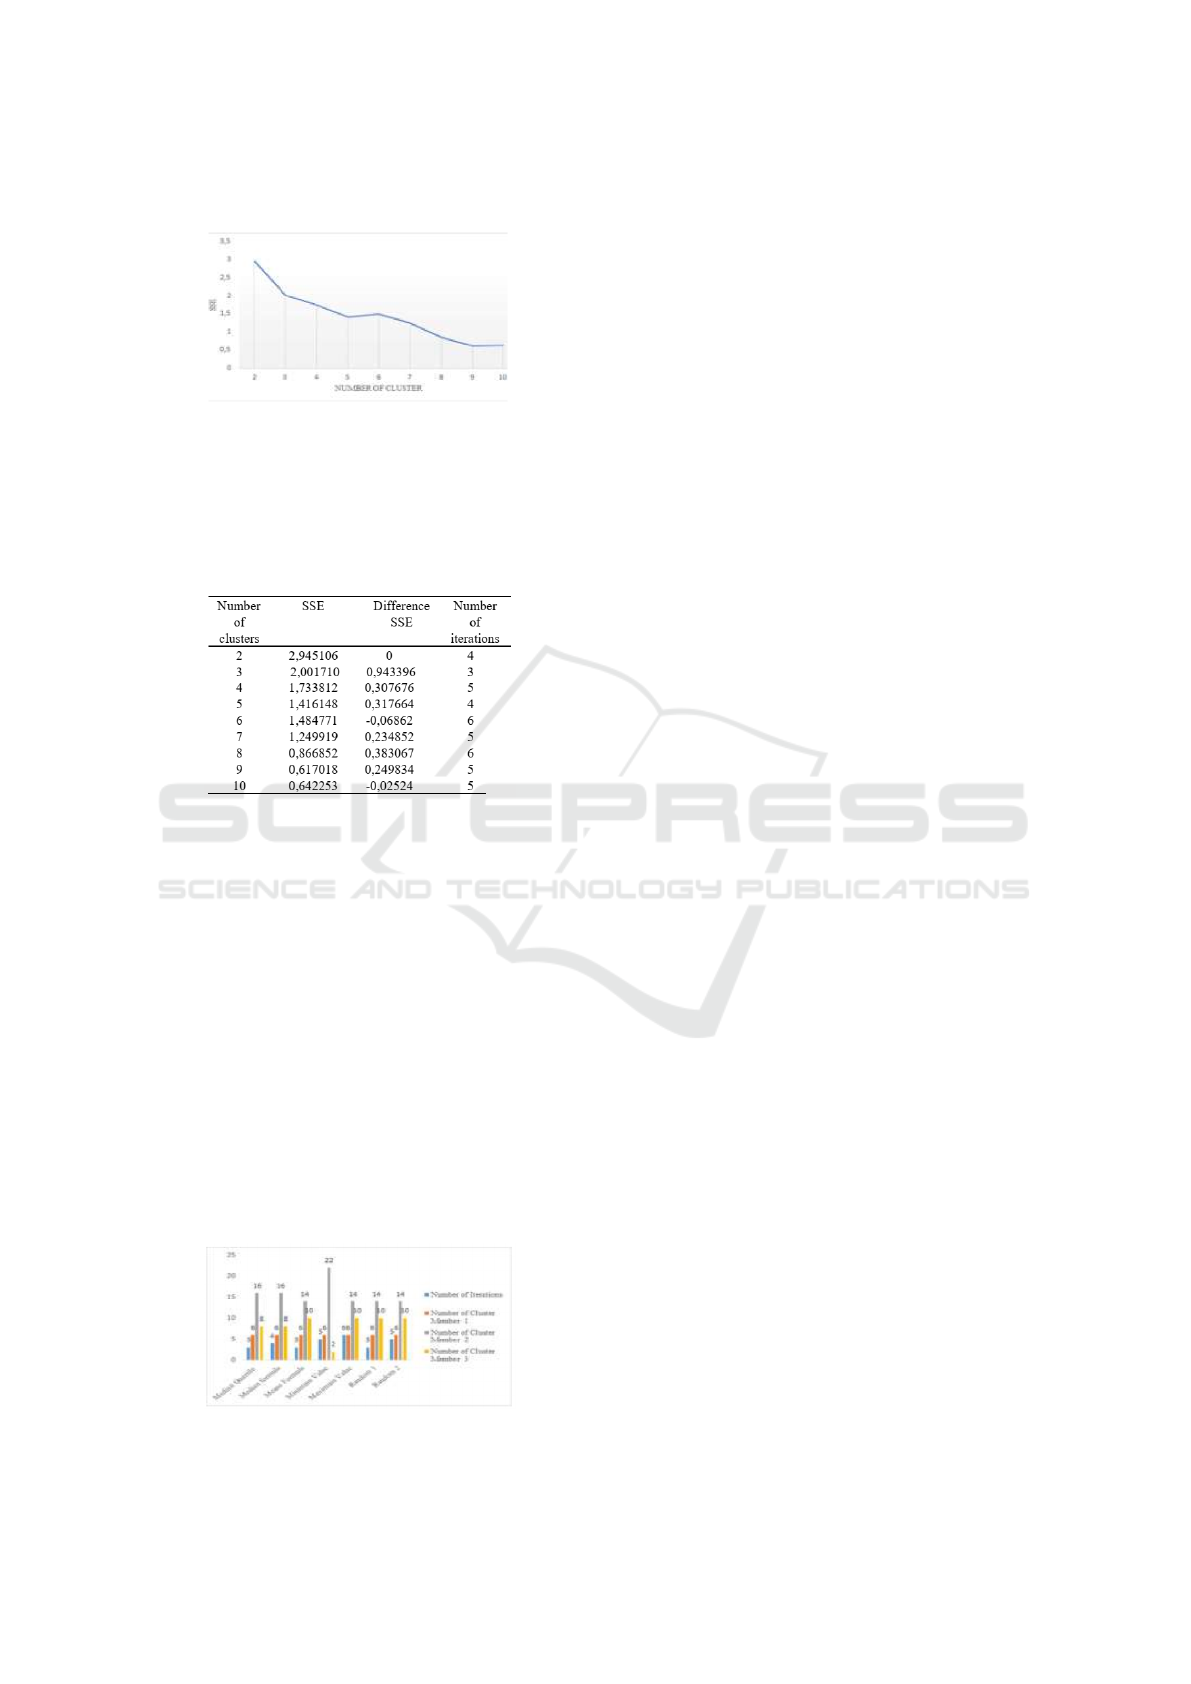
study are presented in Figure 13
CONRIST 2019 - International Conferences on Information System and Technology
238
space
Figure 13: Determination of the best cluster using the El-
bow method.
Graph in Figure 13 is arranged based on the sum-
mary results of the SSE total calculation experiment
from each number of clusters in the range of exper-
iments starting from 2 to 10 clusters which are pre-
sented in Table 11
Figure 14: Comparison table of the number of clusters with
SSE and the number of iterations needed.
Based on the Figure 13it can be observed that
the most drastic decrease in SSE refers to the num-
ber of clusters 3 with SSE difference at 2 data points
0.943396 then the SSE gradually decreases without a
drastic surge towards the lowest point forming an an-
gular angle between clusters 2, 3 and 5 so that from
observation in the graph forming a right angle, the
number of clusters 3 is the best number of clusters
to use. This is reinforced by the number of iterations
needed to achieve the convergence of cluster members
formed referring to the number of 3 clusters with 3 it-
erations needed or 25% less iteration than the number
of iterations needed if using another cluster.
Statistics on the results of the K-Means clustering
process with various experiments conducted are pre-
sented in the form of bar charts in Figure 15
Figure 15: Results of K-Means clustering with various cen-
troid value experiments.
Based on the Figure 15 The results of clustering
using the K-Means algorithm with initial determina-
tion of centroid values using various formulas can be
explained as follows, clustering KMeans using initial
centroid values based on the median formula (5) re-
quires 3 iterations with 6 members of cluster 1, 16
members of cluster 2 and 8 cluster members 3 while
the median-based centroid value based on formula (6)
requires the same iteration as the initial centroid based
on formula average (3) but has a difference in the
number of cluster members in clusters 2 and 3. The
cluster member results use a minimum based value
centroid is very much different in the number of clus-
ter members 2 and 3 compared to the results of the
cluster using other centroid values. Clustering uses
centroid values based on maximum values, random 1
value, random 2 value produces the same number of
members, namely 6 members in cluster 1, 14 mem-
bers in cluster 2, 10 members in cluster 3, but requires
a different number of iterations, centroid values based
on maximum values is the one that requires the most
iteration, as many as 6 iterations.
Based on the explanation of the experimental re-
sults that using the mean value requires a number of
iterations of 3 iterations or 22.58% lower than the av-
erage iteration using a random value that requires a
number of iterations of 4.75 iterations and the num-
ber of cluster members produced is more stable than
median and random values.
4 CONCLUSIONS
Based on the results of the clustering data experiment
using the K-Means algorithm with optimization of the
determination of the best number of clusters using
the Elbow method in terms of the iteration needed to
achieve the convergence of the members of the clus-
ter results 25% less than using the number of other
clusters and the determination of the initial centroid
using a mean formula is more consistent in producing
convergence of the number of members in the clus-
ter as well as the most efficient number of iterations
with 22.58% less than the iteration needed if using a
random initial centroid determination.
K-Means Clustering Optimization using the Elbow Method and Early Centroid Determination Based-on Mean and Median
239

REFERENCES
Bholowalia, P. and Kumar, A. (2014). Ebk-means: A clus-
tering technique based on elbow method and k-means
in wsn. International Journal of Computer Applica-
tions, 105(9).
Draisma, J., Horobet¸, E., Ottaviani, G., Sturmfels, B., and
Thomas, R. R. (2016). The euclidean distance degree
of an algebraic variety. Foundations of computational
mathematics, 16(1):99–149.
Fabregas, A. C., Gerardo, B. D., and Tanguilig III, B. T.
(2017). Enhanced initial centroids for k-means algo-
rithm. International Journal of Information Technol-
ogy and Computer Science, 1:26–33.
Han, J., Pei, J., and Kamber, M. (2011). Data mining: con-
cepts and techniques. Elsevier.
Jain, S., Shukla, S., and Wadhvani, R. (2018). Dynamic
selection of normalization techniques using data com-
plexity measures. Expert Systems with Applications,
106:252–262.
Kodinariya, T. M. and Makwana, P. R. (2013). Review on
determining number of cluster in k-means clustering.
International Journal, 1(6):90–95.
Li, Y. and Wu, H. (2012). A clustering method based on
k-means algorithm. Physics Procedia, 25:1104–1109.
Liu, L., Peng, Z., Wu, H., Jiao, H., Yu, Y., and Zhao, J.
(2018). Fast identification of urban sprawl based on
k-means clustering with population density and local
spatial entropy. Sustainability, 10(8):2683.
L
´
opez-Rubio, E., Palomo, E. J., and Ortega-Zamorano, F.
(2018). Unsupervised learning by cluster quality opti-
mization. Information Sciences, 436:31–55.
Madhulatha, T. S. (2012). An overview on clustering meth-
ods. arXiv preprint arXiv:1205.1117.
Sarkar, J. and Rashid, M. (2016). Visualizing mean, me-
dian, mean deviation, and standard deviation of a set
of numbers. The American Statistician, 70(3):304–
312.
Schober, P., Boer, C., and Schwarte, L. A. (2018). Corre-
lation coefficients: appropriate use and interpretation.
Anesthesia & Analgesia, 126(5):1763–1768.
Shakeel, P. M., Baskar, S., Dhulipala, V. S., and Jaber,
M. M. (2018). Cloud based framework for diagnosis
of diabetes mellitus using k-means clustering. Health
information science and systems, 6(1):16.
Simovici, D. A. and Djeraba, C. (2014). Clustering. In
Mathematical Tools for Data Mining, pages 767–817.
Springer.
Szelkagowska-Rudzka, K. (2018). Human resources man-
agement in higher education institutions in poland.
Management, 22(1):208–225.
Tzortzis, G. and Likas, A. (2014). The minmax k-
means clustering algorithm. Pattern Recognition,
47(7):2505–2516.
Wilks, D. S. (2011). Cluster analysis.
CONRIST 2019 - International Conferences on Information System and Technology
240
