
Designing Academic Information System Performance Measurement
using Performance Prism and ISO/IEC 25010
Liulliyah
1
and Apol Pribadi Subriadi
1
1
Department of Information System, Institut Teknologi Sepuluh Nopember, Surabaya 60111, Indonesia
Keywords:
Academic Information System, Performance Measurement, System Quality, Performance Prism, ISO/IEC
25010
Abstract:
Higher education institutions currently have invested heavily in Information Technology (IT). Information
systems supported by IT can improve service quality and add value to tertiary institutions. Academic services
are the main business processes in higher education. An effective Academic Information System (AIS) can
support an effective academic service system. To find out and assess the extent to which the performance of
AISs in carrying out its objectives and optimizing IT investment needs to be evaluated system performance.
This performance evaluation is done by measuring system performance so that it can make improvements to
the quality of the system. Measurement of information system performance is carried out on the quality of the
system it self. Performance measurement also involves all stakeholders. The objective of this study is to design
performance measurements of AISs. The results of this study are a design of AIS performance measurement
using the performance prism method in terms of stakeholders and ISO/IEC 25010 in terms of system quality.
1 INTRODUCTION
In the world of education, where the core of the
business process is academic activities, the informa-
tion system service is essential to support transac-
tional activities, such as facilitating course registra-
tion, recording student achievements, etc. (LPTSI,
2016). Transactional activities, as mentioned previ-
ously, have been accommodated in an Academic In-
formation System (AIS). An AIS is a system that
provides information services related to academic
data(Setiyawan et al., 2013). (Sprague Jr and Carlson,
1982) States that AISs are more a series of systems
and activities in an organization that uses information
as its source to regulate and process. This system pro-
vides output in the form of information to leaders or
decision-makers with different uses and goals (Levin
and Kirkpatrick, 1971).
Poltekkes Kemenkes Surabaya has built an AIS
starting in 2011. This system was built to facilitate
the academic section in processing academic data and
conducting academic services. For students, AISs can
make it easier to obtain information about academics.
In its development, the AIS has changed from time to
time following the user’s wishes. After experiencing
many changes, there are still some problems such as
some menus still have errors, or there are still menus
that are not yet as requested. Given these problems
need to be evaluated system performance.
Performance evaluation is carried out to assess the
extent to which information system performance in-
creases effectiveness and efficiency in achieving the
institutional strategic goals so that steps can be taken
to improve or innovate the latest technology and help
maximize investment in Information Technology (IT)
(Al Agani et al., 2018). The main objective of the in-
formation system evaluation function is the improve-
ment in quality (Lagsten, 2011).
The Poltekkes Kemenkes Surabaya has evaluated
the system, but it is still manual so that AIS’s per-
formance no exact value is obtained. System eval-
uation is needed in the form of AIS performance
measurement. Information systems need to be mea-
sured in terms of product quality and service qual-
ity, especially in the ”capability” function of the in-
formation system itself (Govindaraju, ). Also, the
views of stakeholders about the ability of information
system functions can affect the willingness of these
stakeholders to propose IT innovation (Zhu, 2004)
(Ravichandran et al., 2005).
The purpose of this study is to design a perfor-
mance measurement system for academic information
using the Performance Prism method from the stake-
holder side and ISO/IEC 25010 in terms of system
Liulliyah, . and Subriadi, A.
Designing Academic Information System Performance Measurement using Performance Prism and ISO/IEC 25010.
DOI: 10.5220/0009908102110218
In Proceedings of the International Conferences on Information System and Technology (CONRIST 2019), pages 211-218
ISBN: 978-989-758-453-4
Copyright
c
2020 by SCITEPRESS – Science and Technology Publications, Lda. All rights reserved
211
quality.
2 LITERATURE REVIEW
Performance Prism is a performance measurement
model developed by (Neely et al., 2002) and is
stakeholder-oriented. Performance Prism has impor-
tant and special features (Neely et al., 2001). Per-
formance prism has five aspects, the top and bottom
are stakeholder satisfaction and stakeholder contribu-
tions. Whereas the next three sides are strategy, pro-
cess, and capability (Neely et al., 2001). The objec-
tive of this research is to design performance mea-
surements of AISs.
Performance Prism has several advantages in mea-
suring performance including identifying stakehold-
ers from many interested parties, such as owners and
investors, suppliers, customers, workers, government
and surrounding communities. ISO/IEC 25010 is
an international standard in software testing. The
ISO/IEC 25010 standard was developed to replace
ISO 9126 based on the development of Information
and Communication Technology (ICT) (BS ISO/IEC
25010:2011, 2011). The ISO 9126-1 method can be
used and adopted for testing various software quali-
ties but needs to adjust to the conditions of the soft-
ware to be tested .
Using Performance Prism in higher institutions is
very good (Smulowitz, 2015) because higher institu-
tions have different system characteristics. Perfor-
mance prism can evaluate all the ’wants and needs’
of stakeholders who might be ignored. Whereas the
’wants and needs’ of stakeholders can be the key to
the success of higher education in planning for sus-
tainability.
In research (Jun, 2011) using performance prism
to measure ERP software. (Jun, 2011) mentions that
performance prism is a beneficial performance mea-
surement model in providing management services
because it is comprehensive and easy to understand,
besides it is not only stakeholder oriented, but perfor-
mance prism also measures the contribution made by
stakeholders to the organization.
(Yu and Zhu, 2011) in his research stated that the
evaluation system using performance prism has good
practical operability because it uses all stakeholders
and their five facets, namely stakeholder needs, or-
ganizational strategy, business processes and stake-
holder contributions as a consideration.
(Kara, Lamouchi and Ramdane-Cherif, 2017) us-
ing ISO 25010 and the concept of fuzzy logic to eval-
uate the Ambient Assisted Living System, the eval-
uation results can show the required quality models
and produce quality indicators that can help users in
making the right decision at the same time.
(Huda, 2017) in his research, trying to integrate
Webqual 4.0 with ISO/IEC 25010. Measurement of
academic and financial information systems produces
more complete indicators so that the assessment of
software quality is better.
Research (Lesmideyarti et al., 2017) uses ISO /
IEC 25010 to measure the performance of academic
information systems and compares with academic
information system measurements using ISO / IEC
9162. The results of measurements using ISO / IEC
25010 are more accurate because of the characteris-
tics of ISO / IEC 25010 more complete.
3 METHODOLOGY
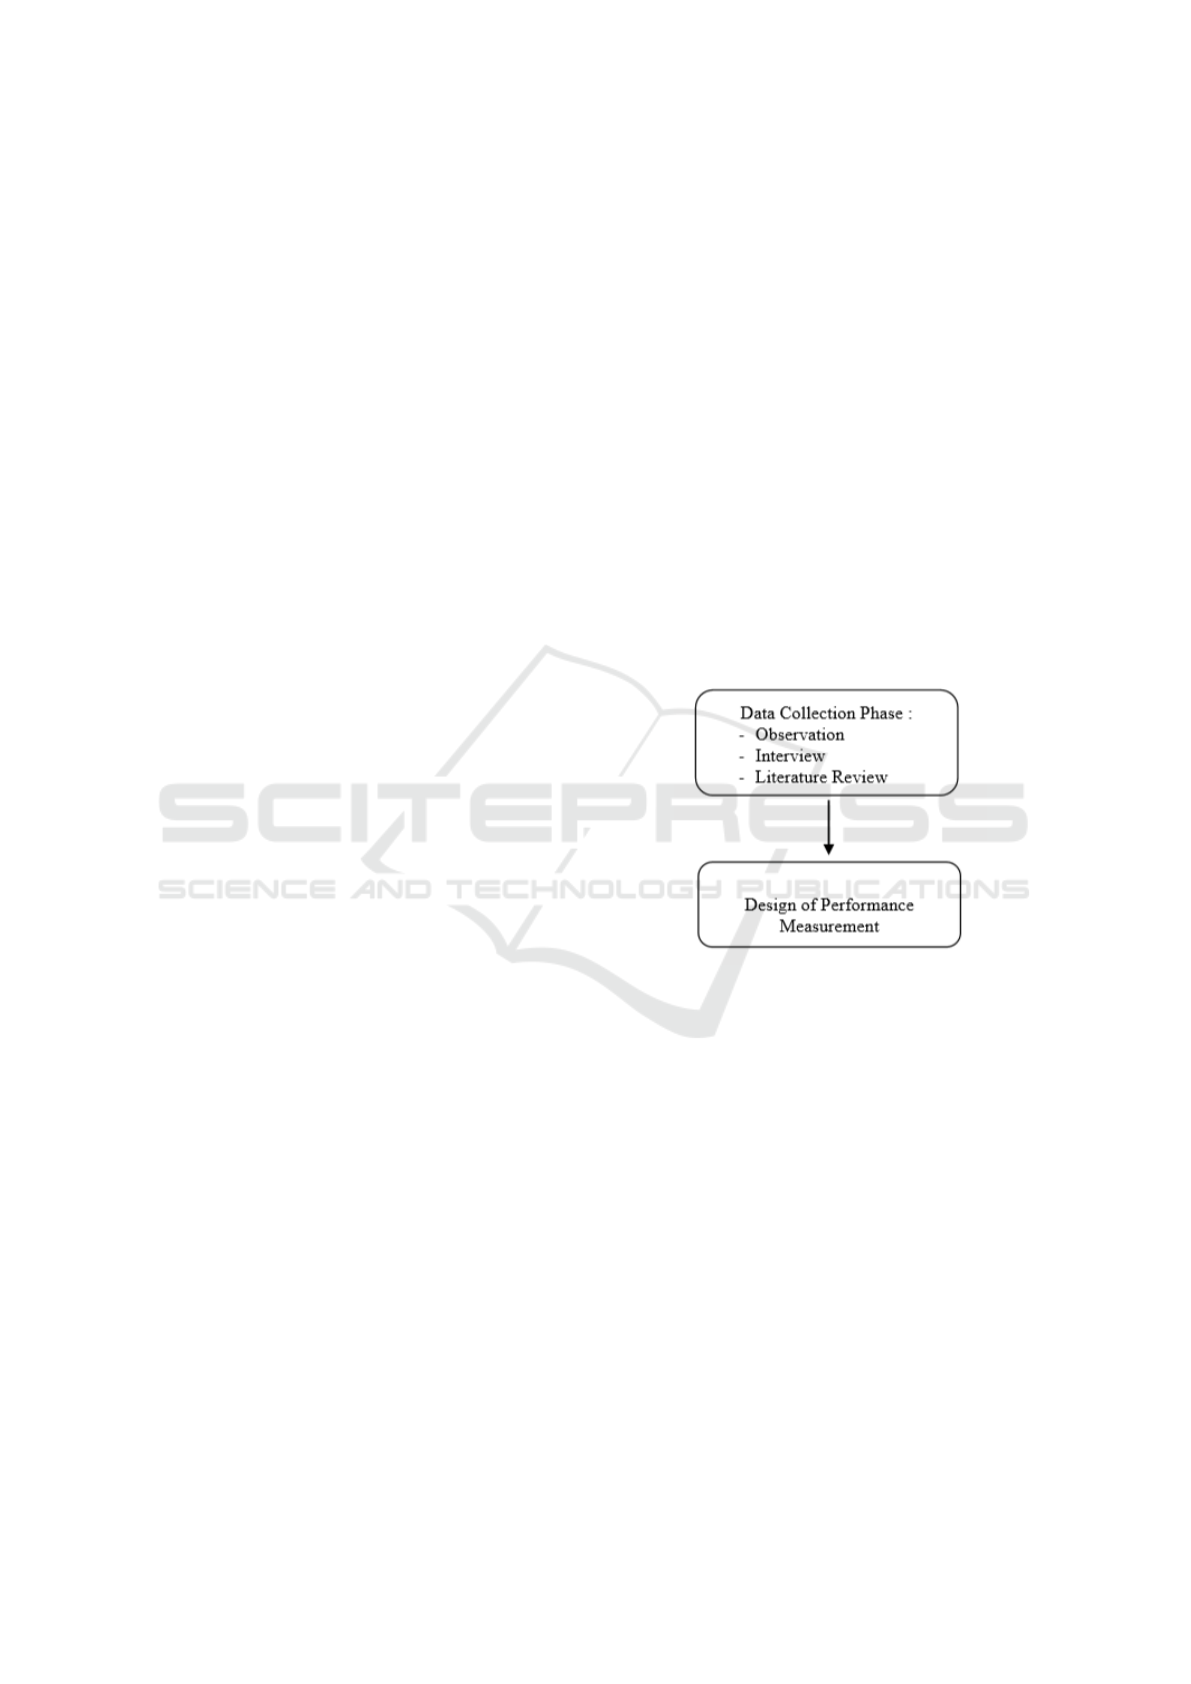
This research was carried out in several stages which
are depicted in Figure 1 as follows :
Figure 1: Research Stages
3.1 Data Collection Phase
Data collection techniques are the most strategic step
in research because the primary purpose of the re-
search is to get data. Data collection can be done
in variety ways, various sources, and various set-
ting (Sugiyono, 2011). The following data collection
methods are used:
3.1.1 Observation
Observation is one of the essential tools to collect
data. Observing means paying attention to phe-
nomena in the field through the five senses of the
researcher, often with instruments or devices, and
recording them for scientific purposes. These obser-
vations are based on research objectives and research
questions (John et al., 2009). This observation was
CONRIST 2019 - International Conferences on Information System and Technology
212

carried out by looking directly at the processes and ac-
tivities that are running in the case study of Poltekkes
Kemenkes Surabaya.
This technique is done to get a real picture of
an event and learn what activities are carried out in
the Academic Subdivision of Poltekkes Kemenkes
Surabaya.
3.1.2 Interview
Interviews are used as data collection techniques if
the researcher wants to conduct a preliminary study to
find problems that must be investigated, but also if the
researcher wants to know things from the respondents
in more depth (Sugiyono, 2011). In this study, in-
terview techniques in the form of personal interviews
(personal interviews), personal interviews conducted
by doing face-toface with respondents. This inter-
view method is conducted to find information related
to academic activities or activities carried out by the
Poltekkes Kemenkes Surabaya by interacting with the
Academic Subdivision and IT Unit. From the results
of this interview, data, and information in the form of
using AIS and AIS changes were collected.
3.1.3 Literature Review
This literature review is carried out to collect and
compare the results of several similar studies, such
as previous studies regarding the design of measure-
ments with the performance prism and ISO / IEC
25020 methods, then study them. Comparing the re-
sults of previous studies also helps the author to find
things that distinguish between the author’s research
with previous studies.
3.2 Design of Performance
Measurement
For the design of performance measurements using
Performance Prism and ISO / IEC 25010. In this
modeling starts from applying the performance prism
method. Conducting interviews with stakeholders on
each performance prism facet. Then map it to ISO
/ IEC 25010. Furthermore, do performance calcula-
tions.
4 RESULT AND DISCUSSION
In this research, several stages will be carried out in
measuring the performance of the AIS Poltekkes Ke-
menkes Surabaya, among others:
4.1 Problem Identification
Identify the problem to describe what is experienced
by IT decision-makers based on their experiences
(John et al., 2009). At this stage, several processes
are carried out, namely: i). Analysis of case studies,
and ii). Literature study
4.1.1 Case Study Analysis
The selection of the Poltekkes Kemenkes Surabaya
AIS as a case study due to several considerations in-
clude:
1. AISs have been developed starting in 2011 and al-
ways developing from year to year
2. An AIS is needed by the academic community
and has provided many benefits for its users
3. AISs continue to change following the wishes of
users, which means AISs adjust the wants and
needs of users. By following the principle of per-
formance prism that prioritizes the needs of users/
stakeholders
4. AISs have tried to follow the desires of the user,
but until now there are still some menus that are
not yet according to the user’s wishes
4.1.2 Literature Study
A literature study is done by collecting supporting
data about theories that support research, related re-
search, and methods that are widely used as a refer-
ence in this research. A literature study is done by
examining books, literature, notes, and reports that
are related to performance measurement using perfor-
mance prism and ISO / IEC 25010.
4.2 Development of Performance
Measurement Models
According to (Logsdon and Lewellyn, 2000) the ap-
plication of standards is essential because standard-
ization can create conditions and pressures among
stakeholders so as to improve sufficient quality. From
a stakeholder perspective, an vital element of the qual-
ity of the corporate governance structure is the ca-
pacity to protect the interests of various stakehold-
ers (Gnan et al., 2013). Although involving stake-
holders is complex and timeconsuming, the benefits
are more significant because by involving stakehold-
ers the risk of losing specific information is smaller
(Delnoij et al., 2010). Stakeholder analysis must be
used as one important evaluation (Farbey et al., 1999),
Designing Academic Information System Performance Measurement using Performance Prism and ISO/IEC 25010
213
and understanding stakeholder strategies are benefi-
cial and can affect the success of information systems
(Vaidya et al., 2011).
Because quality is the elements contained in a
product (Tausworthe, 1995). Then the quality is not
absolute but based on the perspective of the assessor
(Gentleman, 1997).
Understanding the ability of information system
functions to meet business needs is very important for
organizations (Peppard and Ward, 1999). One way is
to explore the use and satisfaction of users to mea-
sure the effectiveness and success of information sys-
tems. User satisfaction in using information systems
can affect the performance of these users (Gelderman,
1998). While the quality of the system has a direct
and indirect impact on satisfaction (G
¨
urkut and Nat,
2017).
Based on a literature, a conceptual model was
made regarding the measurement of performance of
the AIS. The conceptual model developed in this
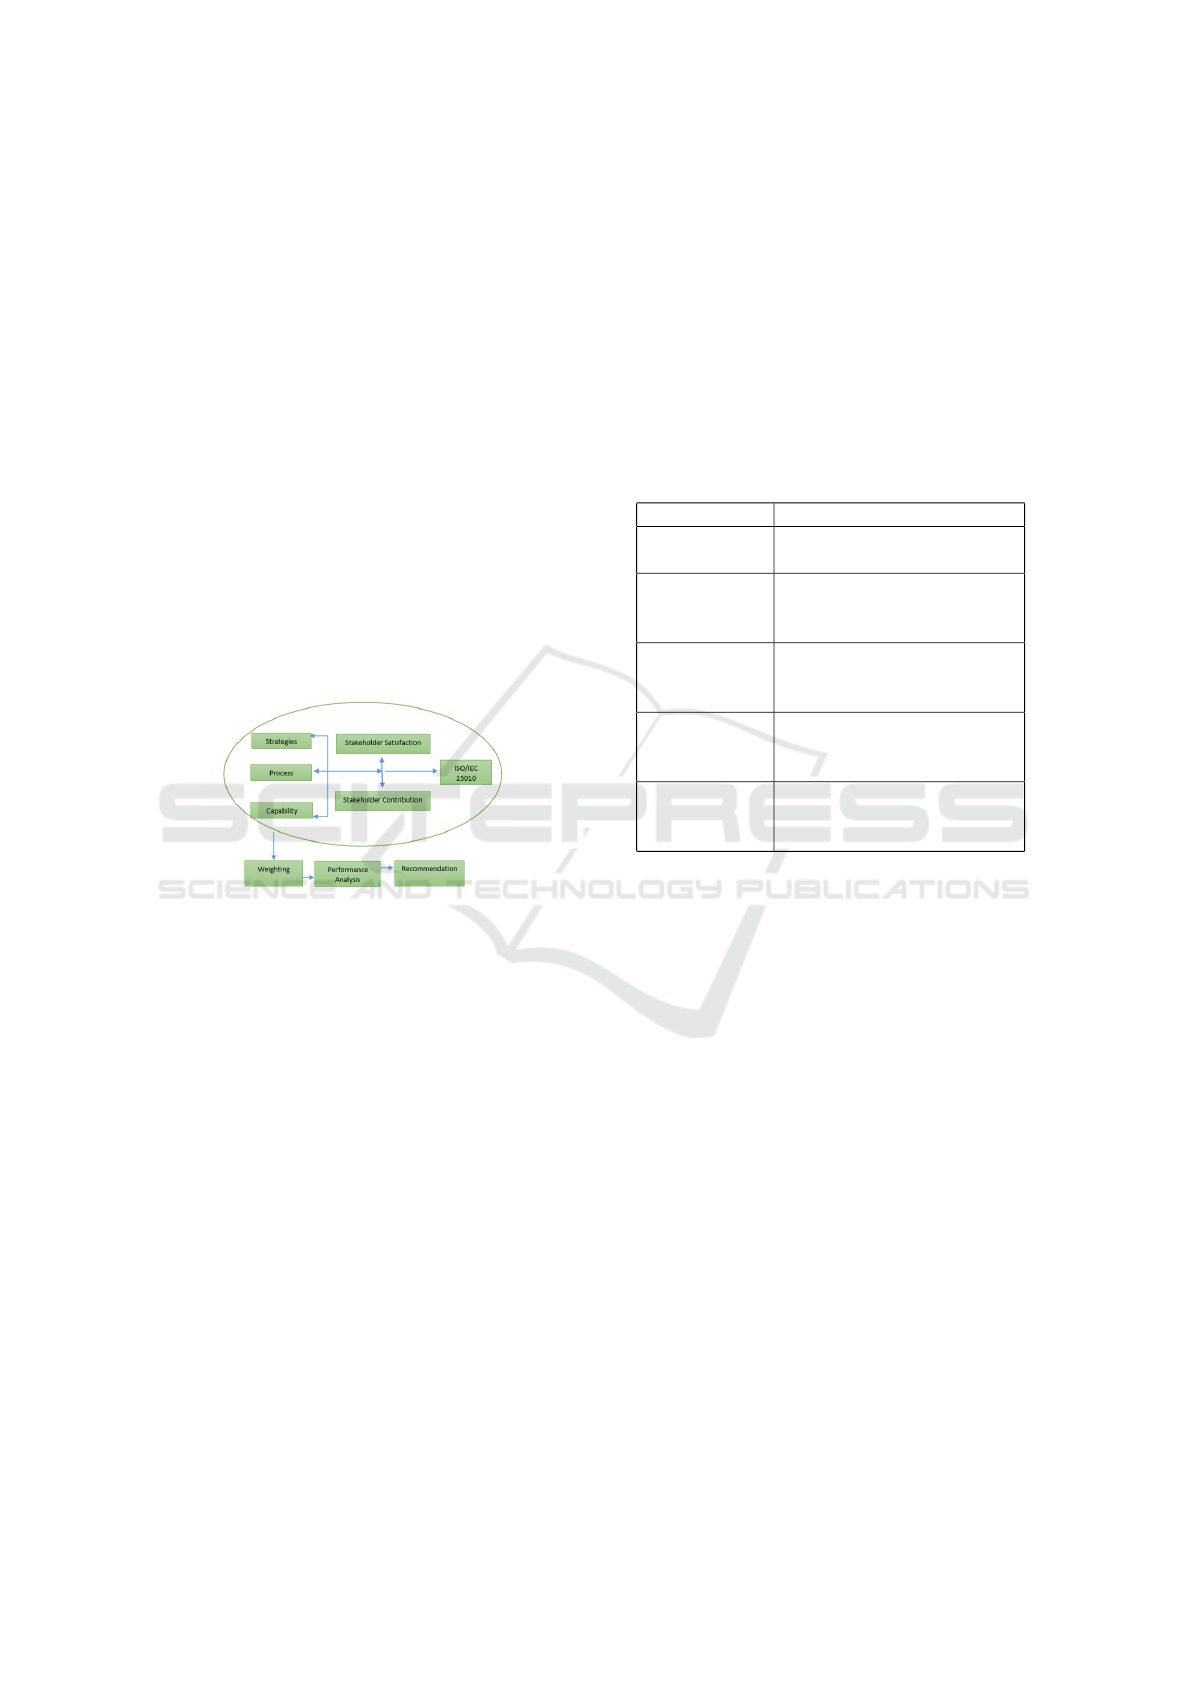
study is described as follows:
Figure 2: Conceptual Model
Figure 2 is a system measurement model by com-
bining the performance prism model and ISO / IEC
25010. It can be seen in the picture that the satisfac-
tion aspects of each stakeholder will be supported by
strategies, processes, stakeholder contributions, and
the ability of the system itself. Measurement indi-
cators resulting from stakeholder satisfaction will be
combined with existing measurement indicators in
ISO / IEC 25010.
4.3 Analysis of Problem Solving
In this study, there are several stages in the analysis of
problem-solving, namely:
4.3.1 Identification of Stakeholders
Done by collecting data which is directly involved
in AIS based on discussions and interviews with the
Head of IT Unit. The role of each stakeholder towards
AIS is also identified to find out the role of each stake-
holder so that stakeholder grouping can be identified.
The identified stakeholders have then grouped again
into key stakeholders
4.3.2 Identification of the Five Facets of
Performance Prism
Interviewing the determination of the facet of Prism’s
performance is conducted on all key stakeholders.
Table 1 is the format of the questions asked during
the interview grouping the five performance facets of
Prism for each key stakeholder.
Table 1: Format for the Determination of Five Facets of
Performance Prism.
Facets Question
Satisfaction What do you want and need
from AIS?
Strategy According to you, what
strategies can be done to
meet these wants and needs?
Process What processes can be im-
plemented to realize the
strategy?
Capabilities What abilities must AIS
have in order for this process
to be carried out?
Contribution What kind of contributions
can you make to AIS in sup-
porting the process?
4.3.3 Mapping ISO/IEC 25010
At this stage, an ISO/IEC 25010 General overview is
grouped according to AIS conditions. Next, a com-
parison of the five facets of performance prism iden-
tification for each key stakeholder is made based on a
grouping of the ISO/IEC 25010 general picture.
4.3.4 Identification of Performance Indicators
After designing a general description of the quality of
ISO/IEC 25010 and comparing with five facets of per-
formance prism, the next step is to identify the perfor-
mance indicators that refer to the results of compari-
son of five facets of performance prism of each stake-
holder with an overview of ISO/IEC 25010. After
that, the classification is done according to the basic
framework of performance prism (Arianto and Par-
tiwi, 2009).
CONRIST 2019 - International Conferences on Information System and Technology
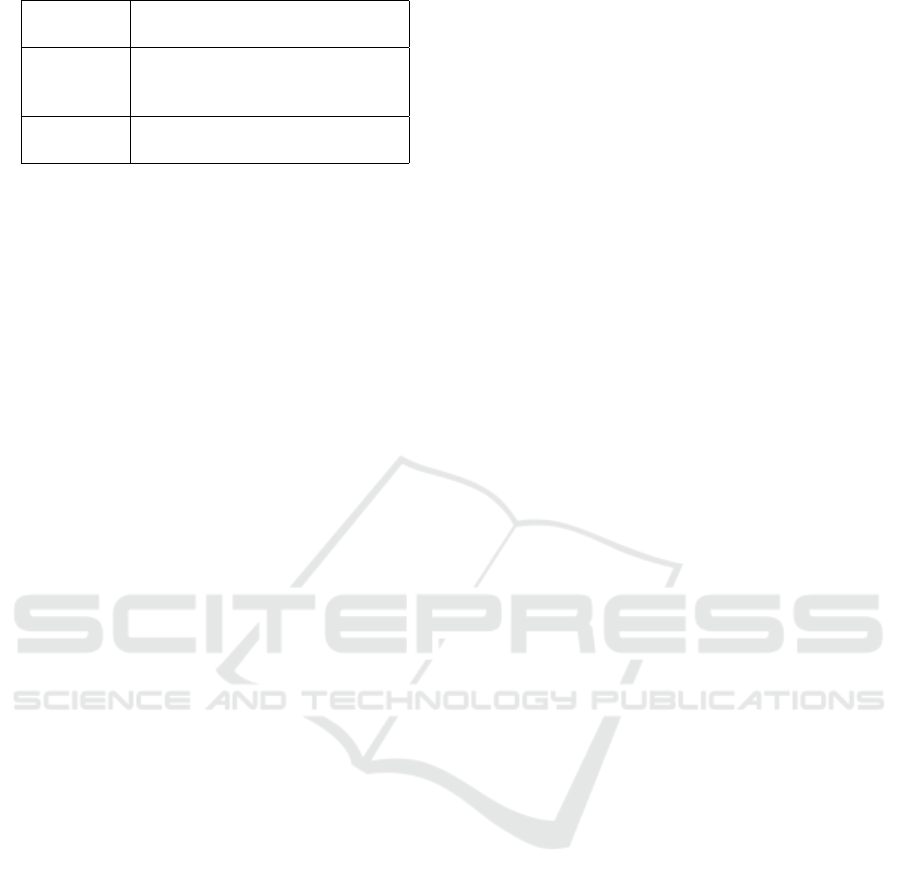
214
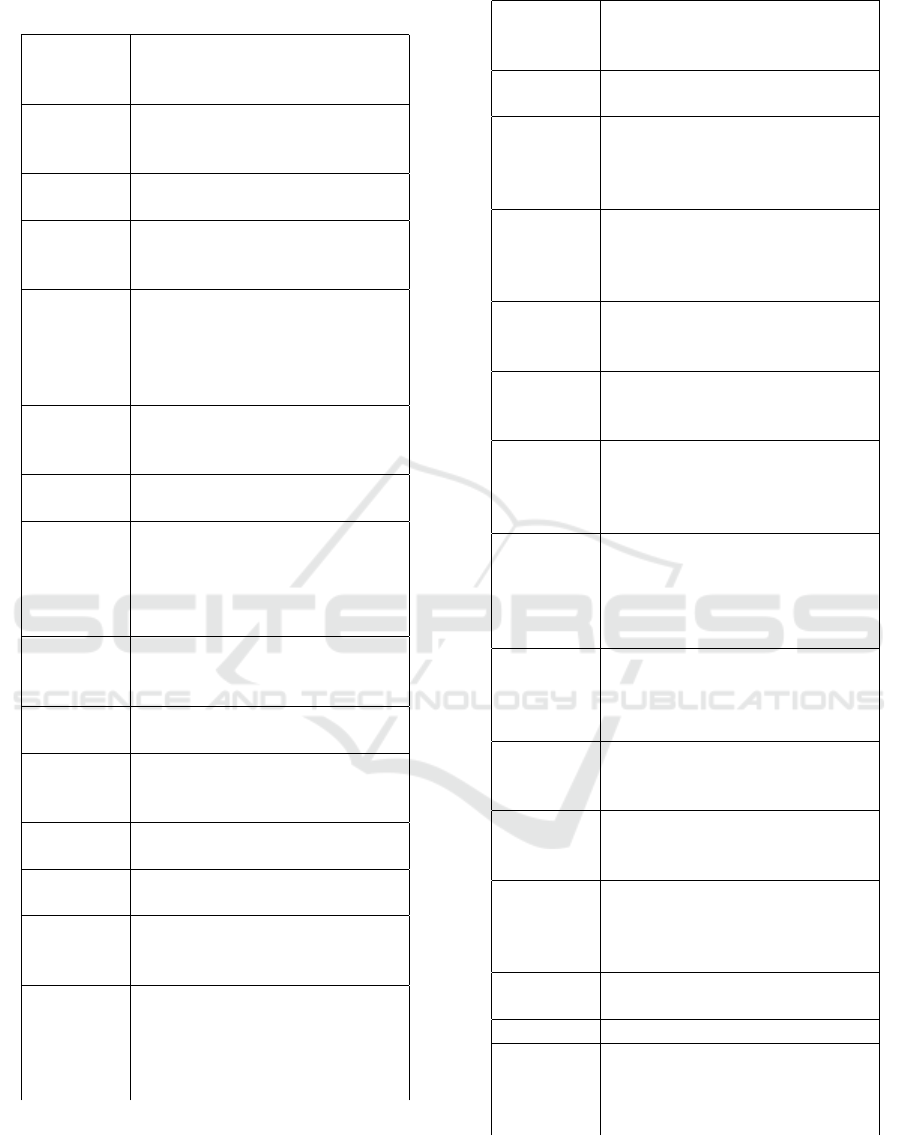
Table 2: Indicator for Performance Measurement.
Key Per-
formance
Indicator
Performance Indicator
Functional
Suitability
Functions on AIS are capable
perform tasks according to their
respective goals
AIS provides right results with
the required level of precision.
The function of AIS can facili-
tate the completion of tasks and
goals that have been determined
Performance
efficiency
Response and processing time
as well as the level of AIS
throughput when carrying out
its functions meet the require-
ments
The resources used by AIS in
carrying out its functions meet
the requirements
The maximum limit or AIS pa-
rameter meets the requirements
CompatibilityAIS can perform the necessary
functions efficiently while shar-
ing the same environment and
resources with other products,
without harming other products.
AIS can exchange information
and use information that has
been exchanged
Usability Users can recognize whether
AIS fits their needs.
AIS can create users to under-
stand the way easily operate
AIS
AIS is easy to operate and ac-
cess
AIS protects users from making
mistakes.
The user interface at AIS allows
pleasant and satisfying interac-
tions for users
AIS can be used by people with
the broadest range of character-
istics and abilities to achieve the
goals specified in the context of
a particular use
Reliability AIS is able to bear, handle or
cover up the failures and errors
that occur
AIS operates and can be ac-
cessed when needed to be used
AIS is able to maintain a certain
level of performance in the case
of software errors or violations
committed by users
AIS is able to rebuild perfor-
mance levels and recover data
that is directly affected by fail-
ures or interruptions
Security AIS ensures that data can only
be accessed by those who are
authorized to have access.
AIS prevents unauthorized ac-
cess to, or modification of, com-
puter programs or data
In AIS an action or event can
be proven to have occurred so
that the development or opera-
tion cannot be denied later
The actions of an entity on AIS
can be traced uniquely to the en-
tity The identity of the subject
or resource at AIS can be proven
as claimed
MaintainabilityAIS consists of discrete compo-
nents such that changes to one
part have minimal impact on
other components.
An asset in AIS can be used
in more than one system, or in
building other assets
AIS is able to diagnose the
cause of failure and conduct
failure identification
AIS can be effectively and effi-
ciently modified without intro-
ducing defects or reducing the
quality of existing products
System errors that appear on
AIS can be fixed quickly
The AIS Testing process is easy
Portability AIS is easy to adapt or oper-
ate in diverse operating environ-
ments without applying other
actions or rules
Designing Academic Information System Performance Measurement using Performance Prism and ISO/IEC 25010
215
AIS is easy to install/uninstall in
certain environments
AIS is easy to move to other
sites where software has been
built or specified
Timeliness AIS operates according to the
applicable schedule
Table 2 is the result of the identification of per-
formance indicators after comparing the performance
indicators obtained from performance prism with the
performance indicators of ISO / IEC 25010. Merging
the two models produces more complete performance
indicators. These performance indicators will then be
assessed by distributing questionnaires to competent
respondents. The results of this questionnaire are the
average values of each performance indicator.
4.3.5 AHP Weighting
At this stage, the AHP is weighted three times, the
steps and weighting calculations refer to the AHP
rules and formulas (Saaty, 2008). The weighting party
is competent. It understands AIS, which in this case,
is the Head of the IT Unit because the weighted cri-
teria must be weighted according to company needs
(Arianto and Partiwi, 2009). Weightings carried out
include:
1. Weighting among key stakeholders to determine
the weight of interests of key stakeholders,
2. Weighting between 5 facets of Performance Prism
for each key stakeholder, to determine the impor-
tance of the 5 facets of Performance Prism for
each key stakeholder.
3. Weighting between performance indicators each
stakeholder, this is to determine the weight of each
performance indicator of each key stakeholder.
The weighting is based on interviews with the
Head of IT Unit. Furthermore, the calculation is done
based on AHP rules and formulas. The weighting
of performance indicators and critical stakeholders is
carried out to provide performance values based on
the weight of their respective interests. While the
weighting of 5 performance prism facets is used as a
reference for future performance improvement if per-
formance indicators that have poor performance are
found.
4.3.6 Test Validity and Reliability
Validity and reliability tests are done to avoid incon-
sistent answers from respondents. SPSS can deter-
mine whether the answers given by respondents are
appropriate to be included in the calculation or not.
The rules used are as follows:
1. Kaplan and Saccuzo reliability test (1993), if
Cronbach’s alpha coefficient ≥ 0.77, the results
of the questionnaire can be said to be reliable.
2. Test the validity of the Product Moment (Pear-
son Correlation) method, if the value of Corrected
Item - Total Correlation > 0.3 then the data can be
said to be valid whereas if the Pearson Correlation
value ≤ 0.3 then it is considered invalid
4.3.7 Scoring Value with OMAX
At this stage, a comparison of real performance in-
dicator data obtained earlier through a questionnaire
with a maximum target (level 10) and the worst pos-
sible condition (level 0). The calculation uses the
OMAX formula (Riggs, 1981), which has been ap-
plied to the system built to help with the calculation.
The real situation is obtained from the results of rep-
resentative questionnaires from each key stakeholder.
The result is a score (level) for each performance in-
dicator using the interval formula in OMAX. The re-
sults of performance indicators will be seen in the
Traffic Light System in the form of colors that de-
scribe the state of AIS performance. The results of the
performance values of each performance indicator are
classified into the Traffic Light system according to
the amount of each performance and in the form of 3
colors, namely red, yellow, and green. Because what
is used in the performance appraisal is a Likert scale,
the maximum target (level 10) and the worst condi-
tions that may occur (level 0) are determined based
on the upper and lower limits of the Likert Scale. The
results of this traffic light system will show which per-
formance indicators have been achieved, which have
not been achieved as well as indicators that are far
from the target and thus require recommendations for
improvement.
4.4 Conclussion
At stage is concluded the answers to initial prob-
lem formulation and provide suggestions based on
the results of the analysis that has been done. The
conclusion is the final stage in the study, where the
overall results of the discussion and data processing
have been carried out. The conclusion also discusses
whether or not the problem was raised, or a new prob-
lem arises that can be used as a suggestion for further
research.
CONRIST 2019 - International Conferences on Information System and Technology
216

5 CONCLUSIONS
This study uses performance prism and ISO/IEC
25010 to design performance measurements of aca-
demic information system in the Poltekkes Kemenkes
Surabaya. Performance prism is a measurement
model that focuses more on stakeholders, while
ISO/IEC 25010 is a model of measuring system qual-
ity with international standards. This method should
be implemented for testing. This design produces in-
dicators that can be used as a reference for measuring
academic information systems and can later be used
as recommendations for improvement. The indicators
generated are based on the results of the interviews
and literature review. To produce more detailed indi-
cators, in-depth interviews with each stakeholder are
needed. As well as from the conceptual model pro-
duced it needs to be implemented and used to measure
the performance of information systems in future re-
search.
ACKNOWLEDGEMENTS
I would like to thank Mr. Apol Pribadi Subriadi
for explanation about performance measurement and
guidance to author in writing this article. I do appre-
ciate his professional instructions during writing this
research. I also thank you to Mr. Joko Suwito who
was the main informan from Poltekkes Kemenkes
Surabaya.
REFERENCES
Al Agani, M., Munadi, R., and Subianto, M. (2018). Evalu-
asi kinerja sistem informasi akademik menggunakan it
balanced scorecard pada universitas serambi mekkah
banda aceh. Jurnal Informatika Upgris, 4(1).
Arianto, E. and Partiwi, S. G. (2009). Analisa pengukuran
kinerja dengan menggunakan metode performance
prims (studi kasus: Pt petrokimia gresik). Jurnal Juru-
san Teknik Industri Institut Teknologi Sepuluh Novem-
ber Surabaya.
Delnoij, D. M., Rademakers, J. J., and Groenewegen, P. P.
(2010). The dutch consumer quality index: an exam-
ple of stakeholder involvement in indicator develop-
ment. BMC health services research, 10(1):88.
Farbey, B., Land, F., and Targett, D. (1999). Moving is
evaluation forward: learning themes and research is-
sues. The Journal of Strategic Information Systems,
8(2):189–207.
Gelderman, M. (1998). The relation between user satisfac-
tion, usage of information systems and performance.
Information & management, 34(1):11–18.
Gentleman, W. M. (1997). If software quality is a percep-
tion, how do we measure it? In Quality of Numerical
Software, pages 32–43. Springer.
Gnan, L., Hinna, A., Monteduro, F., and Scarozza, D.
(2013). Corporate governance and management prac-
tices: stakeholder involvement, quality and sustain-
ability tools adoption. Journal of Management & Gov-
ernance, 17(4):907–937.
Govindaraju, R. Measuring the performance of information
system function.
G
¨
urkut, C. and Nat, M. (2017). Important factors affect-
ing student information system quality and satisfac-
tion. EURASIA Journal of Mathematics, Science and
Technology Education 3/2018, 14:923–932.
Huda, D. N. (2017). Peningkatan kualitas sistem informasi
akademik dan keuangan berdasarkan webqual 4.0 dan
iso/iec 25010: Studi kasus sekolah tinggi teknologi
indonesia tanjungpinang. Jurnal Bangkit Indonesia,
6(2):1–1.
John, W. C. et al. (2009). Research design: Qualitative,
quantitative, and mixed methods approaches. Sage
Publication.
Jun, S. (2011). Bmei 2011 - proceedings 2011 interna-
tional conference on business management and elec-
tronic information.
Lagsten, J. (2011). Evaluating information systems ac-
cording to stakeholders: A pragmatic perspective and
method. Electronic Journal of Information Systems
Evaluation, 14(1).
Lesmideyarti, D., Rochimah, S., and Yuhana, U. L. (2017).
Penyusunan dan pengujian metrik operabilitas untuk
sistem informasi akademik berdasarkan iso 25010.
Inspiration: Jurnal Teknologi Informasi dan Komu-
nikasi, 7(2):92–100.
Levin, R. I. and Kirkpatrick, C. A. (1971). Quantitative
approaches to management.
Designing Academic Information System Performance Measurement using Performance Prism and ISO/IEC 25010
217

Logsdon, J. M. and Lewellyn, P. G. (2000). Expanding ac-
countability to stakeholders: Trends and predictions.
Business and Society Review, 105(4):419–419.
LPTSI (2016). Layanan teknologi dan sistem informasi.
Neely, A., Adams, C., and Crowe, P. (2001). The perfor-
mance prism in practice. Measuring business excel-
lence.
Neely, A. D., Adams, C., and Kennerley, M. (2002). The
performance prism: The scorecard for measuring and
managing business success. Prentice Hall Financial
Times London.
Peppard, J. and Ward, J. (1999). ‘mind the gap’: diagnos-
ing the relationship between the it organisation and the
rest of the business. The Journal of Strategic Informa-
tion Systems, 8(1):29–60.
Ravichandran, T., Lertwongsatien, C., and Lertwongsatien,
C. (2005). Effect of information systems resources
and capabilities on firm performance: A resource-
based perspective. Journal of management informa-
tion systems, 21(4):237–276.
Riggs, J. L. (1981). Production systems: Planning, analysis
and control. Technical report.
Saaty, T. L. (2008). Relative measurement and its general-
ization in decision making why pairwise comparisons
are central in mathematics for the measurement of in-
tangible factors the analytic hierarchy/network pro-
cess. RACSAM-Revista de la Real Academia de Cien-
cias Exactas, Fisicas y Naturales. Serie A. Matemati-
cas, 102(2):251–318.
Setiyawan, A., Purnama, B. E., et al. (2013). Pembuatan
sistem informasi akademik berbasis web pada sekolah
menengah atas negeri 1 ngadirojo. IJNS-Indonesian
Journal on Networking and Security, 4(3).
Smulowitz, S. (2015). Evidence for the performance prism
in higher education. Measuring Business Excellence.
Sprague Jr, R. H. and Carlson, E. D. (1982). Building effec-
tive decision support systems. Prentice Hall Profes-
sional Technical Reference.
Sugiyono, P. (2011). Metodologi penelitian kuantitatif kual-
itatif dan r&d. Alpabeta, Bandung.
Tausworthe, R. C. (1995). Software quality management
through process and product modeling. Annals of Soft-
ware Engineering, 1(1):119–139.
Vaidya, R., Myers, M. D., and Gardner, L. (2011). The
design–reality gap: The impact of stakeholder strate-
gies on is implementation in developing countries.
In IFIP International Working Conference on Gov-
ernance and Sustainability in Information Systems-
Managing the Transfer and Diffusion of IT, pages
119–134. Springer.
Yu, B. and Zhu, B. (2011). Design of performance evalu-
ation system for the informatization of chemical en-
terprise based on performance prism. In 2011 IEEE
3rd International Conference on Communication Soft-
ware and Networks, pages 394–396. IEEE.
Zhu, K. (2004). The complementarity of information
technology infrastructure and e-commerce capabil-
ity: A resource-based assessment of their business
value. Journal of management information systems,
21(1):167–202.
CONRIST 2019 - International Conferences on Information System and Technology
218
