
Analysis of the Student Background and Social Influence for Social
Media-based Learning
Surjandy
1
, Meyliana
1
, Yuli Eni
2
, Erick Fernando
1
, Kristianus Oktriono
3
and Chutiporn Anutariya
4
1
Information Systems Department, School of Infomration Systems, Bina Nusantara University, Jakarta, Indonesia
2
Management Department, Binus Business School Undergraduate Program, Bina Nusantara University, Jakarta, Indonesia
3
Language Center, Faculty of Humanities, Bina Nusantara University, Jakarta, Indonesia
4
School of Engineering and Technology, Asian Institute of Technology, Pathumthani, Thailand
Keywords:
social media learning, explanatory, correlation bivariate technique, social influence, social media based
learning.
Abstract:
The function of Social Media has developed over time since its inception. It tackles a specific challenge for
social activities instruments and learning tools. As the literature indicated, early spans of research drove the
initiative to elaborate on social media for learning purpose. In this frame, the research urges to expound
the relationship between university student background and social influence factor of social media used for
the objective of learning. At a closer look, the study engaged the causal or explanatory method to find the
relationship between university background factors such as grade point, gender, strata, semester, age time
spent for social media and social influence factors such as family and friend. On that basis, the study used
SPSS to process the data and apply the correlation bivariate technique. With these lenses, the study obtained
twenty-four significant pair factors. The result of the study contributes substantially to the development of
social media for future learning tools.
1 INTRODUCTION
At its core, learning method rapidly develops from
the conventional way into technological-based; the
changes are occurring in Indonesia similarly. Re-
cently, the data of active internet users accounted
for 143 million of the total population in Indone-
sia (APJII, 2018). As the study revealed, previous
research reported that most university students used
a smartphone for learning and social activities (Sur-
jandy, 2016) (Balakrishnan and Gan, 2016) (Gikas
and Grant, 2013) (Acarli and Sa
˘
glam, 2015). In this
respect, the students accessed Facebook for learn-
ing supporting tool (Tanty, 2017). However, the re-
sult of previous research in social media for learning
drives(Deaton, 2015) an insistence debate such as
• lack of response from the participant,
• unfamiliar with the topic,
• encountering difficulty(Manca and Ranieri,
2016),
• another issues is fake degree provided by univer-
sity that provided online (social media) learning
activity(Abbas et al., 2019).
Therefore, this study attempts to explore the so-
cial influence of university student in using social
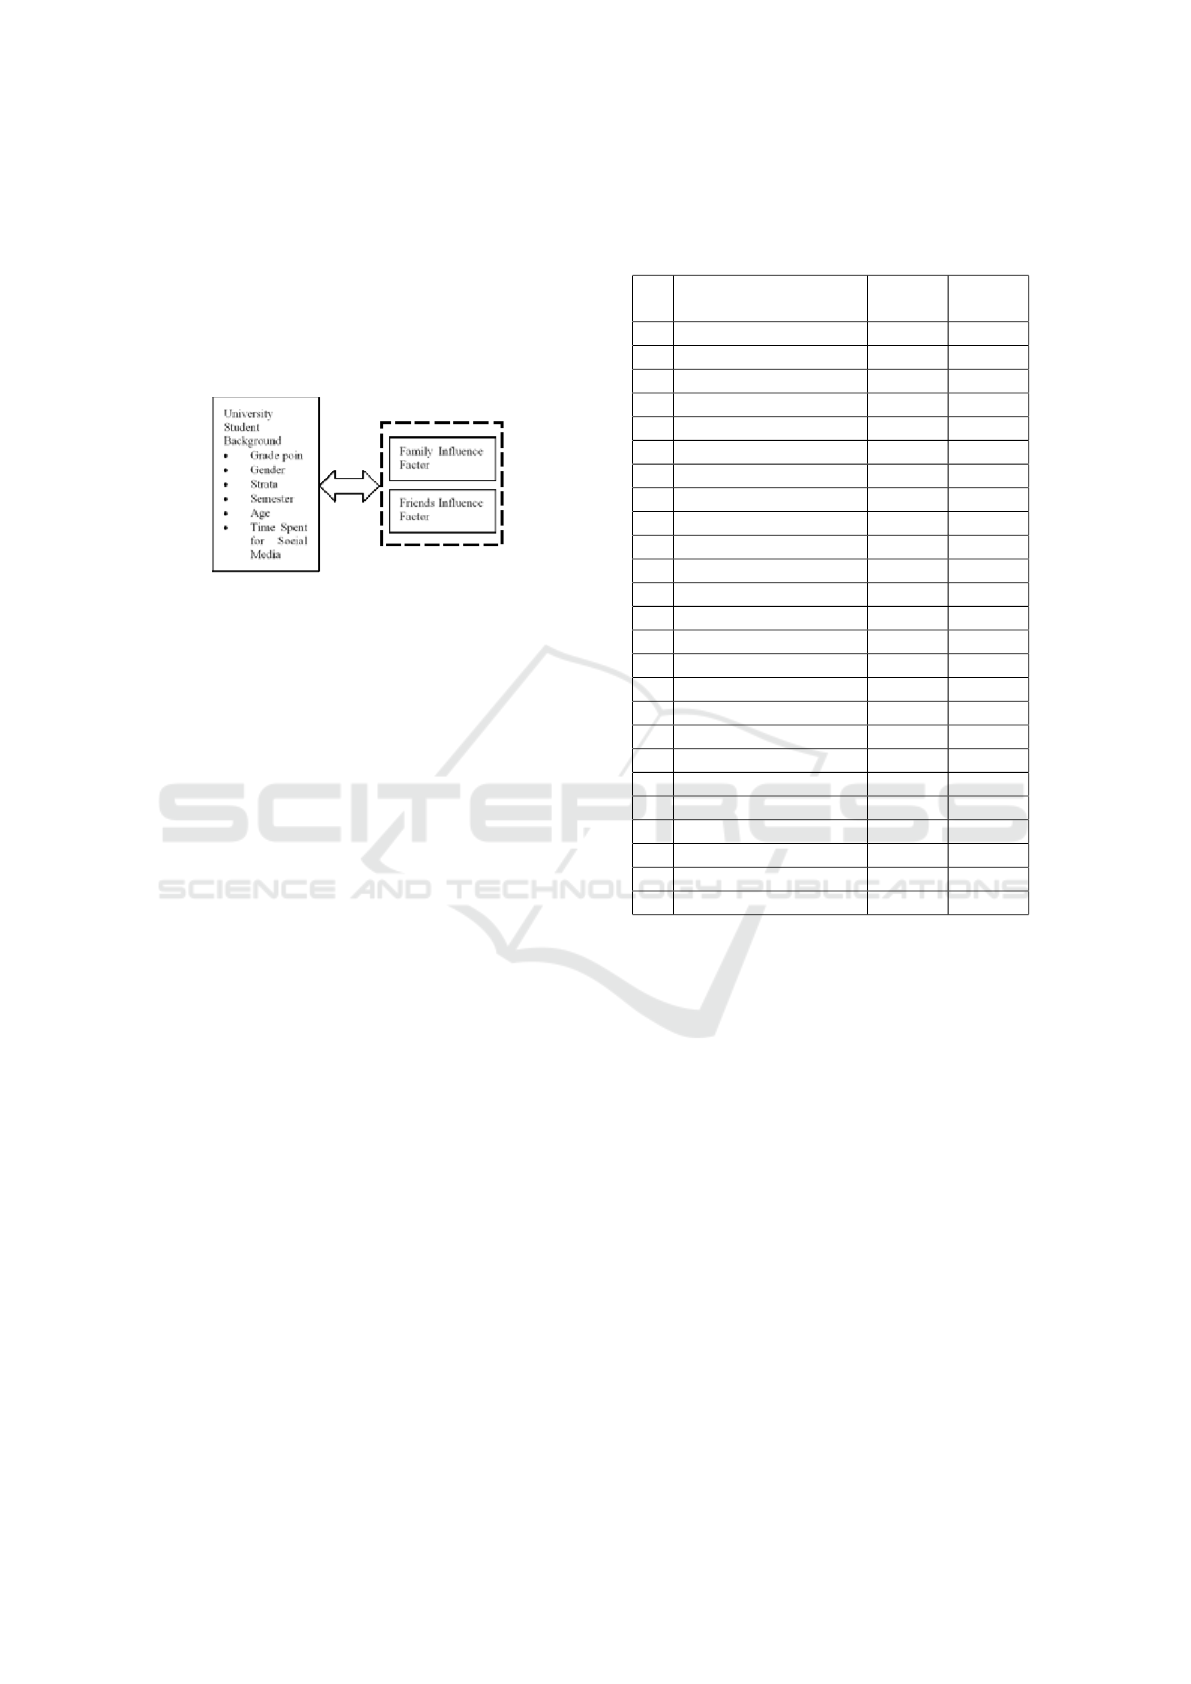
media and smartphone for learning purpose. In this
line, causal or explanatory research method is used in
this study to describe the relationship of influence be-
tween factors. Figure 1 represented the explanation
of the research design. In the scope of sampling, the
study involved four hundred and fortysix respondents
in this paper from several universities in Indonesia
and all participants posed as active users in the con-
text of social media.
The hypothesis of the study consists of two parts:
• The university student background has the influ-
ence to use social media for learning. H0 Uni-
versity Student’s background has no influence to
use social media for learning. H1 University Stu-
dent’s background has the influence to use social
media for learning
• The social influence has a relation to use social
media for learning
H0 Social influence has no relationship to use
social media for learning.
H1 Social influence has a relationship to use
184
Surjandy, ., Meyliana, ., Eni, Y., Fernando, E., Oktriono, K. and Anutariya, C.
Analysis of the Student Background and Social Influence for Social Media-based Learning.
DOI: 10.5220/0009907601840192
In Proceedings of the International Conferences on Information System and Technology (CONRIST 2019), pages 184-192
ISBN: 978-989-758-453-4
Copyright
c
2020 by SCITEPRESS – Science and Technology Publications, Lda. All rights reserved
social media for learning
The study found twenty-four significant relations
between factors. In a specific context, there are six-
university student’s backgrounds who have influence
and relationship with social influence. It directs that
the result of this study contributed significantly to the
development of social media for learning in the future.
Figure 1: Research Design
2 METHODOLOGY
In this session will explain about methodology used
in this study such as causal research, Pearson strength
tension correlation, bivariate technique
2.1 Causal Research
Causal Research or also known as Explanatory Re-
search is usually used for preliminary research to look
for a relationship between factors or influence of one
factor to another and used in marketing or sales area
(Ltd, 2006) (Businessdictionary, 2019).
2.2 Pearson Strength Tension
Correlation
The Pearson correlation (r) value can be used to de-
scribe the tension of the correlation where the value
between .1 to .3 refers to small or weak tension of
correlation. Meanwhile, the score of between .3 to
.5 reflects medium or moderate tension of correlation.
The score that is higher than .5 is large or strong cor-
relation (Yeager, 2019).
2.3 Bivariate Technique
In this part, one of the techniques to look for the rela-
tionship between factors by using SPSS application is
Bivariate correlation. In this line, this technique will
show the Pearson correlation (r) value or relationship
between factors (IBM, 2019). Meanwhile, the Pear-
son correlation (r) value describes the tension of the
relationship between factors.
2.4 Data Collection
Table 1: Respondent Background.
No Description Total
N=446
Percent
1 Grade Point(D1)
1. < 2 20 4.5%
2. 2.01 – 2.50 24 5.4%
3. 2.51 – 2.99 85 19.1%
4. > 3.00 317 71.1%
2 Gender(D2)
1. Female 279 62.6%
2. Male 167 37.4%
3 Strata(D3)
1. Diploma 37 24.0%
2. Bachelor 402 24.9%
3. Master 6 17.0%
4. Doctoral 1 34.1%
5 Age(D5)
1. <17 4 0.9%
2. 18 – 25 434 97.3%
3. 26 – 30 3 0.7%
4. >30 5 1.1%
6 Social Media(D6)
1. <3 hours 31 7.0%
2. 3 – 5 hours 105 23.5%
3. 6 – 8 hours 145 32.5%
4. 9 – 11 hours 88 19.7%
5. 12 – 14 hours 30 6.7%
> 15 hours 47 10.5%
In this section, the snowball technique is used to
gather the respondent. Technically, the researchers
used google form application to support the research.
Also, the sample of the respondent in this study con-
sisted of four hundred and forty-six. Based on In-
donesia Internet Service Association in 2018, the in-
ternet user in Indonesia is 143,26 million users, and
89.35% is active social media user or around 128 mil-
lion users(APJII, 2018). With this setting, the re-
searchers applied Slovin’s formula. The minimum re-
spondent required is 400 respondents. See Table 1.
2.5 Social Media
The ubiquitous social media has captured the atten-
tion of the learners. In this sense, the engagement of
the function and the attachment of the features also
attract the learners’ potential in exploring the util-
ity. In this spectrum, interaction and communication
have progressed over time and platform. In this area,
it integrates collaborative and collective preference.
Arguably, Faizi stated that social media embraces a
Analysis of the Student Background and Social Influence for Social Media-based Learning
185
myriad of tools that amalgamate technology, social
interaction and content creation (Faizi et al., 2013).
With this in mind, social media informs the learn-
ers of the two effect on learning. Firstly, it allows
learners to select appropriate media platforms. It en-
hances the learners’ preference to devise the learn-
ing plan(Deaton, 2015). On the other hand, global
access on the data and information to social media
emerges significant engagement that decreased the
performance. Lahiri and Moseley listed the benefit
and limitations of social media(Lahiri and Moseley,
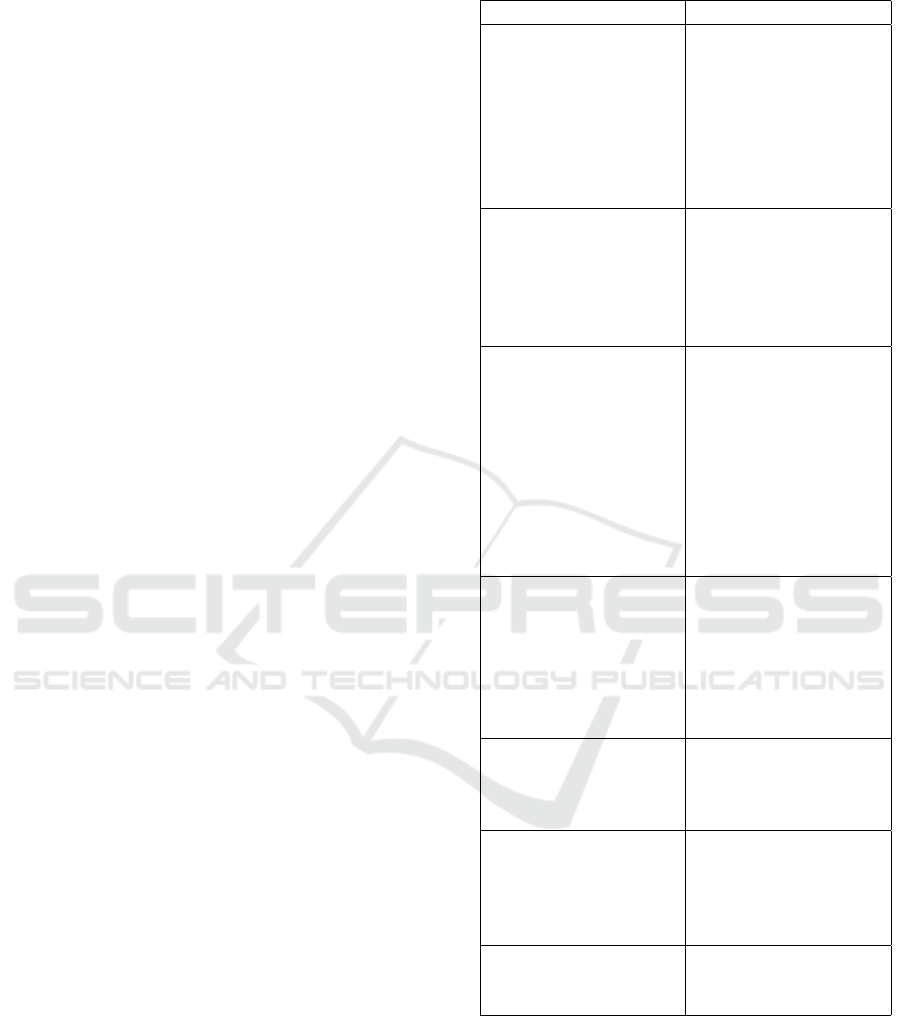
2015) in Table 2.
Table 2: Benefits and Limitations.
Benefit Limitations
1. Social media en-
courages collaborative
learning
1. Making a safe com-
munity presence is a
challenge. Use and
access to social media
when used in school
work must be moni-
tored closely by the in-
structor.
2. Social media en-
ables the modelling of
behaviour
2. Social media can
pose as a distraction
for the learners and
shift the focus from
learning to other stuff
on the web.
3. Social Media moti-
vates the learner to be-
come active creators of
content and more par-
ticipation
3. Social media can
easily become a tool
for cyberbullying and
other forms of cyber-
crimes. Instructors
need to be vigilant of
any such possibilities
and address civil and
respectful cyber be-
haviour.
4. Social media pro-
motes the building of
learning communities
and foster productive
discussions and shar-
ing of knowledge and
information.
4. Use of social me-
dia for communication
might be a discourag-
ing factor for face to
face communication or
human interaction
5. Social media can
be used by instructors
to enhance student en-
gagement
6. Social media
can be used to im-
prove communication
among learners and
instructors
7. Alumni group can
connect and grow with
social media
CONRIST 2019 - International Conferences on Information System and Technology
186
3 RESULT AND DISCUSSION
In this segment, the research applied validity and reli-
ability test.
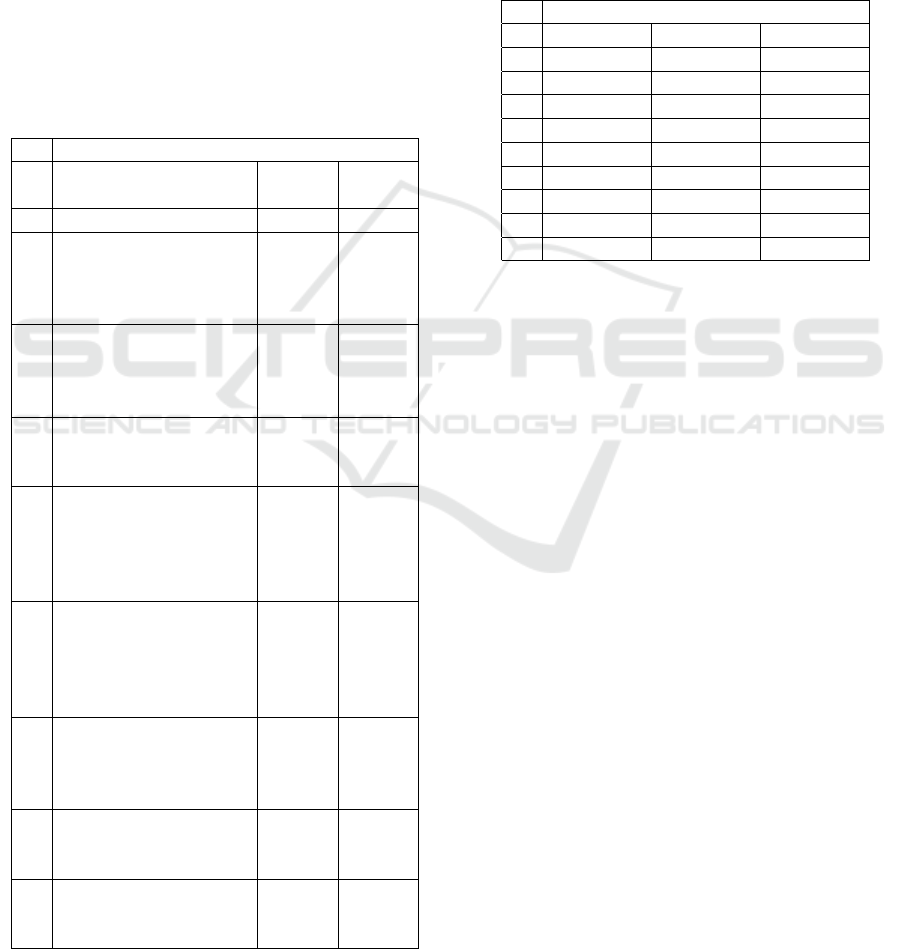
3.1 Validity Test Result
Table 3 portrays the detail of the validity test result.
Validity test is performed by comparing the Corrected
item-total Correlation score with Pearson r Table, and
the Pearson r Table value is 0.097824 (N=400, 0.05).
It reflects that if the CI-TC Score is greater than
0.097824, than the result is valid and not valid if the
CI-TC is lower than 0.097824.
Table 3: Validity Test
No Validity Result Test
Description CI-TC
Score
Status
1 D6 0.212 Valid
2 Friends influence me
to use social media to
improve academic per-
formance (SI1)
0.711 Valid
3 The Family influence
me to use social media
to improve academic
performance (SI2)
0.723 Valid
4 Friends think that I
have to use social me-
dia to learn (SI3)
0.720 Valid
5 The campus environ-
ment encouraged me
to use the smartphone
to complete my as-
signment (SI4)
0.732 Valid
6 The campus environ-
ment provides facili-
ties and allows to use
of social media in lec-
tures (SI5)
0.492 Valid
7 Lecture activities al-
low me to use social
media to find informa-
tion (SI6)
0.565 Valid
8 Families recommend
using smartphones for
learning (SI7)
0.598 Valid
9 Friends recommend
using a smartphone
for learning (SI8)
0.715 Valid
3.2 Reliability Test Result
Following validity test results valid, the process con-
tinues with the reliability test to ensure the con-
sistency of data. The consistency of data will be
measured by checking the Cronbach’s Alpha if item
deleted or Cronbach Alpha score. If the Cronbach Al-
pha score is greater than 0.6, data is considered con-
sistent (UCLA, 2019). Table 4 shows the detail of the
data reliability test.
Table 4: Reliability Test
No Reliability Result Test
Description Score Status
1 D7 0.890 OK
2 SI1 0.844 OK
3 SI2 0.842 OK
4 SI3 0.842 OK
5 SI4 0.842 OK
6 SI5 0.864 OK
7 SI6 0.859 OK
8 SI7 0.855 OK
9 SI8 0.844 OK
Analysis of the Student Background and Social Influence for Social Media-based Learning
187

3.3 Bivariate Correlation Result
Table 5: Bivariate Result
D1 D2 D3 D4 D5 D6
SI1 -
.182**
0.000
.136**
0.000
.100*0
.034
NC -
.131**
0.006
.229**
0.000
H0 Reject Reject Reject Accept Reject Reject
H1 Accept Accept Accept Reject Accept Accept
SI2 -
.244**
0.000
.118*0
.013
NR -
0.01
.154**
NR .166**
0.000
H0 Reject Reject Accept Reject Accept Reject
H1 Accept Accept Reject Accept Reject Accept
SI3 -
.172**
0.000
NR 0.096*
0.043
-
.120*
0.011
-
.095*
0.044
.187**
0.000
H0 Reject Accept Reject Reject Reject Reject
H1 Accept Reject Accept Accept Accept Accept
SI4 NR NR NR NR NR .201**
0.000
H0 Accept Accept Accept Accept Accept Reject
H1 Reject Reject Reject Reject Reject Accept
SI5 NR NR -
.107*
0.024
NR NR .109*
0.022
H0 Accept Accept Reject Accept Accept Reject
H1 Reject Reject Accept Reject Reject Accept
SI6 NR NR NR -
.110
0.020
NR .215**
0.000
H0 Accept Accept Accept Reject Accept Reject
H1 Reject Reject Reject Accept Reject Accept
SI7 -
.136**
0.004
NR .099*
0.037
-
.114*
0.016
NR NR
H0 Reject Accept Reject Reject Accept Accept
H1 Accept Reject Accept Accept Reject Reject
SI8 NR NR NR -
.094*
0.047
NR .132**
0.005
H0 Accept Accept Accept Reject Accept Reject
H1 Reject Reject Reject Accept Reject Accept
After the result of validity and reliability test valid
and consistent, the following process performed Bi-
variate Correlation calculation. As the backdrop, the
process will produce a Pearson Correlation (r) score
and the indicator sign. The relationship between fac-
tors is gained by seeing the indicator sign. If the in-
dicator signs are lower than 0.05, it means there is
a relationship between factor. Meanwhile, there is
no relationship between factors if the indicator sign
is greater than 0.05. The hypothesis result described
that there is a relationship if H0 is rejected and H1
is accepted; no relationship if H0 is accepted and H1
is rejected. Table 5 shows the detail of the Bivariate
Correlation and hypothesis result.
Explanation of the Bivariate correlation result is
elaborated as follow. The obtained factors have a re-
lationship
Grade point (D1) has a negative correlation with
”friends influence me to use social media to im-
prove academic performance” (SI1). It means that the
greater influence from friends to use social media to
improve academic performance, the lower grade point
is gained. Table 6 informed the level of relationship
strength.
Grade point (D1) has a negative relationship with
”family influence me to use social media to improve
academic performance” (SI2). It indicates that the
greater influence from family influence to use social
media to improve academic performance, the lower
grade point is received.
Grade point (D1) has a negative relationship with
”friends think that I must use social media to learn”
(SI3). It reveals that the greater influence from friend
think that I have to use social media to learn, the lower
grade point is acquired.
Grade point (D1) has a negative relationship with
”lecture activities allow me to use social media to find
information” (SI6). It signifies that the greater influ-
ence from lecture activities allow me to use social me-
dia to find information (SI6), the lower grade point is
gained.
Gender (D2) has a relationship with ”friends in-
fluence me to use social media to improve academic
performance” (SI1). It directs that the male has more
influence to use social media to improve academic
performance. On the other side, the female has less
influence to use social media to improve academic
performance.
Gender (D2) has a relationship with ”family in-
fluence me to use social media to improve academic
performance” (SI2). It implies that male has more
family influence to use social media to improve aca-
demic performance, but the female has less family in-
fluence to use social media to improve academic per-
formance.
Strata (D3) has a relationship with ”friends influ-
ence me to use social media to improve academic per-
formance” (SI1). It suggests that the higher strata
have a stronger influence on the student to use social
media and improve academic performance. However,
the lower strata have less influence to use social me-
dia to improve academic performance. Strata(D3) has
a relationship with ”friends think that I must use so-
CONRIST 2019 - International Conferences on Information System and Technology
188

cial media to study” (SI3). It describes that the higher
strata have more influence on using social media to
study; however, the lower strata have less influence
on the necessity of using social media to study.
Strata (D3) has a negative relationship with ”the
campus environment provides facilities and allows to
use of social media in lectures (SI5). It means that
the higher strata have less influence for a campus en-
vironment that provides facilities and allows the stu-
dent to use social media in lectures. However, the
lower strata have more influence on the campus envi-
ronment in providing facilities and allowing the stu-
dent to use social media in lectures.
Strata (D3) has a relationship with ”families rec-
ommend using smartphones for learning ”(SI7). It
stated that the higher strata have more influence that
families recommend using smartphones for learning.
However, the lower strata have less influence that
families recommend using a smartphone for learning.
Semester (D4) has a negative relationship with
”family influence me to use social media to improve
academic performance” (SI2). It leads that the lower
semester has more influence on the family to use
social media in improving academic performance.
However, the higher semester has less influence on
the family to use social media in improving academic
performance.
Semester (D4) has a negative relationship with
”friends think that I must use social media to learn”
(SI3). It means that the higher semester has less influ-
ence on ”friends think that I must use social media to
learn”. However, the lower semester has more influ-
ence on ”.
Semester (D4) has a negative relationship with
”lecture activities allow me to use social media to find
information” (SI6). It means that the higher semester
has less influence to ”lecture activities allow to use so-
cial media to find information”. However, the lower
semester has more influence to ”lecture activities al-
low to use social media to find information”.
Semester (D4) has a negative relationship with
”families recommend using smartphones for learn-
ing” (SI7). It means the higher semester have less
family influence to recommend using smartphones for
learning. However, the lower semester has more fam-
ily influence to recommend using smartphones for
learning.
Semester (D4) has a negative relationship with
”friends recommend using a smartphone for learning”
(SI8). It means that the higher semester has less friend
recommend using a smartphone for learning. How-
ever, the lower semester has more friend recommend
using a smartphone for learning.
Age (D5) has a negative relationship with ”friends
influence me to use social media to improve academic
performance” (SI1). It means that the older age has
less friend influence on using social media to improve
academic performance. However, the younger age
has more friend influence on using social media to
improve academic performance.
Age (D5) has a negative relationship with ”friends
think that I must use social media to learn ”(SI3). It
means that the younger age has more friend influence
on using social media to learn. However, the older
age has less friend influence on using social media to
learn.
Time spent on social media (D6) has a relation-
ship with ”friends influence me to use social media to
improve academic performance ”(SI1). It means that
the longer time spent on social media, the more friend
influences a student on using social media to improve
academic performance and vice versa.
Time spent on social media (D6) has a relation-
ship with ”family influence me to use social media to
improve academic performance ”(SI2). It means that
the longer time spent on social media has more fam-
ily influence on using social media to improve aca-
demic performance. However, the shorter time spent
on social media has less family influence to use social
media to improve academic performance.
Time spent on social media (D6) has a relation-
ship with ”friends think that I must use social media
to learn” (SI3). It indicates that the longer time spent
on social media, it has more influence on a friend that
think I must use social media to learn.
However, the shorter time spent on social media,
it has less influence on a friend that think I must use
social media to learn.
Time spent on social media (D6) has a relation-
ship with ”the campus environment that encouraged
me to use the smartphone to complete my assign-
ment” (SI4). It reflects that the longer time spent
on social media has more influence on-campus en-
vironment that encourages the student on using the
smartphone to complete the assignment. However,
the shorter time spent on social media, it has less in-
fluence on the campus environment that encourages
the student on using the smartphone to complete the
assignment.
Time spent on social media (D6) has a relationship
with ”the campus environment that provides facilities
and allows to use of social media in lectures ”(SI5).
In this line, the longer time spent on social media has
more influence on-campus environment that provides
facilities and allows the student to use of social media
in lectures. Meanwhile, the shorter time spent on so-
cial media has less influence on-campus environment
provides facilities and allows the student to use of so-
Analysis of the Student Background and Social Influence for Social Media-based Learning
189

cial media in lectures.
Time spent on social media (D6) has a relationship
with ”lecture activities allow me to use social media
to find information” (SI6). It denotes that the longer
time spent on social media has more influence on”
lecture activities allow to use social media to find in-
formation.” However, the shorter time spent for social
media has less impact on lecture activities allow to
use social media to find information.
Time spent on social media (D6) has a relation-
ship with friends recommend using a smartphone for
learning (SI8). It means that the longer time spent
on social media has more influence on friends recom-
mend using a smartphone for learning.
However, the shorter time spent on social media
has less impact on friends recommend using a smart-
phone for learning
3.4 Strength Tension of the Relationship
Table 6: Strength Relationship
No Relation |r| |r|
2
Tension Strength
%
1 D1 – SI1 .182 0.033 Small 3.3%
2 D1 – SI2 .244 0.060 Small 6.0%
3 D1 – SI3 .172 0.030 Small 3.0%
4 D1 – SI7 .136 0.018 Small 1.8%
5 D2 – SI1 .136 0.018 Small 1.8%
6 D2 – SI2 .118 0.014 Small 1.4%
7 D3 – SI1 .100 0.01 Small 1.0%
8 D3 – SI3 .096 Not
De-
fined
9 D3 – SI5 .107 0.011 Small 1.1%
10 D3 – SI7 .099 Not
De-
fined
11 D4 – SI2 .154 0.024 Small 2.4%
12 D4 – SI3 .120 0.014 Small 1.4%
13 D4 – SI6 .110 0.012 Small 1.2%
14 D4 – SI7 .114 0.013 Small 1.3%
15 D4 – SI8 .094 Not
De-
fined
16 D5 – SI1 .131 0.017 Small 1.7%
17 D5 – SI3 .095 Not
De-
fined
18 D6 – SI1 .229 0.052 Small 5.2%
19 D6 – SI2 .166 0.028 Small 2.8%
20 D6 – SI3 .187 0.035 Small 3.5%
21 D6 – SI4 .201 0.040 Small 4.0%
22 D6 – SI5 .109 0.012 Small 1.2%
23 D6 – SI6 .215 0.046 Small 4.6%
24 D6 – SI8 .132 0.017 Small 1.7%
The strength tension of a relationship can be mea-
sured by checking the absolute (r) of the Pearson cor-
relation. At the same point, the square of absolute (r)
of Pearson correlation will show how significant the
percentage of influence among a factor with another
one. Table 6 presented the detail of the influence of a
factor with another factor.
The explanation of table V elaborates the follow-
ing information:
Grade point (D1) will influence 3.3% to the friend
influence to use of social media to improve academic
performance (SI1), it means the friend influence to
use social media to learn influence 3.3% to get higher
university student grade point.
Grade point (D1) will influence 6.0% to the family
influence to use of social media to improve academic
performance (SI2), it means the family influence to
use social media for learning will influence 6.0% to
get higher university student grade point.
Grade point (D1) will influence 3.0% to friends
think that a university student must use social media
to learn (SI3). It means the friend think that a uni-
versity student must use social media to learn will in-
fluence 3.0% to get higher university student’s grade
point.
Grade point (D1) will influence 1.8% to lecture
activities allow me to use social media to find infor-
mation (SI6). It means the lecture activities that will
enable university student to use social media to find
information will influence 1.8% to get higher univer-
sity student’s grade point.
Gender (D2) will influence 1.8% to friends influ-
ence me to use social media to improve academic per-
formance (SI1).
Gender (D2) will influence 1.4% to family influ-
ence me to use social media to improve academic per-
formance (SI2). It means the family influence to use
social media to improve academic performance will
influence 1.4% for male university student.
Strata (D3) will influence 1.0% to ”friends in-
fluence me to use social media to improve aca-
demic performance” (SI1), it means the friend influ-
ence to use social media to improve academic per-
formance will influence 1.0% to the higher strata
(Bachelor/Master/Ph.D.) rather than for senior high,
diploma.
Strata (D3) will influence 1.1% to ”the campus en-
CONRIST 2019 - International Conferences on Information System and Technology
190

vironment provides facilities and allows to use of so-
cial media in lectures” (SI5). It means the campus
environment provided facilities and allow to use so-
cial media in lecturing will influence 1.1higher strata
(Bachelor/Master/Ph.D.) rather than for senior high,
diploma.
Semester (D4) will influence 2.4% to ”use social
media to improve academic performance” (SI2). It
means the social media used to improve academic
performance will affect 2.4% to the higher semester
university student.
Semester (D4) will influence 1.4% to ”friends
think that I must use social media to learn” (SI3). It
means the friend think that I must use social media to
learn will influence 1.4% to the higher semester uni-
versity student.
Semester (D4) will influence 1.2% to ”lecture ac-
tivities allow me to use social media to find informa-
tion” (SI6). It means the lecture activities that allow
student to use social media to find information will in-
fluence 1.2% to higher semester of university student.
Semester (D4) will influence 1.3% to ”families
recommend using smartphones for learning” (SI7). It
means the families recommend using smartphone for
learning will influence 1.3% for higher semester of
university student.
Age (D5) will influence 1.7% to ”friends influence
me to use social media to improve academic perfor-
mance” (SI1).
Time spent on social media (D6) will influence
5.2% to ”friends influence me to use social media to
improve academic performance” (SI1).
Time spent for social media (D6) will influence
2.6% to ”family influence me to use social media to
improve academic performance” (SI2). Time spent
on social media (D6) will influence 3.5% to ”friends
think that I must use social media to learn” (SI3).
Time spent on social media (D6) will influence
4.0% to ”campus environment encouraged me to use
the smartphone to complete my assignment” (SI4).
Time spent on social media (D6) will influence 1.5%
to ”the campus environment provides facilities and al-
lows to use of social media in lectures” (SI5). Time
spent on social media (D6) will influence 4.6% to
”lecture activities allow me to use social media to find
information” (SI6).
Time spent on social media (D6) will influence
1.7% to ”friends recommend using a smartphone for
learning” (SI8).
4 CONCLUSIONS
This study addressed the hypotheses of university stu-
dent background and social influence of social me-
dia learning-based. The in-depth examination has re-
vealed that the six-university student’s background
and grade point has a relationship and influence on
social influence factor. In this corridor, gender in-
fluences social influence; strata influence social in-
fluence; the semester has an influence on social in-
fluence, age has an influence on social influence and
time spent to use social media also has an influence
on social influence eventually. Taking into account all
these facts, the researchers strongly believe that social
media plays an important role in promoting university
student learning at the end.
This study required future research to elaborate
another related factor such as ease of use factor, per-
ceive usefulness factor, and risk factor.
ACKNOWLEDGEMENTS
Thanks to Dhyaksa Abi Satrio, Rizki Adha and Irfan
Nurfauzi who contribute to collect the respondent for
this paper and this paper is part of the final project of
Abi, Rizki, and Irfan to get their bachelor’s degree.
REFERENCES
Abbas, J., Aman, J., Nurunnabi, M., and Bano, S.
(2019). The impact of social media on learning be-
havior for sustainable education: evidence of students
from selected universities in pakistan. Sustainability,
11(6):1683.
Acarli, D. S. and Sa
˘
glam, Y. (2015). Investigation of pre-
service teachers’ intentions to use of social media in
teaching activities within the framework of technol-
ogy acceptance model. Procedia-Social and Behav-
ioral Sciences, 176(20):709–713.
APJII (2018). Buletin apjii edisi 23 - april 2018.
Balakrishnan, V. and Gan, C. L. (2016). Students’ learn-
ing styles and their effects on the use of social media
technology for learning. Telematics and Informatics,
33(3):808–821.
Businessdictionary (2019). What is causal research? defi-
nition and meaning - businessdictionary.com.
Deaton, S. (2015). Social learning theory in the age of so-
cial media: Implications for educational practitioners.
Journal of Educational Technology, 12(1):1–6.
Faizi, R., El Afia, A., and Chiheb, R. (2013). Exploring
the potential benefits of using social media in educa-
tion. International Journal of Engineering Pedagogy
(iJEP), 3(4):50–53.
Analysis of the Student Background and Social Influence for Social Media-based Learning
191

Gikas, J. and Grant, M. M. (2013). Mobile computing
devices in higher education: Student perspectives on
learning with cellphones, smartphones & social me-
dia. The Internet and Higher Education, 19:18–26.
IBM (2019). Bivariate correlations.
Lahiri, M. and Moseley, J. L. (2015). Learning by going so-
cial: Do we really learn from social media? Interna-
tional Journal of Learning, Teaching and Educational
Research, 11(2).
Ltd, D. R. (2006). What is causal research?
Manca, S. and Ranieri, M. (2016). “yes for sharing, no for
teaching!”: Social media in academic practices. The
Internet and Higher Education, 29:63–74.
Surjandy, J. (2016). Is social media used as social activities
or academic activities? In Proceedia. International
Conference on Information Management and Technol-
ogy (ICIMTech), pages 130–134.
Tanty, O. e. a. (2017). The influence of social media to sup-
port learning process in higher education institution:
A survey perspective.
UCLA (2019). What does cronbach’s alpha mean?
Yeager, K. (2019). Libguides: Spss tutorials: pearson cor-
relation.
CONRIST 2019 - International Conferences on Information System and Technology
192
