
Educational Data Mining in Graduation Rate and Grade Predictions
Utilizing Hybrid Decision Tree and Na
¨
ıve Bayes Classifier
La Ode Mohamad Zulfiqar
1
, Nurul Renaningtias
1
and M. Yoka Fathoni
1
1
Informatics Engineering of Politeknik Harapan Bersama Tegal, Indonesia
Keywords:
Educational Data Mining, Hybrid Decision Tree, the Na
¨
ıve Bayes Classifier, Prediction, Grade, Rate,
Graduation.
Abstract:
The use of Educational Data Mining (EDM) in educational context has the probability to frame the extant
models of teaching and learning by affording new solutions to the interaction problem. An educational do-
main like student related prediction become so essential in the higher learning institutions since it able to be
presenting the rate of the students’ graduations. Through prediction, data is analyzing and able to afford big
picture of trends and patterns for the management of the higher educations. Through this paper research we
are presenting the utilization of the hybrid decision tree combined with the na
¨
ıve Bayes classifier. The result
showing the accuracy of prediction for graduation rate and graduation grade is 72.73% on the highest value
partition.
1 INTRODUCTION
An advancement of focus in Artificial Intelligence
boosted the improvement of data mining and analytic
in the didactic sphere (Bhatia, 2019). Extracting the
new aspects and patterns from huge data set applying
the methods such as machine learning, statistics, and
database systems is the data mining definition process
(Sowmya and Suneetha, 2017). The main aim of data
mining process is finding the recognizable and pos-
sibly advantageous information from abundant num-
bers of data sets (Lefebvre et al., 2016).
A special data mining field for techniques, tools,
and researches that utilized to gain information from
educational records, known as Educational Data Min-
ing (EDM). An EDM works to represent the imple-
mentation of data mining in all educational sectors.
They generate an environ that able to successively
amass, handle, report and manage on digital data re-
peatedly in order to enhance the educational process.
The use of EDM in educational context has the prob-
ability to frame the extant models of teaching and
learning by affording new solutions to the interac-
tion problem (Berland et al., 2014). Data mining has
many methods according to its purposes and goals.
In the EDM itself, the common problems to solve
are analyzing the dropping out or retention analysis
(Pradeep et al., 2015), virtual learning objects and vir-
tual learning environment (Dutt et al., 2015), perfor-
mance and student evaluation (Shukor et al., 2015),
generation of educational recommendations (Chalaris
et al., 2014), learning pattern identification (Mayilva-
ganan and Kalpanadevi, 2015), students pattern iden-
tification (Campagni et al., 2015), and students related
prediction (Kaur et al., 2015).
Considering the EDM educational domains, the
learning pattern identification indeed has the high-
est research interest among the others educational do-
mains (Manjarres et al., 2018). However, it does not
mean that others domain is not as important as learn-
ing pattern identification. Each domain lists have its
own importance in accordance with the conditions of
the research object. About the quantity of research
conducted on a specific domain, is not a benchmark
for the quality of a particular domain. An educational
domain like student related prediction become so es-
sential in the higher learning institutions since it able
to be presenting the rate of the students’ graduations
(Kaur et al., 2015).
The prediction of rate graduation for students is
important since today’s education domain challenges
are to provide positive experience for students, start
from enrollment till graduation then beyond. Through
prediction, data is analyzing and able to afford big
picture of trends and patterns for the management of
the higher educations. Hence, they can be evaluating
and streamlining processes to create efficiencies, and
boost the overall student experience (Mishra et al.,
2014). Realizing that target, an appropriate data min-
ing technique needs to be implemented solving the
prediction of graduation rate for students.
By all of techniques in determine the educa-
Zulfiqar, L., Renaningtias, N. and Fathoni, M.
Educational Data Mining in Graduation Rate and Grade Predictions Utilizing Hybrid Decision Tree and Naïve Bayes Classifier.
DOI: 10.5220/0009907101510157
In Proceedings of the International Conferences on Information System and Technology (CONRIST 2019), pages 151-157
ISBN: 978-989-758-453-4
Copyright
c
2020 by SCITEPRESS – Science and Technology Publications, Lda. All rights reserved
151

tional domains, especially for students related predic-
tion (Patarapichayatham et al., 2012), the techniques
such decision tree (Shukor et al., 2015), classification
(Kaur et al., 2015), clustering (Dutt et al., 2015), se-
quential patterns (Campagni et al., 2015), bayesian
networks (Sundar, 2013), neural networks (Shahiri
et al., 2015), association rules (Belsis et al., 2014),
and linear regression (Thai-Nghe et al., 2010) are fa-
miliars methods that utilizing on inspecting student
related prediction.
The decision tree method creating the rule accord-
ing to obtain fact. It is authoritative and eminent clas-
sification method as it has immense precision compu-
tational. However, the high accuracy of decision tree,
impacting the more time-consuming process then an-
other method like na
¨
ıve bayes. The na
¨
ıve bayes itself
is the technique of elementary probability classifica-
tion. It is predicting the future value according to the
previous value (Farid et al., 2014).
The collaboration between the high accuracy of
decision tree and the simplicity of na
¨
ıve bayes to be
implemented in the EDM is the work on this research.
The educational domain as a research object is pre-
dicting graduation rate and predicate of the students.
The result of this study aiming to help educational
management process and improve the quality of solu-
tions and the policies on the pedagogical implemen-
tation.
2 METHODS
2.1 Decision Tree
Decision tree is a popular classification method as it
easy to interpreted. It is utilized for statistical pat-
tern recognition. A decision tree has each mode that
represents an attribute, to represent the decision it has
branch, then to draw categorical it has leaf (Shahiri
et al., 2015).
The main idea of decision tree is generating a
tree that provides whole data and processes with an
outcome at each leaf. Generating the decision tree
method, these steps below is implemented:
• Tree construction
• Tree pruning (pre-pruning, post-pruning)
• Rule decision generated
2.2 C4.5 Algorithm
According to the availability of data trains, the C4.5
algorithm is applied. This algorithm is the advance-
ment of ID3 algorithm. Some of developments done
in C4.5 are handling problems of ID3 algorithm such
the missing value, continue data, and training (Farid
et al., 2014). The main steps of C4.5 algorithm is de-
scribed as follows.
• Decide the attribute as root node and the attribute
as next node. Root node is the attribute with the
highest gain ratio (see equation 1).
gain(S, A) = entrophy(S) − Σ
n
i−1
|Si|
|S|
∗ Et (1)
• Compute the value of entropy (see equation 2).
Entrophy(S) = Σ
k
i=1
− p
i
∗ log
2
P
i
(2)
• Compute the information split (see equation 3).
SplitIn f o(S, A) = −Σ
n
i=1
S
i
S
log
2
S
i
S
(3)
• Compute the ratio gain (see equation 4).
GainRatio(S, A) =
Gain(S, A)
SplitIn f o(S, A)
(4)
2.3 Naive Bayes Classifier
In terms of accuracy and the efficiency of calculation
on documents classification, the na
¨
ıve bayes classifi-
cation method is considered conceivably better mea-
sure with the other classification methods. Assuming
all attributes in a dataset are separates, then it able to
predict the future values based on pass values, it is
the simplicity of na
¨
ıve bayes classification technique
(Sundar, 2013).
The advantage of na
¨
ıve bayes technique is non
timeconsuming data computation. It is enhancing the
classification performance through throwing unneces-
sary attributes. However, this technique if compares
with the other techniques of classification has poorer
accuracy in some dataset (Renaningtias et al., ).
The formulation applying in na
¨
ıve bayes is ac-
cording to the bayes theory, describes as follows (see
equation 5).
P(C
i
|X) =
P(C
i
|X)P(C
i
)
p(X)
(5)
To generate prediction utilizing the na
¨
ıve bayes
classifier technique, the steps is done as follows.
• Data transform into variables which each data rep-
resent by attributes of vectors with dimension of
X=X1,X2, . . . , Xn.
• For class i, as C1, C2, . . . Cn are given data X to
classify and predict if X is on the highest posterior
group. In another word X to on C if P(Ci) > P(Cj)
CONRIST 2019 - International Conferences on Information System and Technology
152

• For constant P(X) if P(X—Ci) P(Ci) then calcu-
lated If probability is unknown then assumed class
is the same, such as: P(C1)=P(C2)=. . . =P(Cn),
compute P(X—Ci) and P(X—Ci)P(Ci).
• Reducing the unnecessary attributes of P(X—Ci),
utilizing the equation 6.
P(X|C
i
) =
n
∏
k=1
p(x
k
|C
i
) = P(x
1
|C
i
) (6)
• P(X—Ci)P(Ci) is analyzed on every Ci to result
the classification prediction from X. Equation 7 is
used for handle this calculation.
PXCi), PCi > PXC j), PC j, f or1 ≤ j (7)
The number of identical classes or labels on data
are calculated, then it is the same as identical
cases with same classes. According to its result,
all class in same attributes is multiplied. Those
result is showing prediction result of na
¨
ıve bayes
classification.
2.4 Hybrid Decision Tree and Na
¨
ıve
Bayes Classifier
Hybrid decision tree is established from C4.5 algo-
rithm. The dataset for training is given as, D = {x1,
x2, . . . , xn} each training item is expressed as {A1,
A2, . . . , An}. For every attribute Ai, it is filling with
the attribute values {Ai1, Ai2, . . . , Ain}. The data use
as a training data are fitting to set of classes C = {C1,
C2, . . . , Cm}.
In the generating the decision tree application,
there are couple main steps as describe below.
• Builds training dataset, D
Generating the decision tree, first is selecting the
best splitting attribute with the maximum infor-
mation gain value as the root node of the tree. Af-
ter that, adding the child node and its arcs to the
decision tree. The whole process is going on loop-
ing through adding new subtrees to any branching
of the arc. It is end for the instance in the reduced
training set all belong to the same class. Then it
labeling the corresponding leaf node.
• Builds decision making according to the decision
tree.
Na
¨
ıve Bayes classifier is utilizing to classify every
training instance, xi ∈ D. Computing a previous
probability, P(Ci), for every class, Ci ∈ D and the
probability class of conditional P(Aij—Ci). Af-
ter that any training instance is calculated utiliz-
ing the probability, which the training instance is,
xi ∈ D. For selecting the class Ci, it is accordance
with the highest posterior probability, P(Ci—Xi).
3 RESEARCH’S MATERIALS
On this research, the data that is utilized from De-
partment of Communication, Universitas Bengkulu.
Its data are the students’ academic data, such as
Grade Point Average (GPA), college entrance exam-
ination paths (through: SBMPTN (local selection),
SNMPTN (national selection), PPA (academic selec-
tion), SPMU (invitation)), high school origin, major
in high school, domicile, gender, scholarship, status,
study duration, and graduation predicate. The total
data is collected as 215 datasets, to be used for the
data train.
4 PROCEDURES OF THE
RESEARCH
Projects in data mining are done systematically. Ac-
cording to the best practice, researchers and practices
on data mining are proposed some simple workflows
to develop the success chance of working on data min-
ing projects. A process that decided as a standard for
data mining project is the Cross-Industry Standard for
Data Mining (CRISP-DM).
On this study we are utilizing this popular CRISP-
DM as the standard procedures on our research. Its
steps are working as follows.
4.1 Data Cleanup and Integration
On this phase, the raw data that may have want-
ing records, noises, outliers and inconsistent data are
cleaned to get missing values, data smoothness, find-
ing outliers and fix inconsistency.
After data-cleaning complete, then its data are
mixed with multi and various resources into one con-
sistent data store, such as data warehouse. It is possi-
ble to data have some databases, files or data cubes.
4.2 Data Selection
Data selection on this phase is worked to decrease the
number of redundant or irrelevant data.
4.3 Data Transformation
Done with the selection process then its time to trans-
form the data into appropriate format that we utilized
on this research. Our format of the data training, are
describe below (see Figure 1).
Educational Data Mining in Graduation Rate and Grade Predictions Utilizing Hybrid Decision Tree and Naïve Bayes Classifier
153
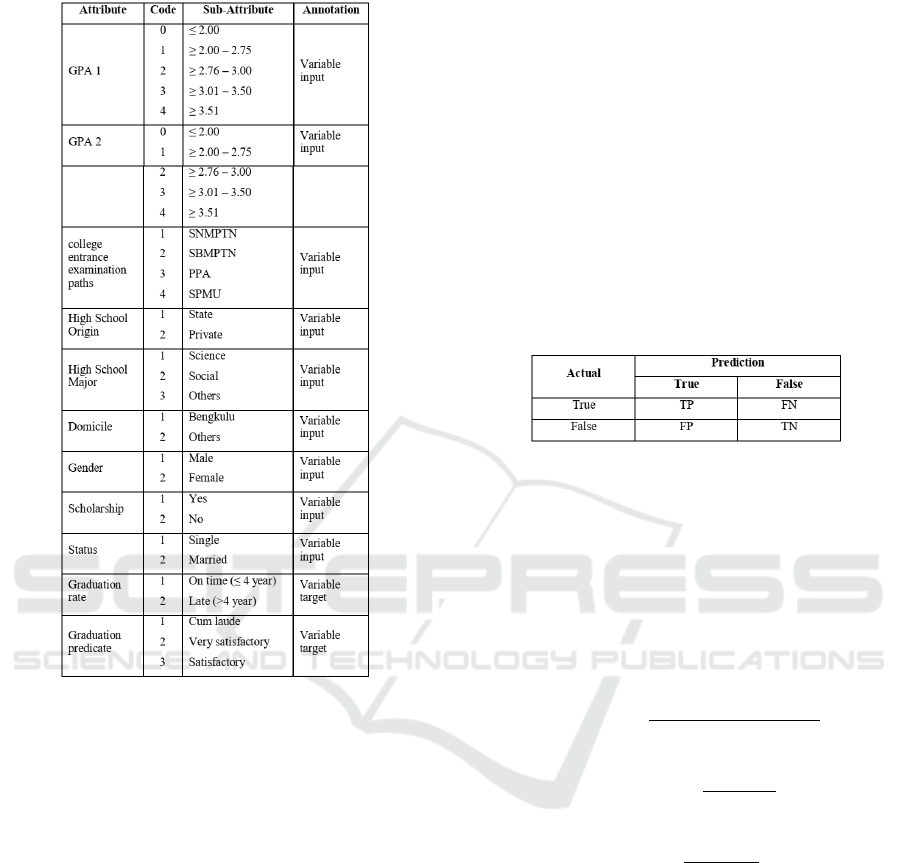
space
Figure 1: Attributes of data training.
4.4 Mining Process
The mining process is applied to create model that
used for label of the new class. Through this research
there are two classes formed, which are study duration
and graduation predicate.
Decision tree is resulting the leaf that is containing
opportunities of every class and attribute to be pre-
dicted as it seen in Figure 1. In further, the mining
process is finding the entropy value, information gain,
split information, and gain ratio in order to get the root
node of the decision tree. To done those process, the
computational can be seen in the equation 1 to 4. The
root of the tree will be the highest value of the gain
ratio. Later after root node is generated, internal node
and leaf node is searched utilizing the same calcula-
tion as calculating the root node. Formed leaf nodes
is containing the na
¨
ıve bayes classifier. The result of
the whole process that applying this hybrid decision
tree and na
¨
ıve bayes classifier is able to predict the
duration rate of study and the graduation grade of the
students.
4.5 Pattern Evaluation
Testing is done in this stage, which the performance
of mining process is calculated. Confusion matrix
is the method that is utilized for evaluate and vali-
date the mining process. Confusion matrix contains
amount of test record assembling on the table to pre-
dict the correctness or incorrectness (Renaningtias
et al., ). The calculation performance model is based
on the values of True Positive (TP), True Negative
(TN), False Positive (FP) and False Negative (FN).
The form of the confusion matrix is shown in Figure
2.
Figure 2: Table type styles.
Accuracy, precision and recall are calculated on
the confusion matrix. The accuracy of the system on
classify the data correctly is formulated utilizing the
equation 8. For the amount of data that classified pos-
itively is calculated using equation 9. Then for the
recall, it is presenting the percentage of positive cate-
gory on the result of classification by the systems (see
equation 10).
accuracy =
T P + T N
T P + T N + FP + FN
(8)
precission =
T P
T P + FP
(9)
recall =
T P
T P + FN
(10)
5 RESULT AND DISCUSSION
The utilized data is the data that already completing
the process of cleaning and transforming. As ex-
plained in the research procedure, the data cleansing
is worked for erase insufficient data, then data trans-
formation is for converting the data to the appropriate
format. Mining process is done using hybrid deci-
sion tree and na
¨
ıve bayes classification techniques to
produce prediction for both graduation rate and grad-
uation predicate of the students. Hence, as it shown
in Table 1, are the attributes utilizing on this research.
CONRIST 2019 - International Conferences on Information System and Technology
154
5.1 Prediction of Graduation Rate
Class categories on this research to predict the study
duration rate are on time and late. It is “on time” when
students show they can graduate on 4 years. However,
when its more than 4 years, it will be categorized as
late.
Through this research, the performance of hybrid
decision tree using C4.5 algorithm and na
¨
ıve bayes
classifier technique calculate according to arrange-
ment of data partitions of 70%, 80%, and 90%. Its
techniques is able to determine the most core attribute
in the prediction process through the calculation of
entropy (equation 2), ratio gain (equation 4), informa-
tion gain (equation 1) and split information (equation
3). Then for the na
¨
ıve bayes calculation it uses the
equation 5 to 7. The whole result of prediction stu-
dent rate of study duration is shown on the Figure 3
to Figure 6.
Figure 3: Data partitions.
Figure 4: Attribute values of graduation rate.
In the Figure 3, it is seen that the 215 dataset is
divided into 2 class labels with each class show the
value of the class based on the partition values. C4.5
algorithm is implemented to work on the calculation
of its partition, then it is resulting the value as it shows
in Figure 4. There is a rule following the calculation
on C4.5 algorithm, which its rules are describe in the
Figure 5. When the rules are already formed, the ex-
isting probability on each rule then calculates utilizing
the na
¨
ıve bayes classifier algorithm. The result of the
calculation is performed on the Figure 6.
space
Figure 5: Prediction of graduation rate rules.
Figure 6: Confussion matrix of graduation rate.
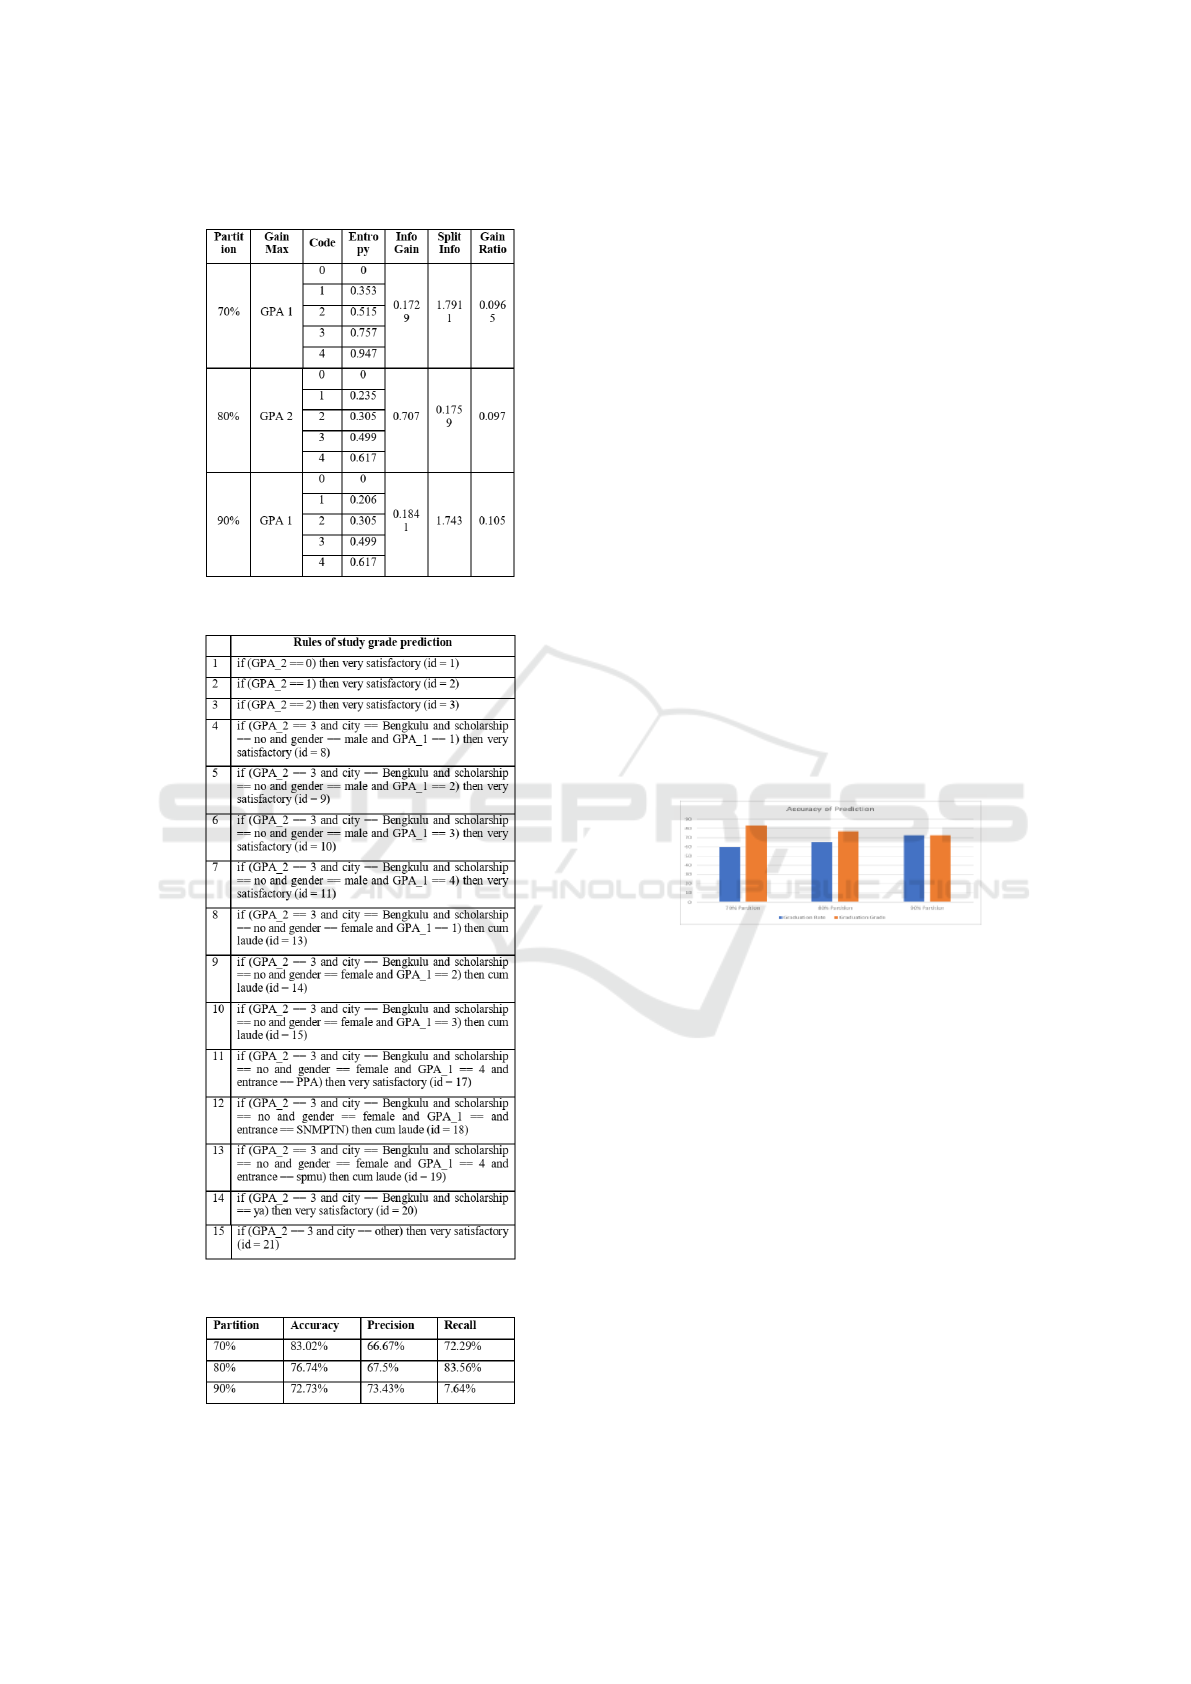
5.2 Prediction of Graduation Predicate
There are three class categories for prediction gradua-
tion predicates, such as: cum laude, very satisfactory,
and satisfactory. The steps of predicting the gradua-
tion predicate is as same as the process of prediction
graduation rate.
First, the partition data is created into 70%, 80%
and 90%. Then its partitioned data are calculated uti-
lizing the equation 1 to 4, then it is resulting the val-
ues as presented on the Figure 7. After that, C4.5 and
na
¨
ıve bayes classifier are operated to result a predic-
tion value (shown in Figure 9), based on the rules that
created (shown in Figure 8).
Educational Data Mining in Graduation Rate and Grade Predictions Utilizing Hybrid Decision Tree and Naïve Bayes Classifier
155
space
Figure 7: Attribute values of graduation rate.
Figure 8: Prediction of graduation grade.
Figure 9: Prediction of graduation grade.
From the examination result of prediction that is
utilizing the confusion matrix, besides showing the
accuracy value, it also presents the precision value
and the recall value. Nevertheless, in the discussion of
this research we are just focusing of the value of the
accuracy since accuracy is the most important point
of prediction.
As it shown on Figure 10, when we are compar-
ing between the accuracy of prediction from gradua-
tion grade and graduation rate, we figure out that the
higher value of partition the higher chance of the sta-
bility accuracy of the data is obtained. As the data par-
tition is 70%, the difference percentage between result
of graduation grade and rate prediction is 23.02%. It
is reduced when the data partition is added 10% more,
become 80%, the result shows that the range of differ-
ence is 11.02%. The difference evolves into 0% when
the partition is 90%.
Moreover, with the stability of the result from pre-
dicting both graduation grade and graduation rate,
then this method able to assist the management on
the educational domain to make a better solution for
implemented on the pedagogical process. Hence, the
graduation target, both for quantity and quality of
the graduate students able to be boosted in the better
value.
Figure 10: Comparisson of accuracy prediction
6 CONCLUSIONS
In this paper, we are presenting the utilization of the
hybrid decision tree combined with the na
¨
ıve bayes
classifier. Our objectives on this research are all
achieved. First, we are able to implementing the
combination of na
¨
ıve bayes with hybrid decision tree
to make prediction of graduation grade and gradua-
tion rate. Which its result, the accuracy of prediction
for graduation rate and graduation grade is 72.73%
on the highest value partition, its 90%. Secondly,
we are proved that, the higher value of the partition
that applied on the collaboration hybrid decision tree
and na
¨
ıve bayes classification the higher consistency
value of its accuracy gained.
CONRIST 2019 - International Conferences on Information System and Technology
156

REFERENCES
Belsis, P., Chalaris, I., Chalaris, M., Skourlas, C., and Tso-
lakidis, A. (2014). The analysis of the length of stud-
ies in higher education based on clustering and the
extraction of association rules. Procedia-Social and
Behavioral Sciences, 147:567–575.
Berland, M., Baker, R. S., and Blikstein, P. (2014). Edu-
cational data mining and learning analytics: Applica-
tions to constructionist research. Technology, Knowl-
edge and Learning, 19(1-2):205–220.
Bhatia, P. (2019). Data Mining and Data Warehousing:
Principles and Practical Techniques. Cambridge Uni-
versity Press.
Campagni, R., Merlini, D., Sprugnoli, R., and Verri, M. C.
(2015). Data mining models for student careers. Ex-
pert Systems with Applications, 42(13):5508–5521.
Chalaris, M., Gritzalis, S., Maragoudakis, M.,
Sgouropoulou, C., and Tsolakidis, A. (2014).
Improving quality of educational processes provid-
ing new knowledge using data mining techniques.
Procedia-Social and Behavioral Sciences, 147:390–
397.
Dutt, A., Aghabozrgi, S., Ismail, M. A. B., and Mahroeian,
H. (2015). Clustering algorithms applied in educa-
tional data mining. International Journal of Informa-
tion and Electronics Engineering, 5(2):112.
Farid, D. M., Zhang, L., Rahman, C. M., Hossain, M. A.,
and Strachan, R. (2014). Hybrid decision tree and
na
¨
ıve bayes classifiers for multi-class classification
tasks. Expert systems with applications, 41(4):1937–
1946.
Kaur, P., Singh, M., and Josan, G. S. (2015). Classification
and prediction based data mining algorithms to predict
slow learners in education sector. Procedia Computer
Science, 57:500–508.
Lefebvre, W., Vurpillot, F., and Sauvage, X. (2016). Atom
Probe Tomography: Put Theory into Practice. Aca-
demic Press.
Manjarres, A. V., Sandoval, L. G. M., and Su
´
arez, M. S.
(2018). Data mining techniques applied in educational
environments: Literature review. Digital Education
Review, (33):235–266.
Mayilvaganan, M. and Kalpanadevi, D. (2015). Cognitive
skill analysis for students through problem solving
based on data mining techniques. Procedia Computer
Science, 47:62–75.
Mishra, T., Kumar, D., and Gupta, S. (2014). Mining
students’ data for prediction performance. In 2014
Fourth International Conference on Advanced Com-
puting & Communication Technologies, pages 255–
262. IEEE.
Patarapichayatham, C., Kamata, A., and Kanjanawasee,
S. (2012). Evaluation of model selection strategies
for cross-level two-way differential item functioning
analysis. Educational and Psychological Measure-
ment, 72(1):44–51.
Pradeep, A., Das, S., and Kizhekkethottam, J. J. (2015).
Students dropout factor prediction using edm tech-
niques. In 2015 International Conference on Soft-
Computing and Networks Security (ICSNS), pages 1–
7. IEEE.
Renaningtias, N., Suseno, J. E., and Gernowo, R. Hybrid
decision tree and na
¨
ıve bayes classifier for predict-
ing study period and predicate of student’s gradua-
tion. International Journal of Computer Applications,
975:8887.
Shahiri, A. M., Husain, W., et al. (2015). A review on pre-
dicting student’s performance using data mining tech-
niques. Procedia Computer Science, 72:414–422.
Shukor, N., Tasir, Z., and van der Meijden, H. (2015).
An examination of online learning effectiveness using
data mining.
Sowmya, R. and Suneetha, K. (2017). Data mining with
big data. In 2017 11th International Conference on
Intelligent Systems and Control (ISCO), pages 246–
250. IEEE.
Sundar, P. P. (2013). A comparative study for predicting stu-
dents academic performance using bayesian network
classifiers. IOSR Journal of Engineering (IOSRJEN)
e-ISSN, pages 2250–3021.
Thai-Nghe, N., Drumond, L., Krohn-Grimberghe, A., and
Schmidt-Thieme, L. (2010). Recommender system
for predicting student performance. Procedia Com-
puter Science, 1(2):2811–2819.
Educational Data Mining in Graduation Rate and Grade Predictions Utilizing Hybrid Decision Tree and Naïve Bayes Classifier
157
