
Filter IIR (Butterworth) and ICA
for Identifying Silent Chain’s Sound Characteristics
Rika Novita Wardhani, David Putra Yohast, Iqro Sari Tilawah
Politeknik Negeri Jakarta, Jurusan Teknik Elektro, Prodi Instrumentasi dan Kontrol Industri,
Jl Prof. DR. GA Siwabessy, Kampus Baru UI Depok 16425
Keywords: Butterworth, IIR, Filter, ICA, Independent Component Analysis, Silent Chain, Sound, Audio, Characteristics,
Separation, Frequency, Hz.
Abstract: X Company as a silent chain manufacturer has a problem identifying the silent chain’s sound characteristics
for comparison among other products. Sound characteristics of the silent chain consist of amplitude,
frequency, and sound pressure level (SPL). To attain sound characteristics, a filter that can separate the silent
chain’s audio among other components is needed. Two options that sprout are Butterworth Filter and also
ICA. The design of the Butterworth filter is based on identifying the pulse transfer function H(z) that satisfies
the requirements of the filter specification. ICA uses mathematical and statistical approaches to decompose
components in the observed data set. Singular Value Decomposition (SVD) model used in ICA. In application,
sound sources attained from test rig which is consists of a silent chain set (gear, silent chain, and a DC motor).
The filter program will be made in Matlab software with a time-domain plot and spectrogram as the outputs.
ICA and Butterworth filter can separate silent chain audio. Silent chain’s frequencies were ranged from 7000-
14000 Hz, and the motor’s frequencies are ranged from 0-1000 Hz. As a comparison, the Butterworth filter
can work better than ICA because it can minimize noise frequency cleaner and the silent chain's frequency
more visible.
1 INTRODUCTION
PT. X is a manufacturing company that produces
Silent chains. In its development, the chain is better
than the roller chain. The main advantage of the silent
chain is that the sound is quiet and able to operate at
a higher speed than the roller chain, which is currently
widely used in the industrial as a mechanical power
transfer. But, there is no data regarding the
characteristics of Silent chain sound, where the data
can be used as one of the ingredients for the
comparison of competitor products. In addition, the
determination of the characteristics of the silent chain
is inseparable from the basic reference to be used.
Determination of the sound characteristics
required for the silent chain, such as sound,
frequency, amplitude and sound pressure level
(GOYAL, 2018). To solve the problems, the authors
made a test rig design to simulate the sound of a silent
chain. But, there is a challenge in determining
characteristics of sound (Maulana & Andono, 2016),
which is the sound of a silent chain that has mixed up
with other components. So, filter the sound is needed
to get the actual silent chain’s sound characteristics
(Hansen, n.d.).
A digital filter IIR (Infinite Impulse Response)
with a Butterworth response and ICA (Independent
Component Analysis) filter used to analyze the
sound. And the A-weighted filter (A-weighted filter)
is used to provide a response that has a basic
international standard (SI). The filter is used to
improve signal quality, such as removing or reducing
noise, to retrieve information signals or to separate
two or more signals that were previously combined
(Lie, 2017).
A MATLAB program is used to process the sound
data with the output in the form of sound
characteristics of the silent chain (Mathworks, 2008).
Filtering with a digital filter IIR using the Butterworth
response is best used for audio signals because it has
a flat response in the passband and stopband (no
ripples). So in its use, this filter is able to produce a
better output signal. An ICA filter will be designed to
separate the silent chain sound from the motor.
Singular Value Decomposition (SVD) method is used
as ICA mathematical modeling. Namely determining
114
Wardhani, R., Yohast, D. and Tilawah, I.
Filter IIR (Butterworth) and ICA for Identifying Silent Chain’s Sound Characteristics.
DOI: 10.5220/0009906800002905
In Proceedings of the 8th Annual Southeast Asian International Seminar (ASAIS 2019), pages 114-119
ISBN: 978-989-758-468-8
Copyright
c
2022 by SCITEPRESS – Science and Technology Publications, Lda. All rights reserved
the rotation matrix, stretching matrix, and rotation to
minimize the gaussian properties. And the application
of A-weighting filter in determining the
characteristics of the silent chain sound is inseparable
from the sensitivity of the human ear, therefore the
output signal from the A-weighting filter has a
standard that is in accordance with the international
standard.
2 SOUND CHARACTERISTICS
Sound basically a wave. There are two types of wave
we commonly know. There are trasnversal, and the
other one is longitudinal. Sound is one of longitudinal
waves. As a longitudinal waves, there are
compressions and rarefactions. Compression is area
where you can find dense waves in one time. And
Rarefaction is area where you can find tenuous waves
in one time. The best three items to describe
soundwave are frequency, amplitude, and time-
period.
- Frequency : The best thing to describe
frequency is number of waves per time. Or
commonly, we called as number of waves per second.
- Amplitude : When you draw waves in 2D,
you can see normal line, and commonly there are
some point that have peak state (in y line). That peak
is called amplitude, or we can say the maximum
displacement from its normal line. This phenomenon
caused by particles of the medium get displaced
temporarily from their original undisturbed positions.
The International unit of amplitude is metre (m) but
sometimes it is also measured in centimetres.
- Time-Period : The best definition to time-
period is time required by a wave to complete it’s one
cycle. In 2D explanation, you can describe it by
‘mountain’ and ‘valley’. Or we called as full
vibration. Symbol of time-period is T, and the unit is
second (s). (GOYAL, 2018).
3 IIR (INFINITE IMPULSE
RESPONSE) FILTER
Infinite Implus Response or IIR is filter in that the
output is computed using current and previous input,
in addition also the current and previous output.
Because of that, this filter is called recursive filter
because the output is not straightforward used, but
calculated again and again. This filter uses Transfer
Function (Hz) that met the requirement of the filter
specifications. This method encourage the user to
make analogue model, and transform into pulse
transfer. Alternately, you can use digital design.
(Tutorials, 2018).
Basically transfer function of IIR filter which has n
orde is :
H
z
Bz
Az
b
b
z
…b
z
1a
z
⋯b
z
(1)
Where :
H(z) = transfer function of IIR filter
a1, a2 = feedback coefficient IIR filter
b1, b2 = feed forward coefficient IIR filter
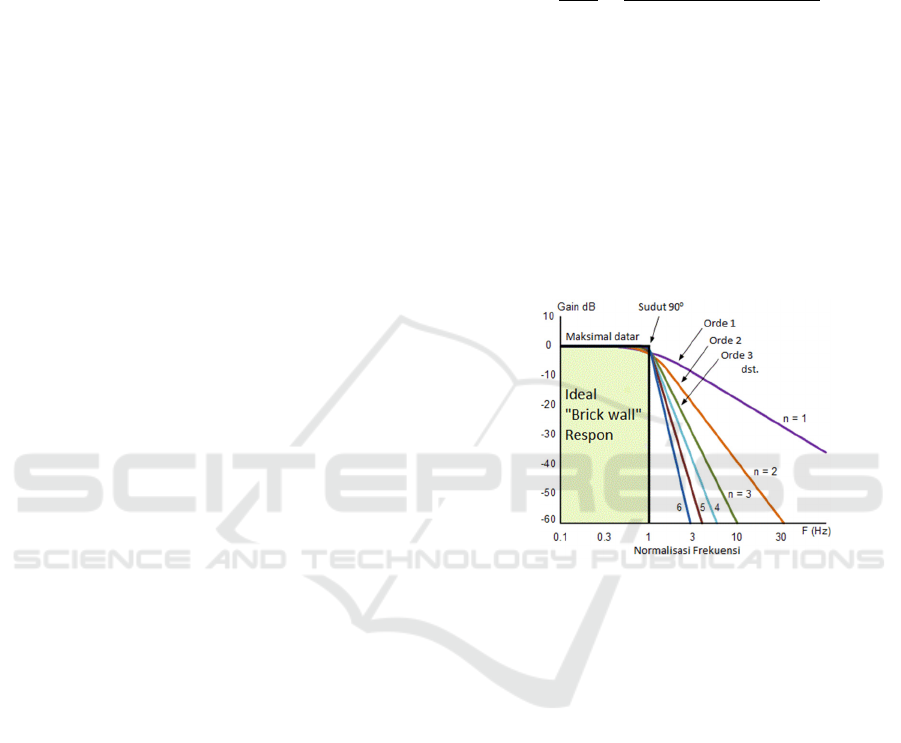
The frequency response of the Butterworth Filter
approximation function is also often referred to as
“maximally flat” or when you see in graphs, there are
no some kind of noise, or we called it a ripple. So in
context of sound, when you want a certain frequency
band as your output, then in the result you won’t hear
some sound from frequency outside your chosen
band. (Brown, 2014).
Figure 1: Frequency Response of Butterworth
In this research, author uses the bilinear transform
(transformation from continuous-time systems to
discrete-time systems (in the Z-domain)). This
method has two following characters:
- If H (s) of the laplace transformation is a
causal and stable LTI system, then H (z) will be
causal and stable.
- The characteristics of H (s) are as initial
characteristics of the characteristics of H (z) meaning
that in this method the H (s) is needed (Komal Singla,
2014).
4 ICA (INDEPENDENT
COMPONENT ANALYSIS)
FILTER
Listeners get lots of signal sources every day and
every time. Whether it comes from friction (sound
waves), or electromagnetic signals that we can not
Filter IIR (Butterworth) and ICA for Identifying Silent Chain’s Sound Characteristics
115

catch directly, but we feel (for example through
television or radio) (Aapo Hyvärinen, 2000).
Listeners deal with these signals every day. However,
due to external situations, it is not possible to get
signals purely, but signals are mixed (linearly mixed)
that we can observe. Because humans get the signal
already in mixed form, then this signal is often also
called naturally mixed / linearly mixed. Listeners
want the original signal for analysis and other
purposes. This is the problem of Blind Source
Separation, which is to get the original signal from a
signal that is naturally mixed / linearly mixed and by
observation, indeed only that signal is obtained
(Atmaja, Aisyah, & Arifianto, 2010).
To begin the process with ICA, it must start with
a simple abstract, namely with the Cocktail Party
Problem approach as explained in the previous
discussion (Filho, 2012). People who want to use ICA
must understand ICA abstractly why ICA should be
used. Therefore, with the Cocktail Party Problem
approach, people will easily understand that ICA will
output one signal source from naturally mixed /
linearly mixed signals. Of course, this output does not
always produce good quality or perfect output
because the method is still being developed and will
continue to develop (Kutz, Independent Component
Analysis 1, 2018). However, at least with the ICA
method, the components of the ICA process will be
seen and can be seen as its characteristics even though
it is not perfect (Shangmeng He, 2017).
The simple formulation of the object observed
with existing components can be written as follows:
(2)
Where x is the sound that is heard (natural mix),
A is the mixing matrix (mixing matrix), and s is a
component (sound source) (Kutz, Independent
Component Analysis 2, 2018).
The Singular Value Decomposition approach will
assume that A is a complex matrix and can be derived
into:
∑
∗
(3)
Therefore, the previous equation can be changed
to:
∑
∗
(4)
Because you want to find the components, then
from the formulation above, you must make an
inversion, that is:
∗
Σ
(5)
Where
∗
(6)
∑
(7)
cos
sin
sin
cos
(8)
(Kutz, Independent Component Analysis 3, 2018)
5 RESEARCH METHODOLOGY
5.1 Sound Identification
The main approach to this methodology is
quantitative method, because we’ll play with numbers
and data driven. To attain the data, need to identify
the sound. Reading data sheets and also study
literature about silent chain needed in this step.
5.2 Sound Sampling
The next step is doing some recording to get the sound
sampling. In this step, collaborating with mechanical
team will be an advantage. An accoustic room is
needed to reducing noise, All sound in different
environtment were sampled. After that, pull a
conclusion to best describe the silent chain characters,
such as frequency, amplitude, and period.
5.3 Filter Design
After we get some datas regarding silent chain sound,
then it’s time to design the filter. For Butterworth
(IIR) filter, a table for frequency start and cut-off is
needed, and some calculations to gain the
amplification of Butterworth filter to get the best
results. For ICA Filter, designing will be tricky, need
choose the best method to define the random matrix.
For this case, the best method is Singular Value
Decomposition because it can directly process the
sound amplitude into ICA process.
5.4 Transform and Load
The next step is we transform the record data into a
mathematical matrices and process it into matlab. 1
file will be processed in ICA filter, and another copy
will be processed in Butterwoth filter. The data will
transformed (by coding in ICA filter design, or by
coding in Butterworth filter design). Finally, load it
using graphs and add some insightful information.
6 RESULTS
From the silent chain recordings, amplitude datas can
be visualized as a time-domain graph and frequency-
ASAIS 2019 - Annual Southeast Asian International Seminar
116
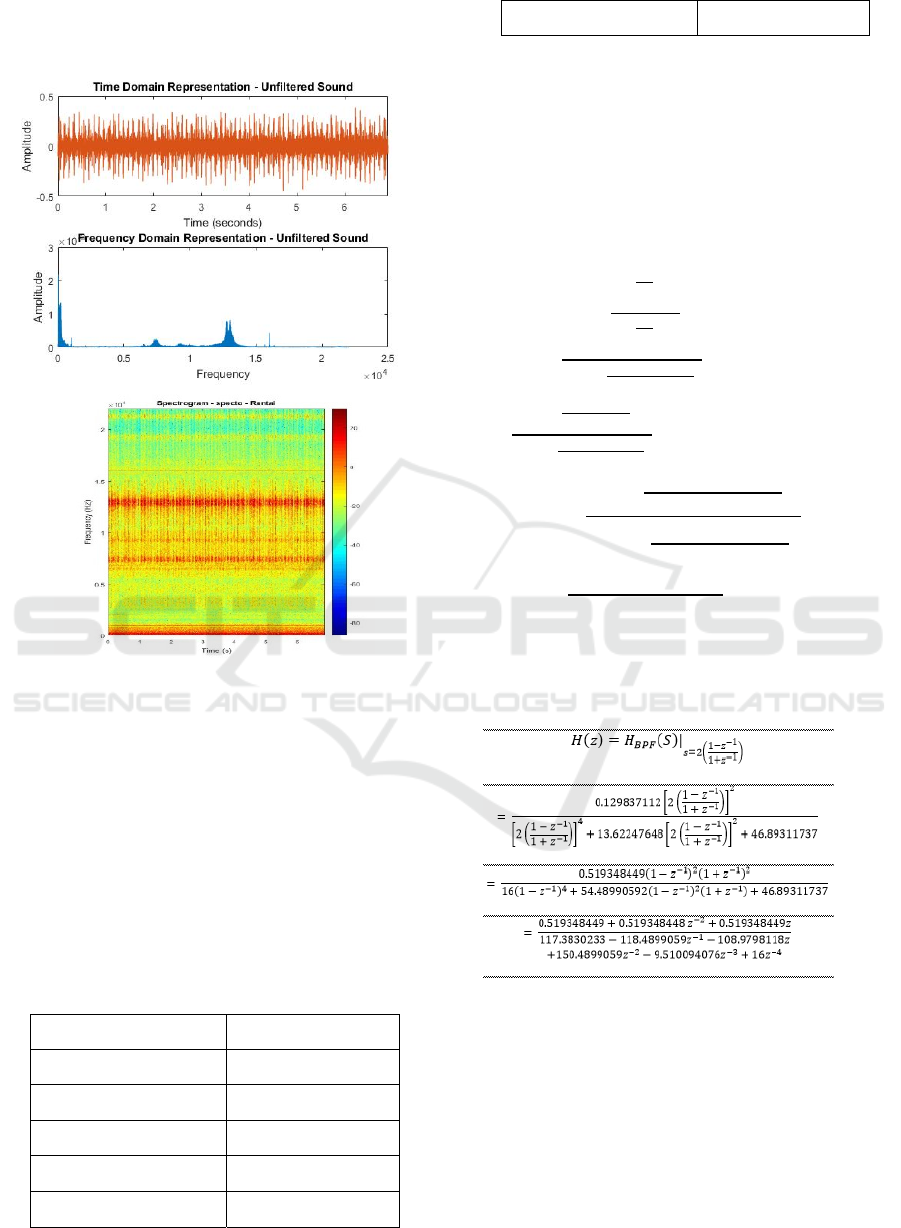
domain graph. For a convenient use, a spectrogram
can be used to analyze frequency spektrum for each
time-domain.
Figure 2: (upper) a time-domain plot from recording
data, (center) a frequency-domain plot from recording
data, (lower) a spektrogram of frequencies spektrum
in time-domain.
That is data from recording section that had been
done by microphone + software.
6.1 Butterworth Design and Result
Make a design for identify the filter specification
from data attained from figure 2 :
Table 1: Filter Specification
f
s1
10 Khz
f
p1
12 Khz
f
p2
13 Khz
f
s2
15 Khz
Fs 44100
K
1
(attenuation) 1 dB
K
2
(attenuation) -25dB
From the specification, there are two pass band
frequencies, fp1 and fp2, and two stop band
frequencies, fs1 and fs2. So it is known that the type
of filter design is between the band pass filter and the
band stop filter. From the value of fp1 and fp2 where
the value of fp1 is greater than fs1, it can be concluded
that the filter used is a type of band pass filter.
For filtering, we need an orde of the filter. But
from the specification, we have to determine the
frecuency cut off. So, we got the orde of the filter is :
.
,
.
.
.
0.258925412
315.2278
2
1
14.60483064
,
3.085449789
2.32899305
1.324799912
2
(9)
Then, do the transfer function H(z) of LPF
(10)
Then, do the Y(z)
1
1
0.136305912
0.004424391
Filter IIR (Butterworth) and ICA for Identifying Silent Chain’s Sound Characteristics
117
0.004383061
0.003451052
0.054610233
0.032459278
0.004765547
(11)
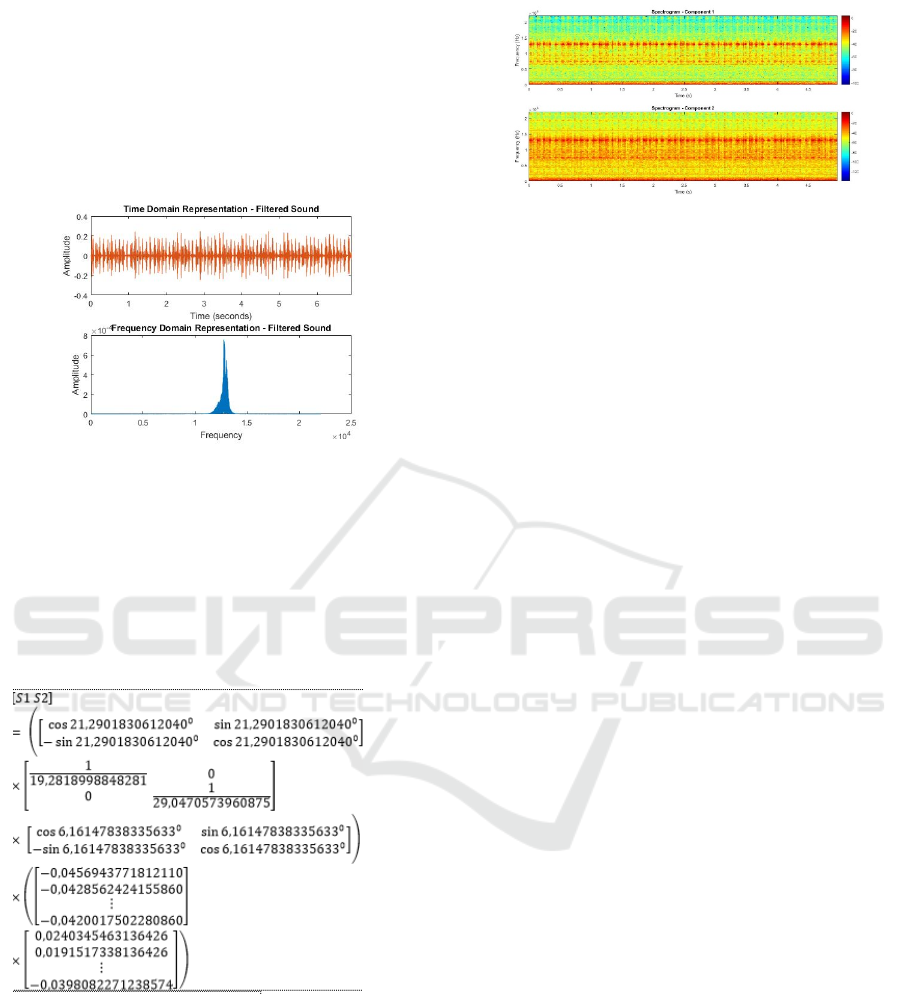
Figure 3: Signal After Filter
From figure 3, the frequency spectrum was more
concentrated at one ranged frequency.
6.2 ICA Design and Result
From these measurement data, a filter mathematical
model can be made. ICA Filter Mathematical Model
is
(12)
From ICA Filter, the result is two data that must
be analyzed, which one that can reflects which
component.
Figure 4: Two Signals After Filter
From figure 4, most likely better signal is the
upper one. Because it can focus to silent chain’s audio
frequencies. But on that graph, we can still see the
lower frequency still exist (not completely filtered).
7 CONCLUSIONS
As a final comparison, signal after filter give more
insight if we see the Butterworth one. But you must
know that to make / design Butterworth Filter, it’s not
easy, and you must calculate it meticulously.
Because, different with ICA which doesn’t compel
the researcher to have some prior knowledge,
Butterworth filter compel the researcher to have
knowledge about frequencies, attenuation, and etc.
ICA filter as a new research method to sound
separation not give a quite good filtered signal. But
the result was quite impressive. Because after design
the mathematical model, researcher can just study
from one certain component to find out which one the
silent chain’s frequency, and which one that don’t.
As a filter, Butterworth is dependable and reliable.
Its method and result is excellent and can make noise
frequencies ‘disappear’ completely. But, researcher
must know in the first time, what the silent chain’s
frequency range is, and must know to what extent the
attenuation is permitted.
The final characteristics of silent chain is from
7000 Hz to 14000 Hz. And the motor is 0 Hz – 1000
Hz. Both filter succeed to passing the 7000 Hz –
14000 Hz frequencies.
REFERENCES
Aapo Hyvärinen, E. O. (2000). Independent Component
Analysis: Algorithms and Applications. Journal of
Neural Networks, 20.
Atmaja, B., Aisyah, A., & Arifianto, D. (2010).
Pemisahan Banyak Sumber Suara Mesin
Menggunakan Independent Component Analysis (ICA)
ASAIS 2019 - Annual Southeast Asian International Seminar
118

Untuk Deteksi Kerusakan. Jurnal Ilmu Komputer dan
Informasi, Volume 3 Nomor 1 .
Brown, D. R. (2014). IIR Filter Design via Bilinear
Transform. Digital Signal Processing.
Filho, E. F. (2012). Independent Component Analysis And
Blind Source Separation: Theory, Algorithms And
Applications. Journal of The Brazilian Neural Network
Society, Vol. 10, Iss.1, 51-69.
Ghita, C., Raicu, & Pantelimon. (2015). Implementation of
The FastICA Algorithm in Sound Source Separation.
The 9th International Symposium on Advanced Topics
In Electrical Engineering, Journal IEEE, 978-1-4799-
7514-3/15.
GOYAL, S. (2018, May 7). What are the characteristics of
Sound Waves? Retrieved from JagranJosh:
https://www.jagranjosh.com/general-knowledge/what-
are-the-characteristics-of-sound-waves-1525678871-1
Hansen, C. H. (n.d.). Fundamentals of Acoustics. South
Australia: University of Adelaide Press.
Hyvärinen, A. (n.d.). A Short Introduction to Independent
Component Analysis. Helsinki: Helsinki Institute for
Information Technology and Depts of Computer
Science and Psychology University of Helsinki.
Komal Singla, E. S. (2014). Audio Noise Reduction Using
Different Filters Journal.
Kutz, J. N. (2018, December 31). Independent Component
Analysis 1. Retrieved from Kutz Home | Kutz Research
Group:
http://faculty.washington.edu/kutz/KutzBook.html
Kutz, J. N. (2018, December 31). Independent Component
Analysis 2. Retrieved from Kutz Home | Kutz Research
Group:
http://faculty.washington.edu/kutz/KutzBook.html
Kutz, J. N. (2018, December 31). Independent Component
Analysis 3. Retrieved from Kutz Home | Kutz Research
Group:
http://faculty.washington.edu/kutz/KutzBook.html
Lie, D. (2017). Filter Digital. Retrieved from DocPlayer:
https://docplayer.info/30544069-Bab-vi-filter-
Mathworks. (2008). Mathworks. Retrieved from
http://www.mathworks.com:
http://www.mathworks.com/products/demos/shipping/
signal/introfdatooldemo.html?product=SG
Maulana, I., & Andono, P. N. (2016). Analisa Perbandingan
Adaptif Median Filter dan Median Filter Dalam
Reduksi Noise Salt & Pepper. Cogito Smart
Journal/VOL. 2/NO. 2/ DESEMBER 2016, 157-166.
Shangmeng He, e. a. (2017). Research on Sound Separation
And Identification of Trapped Miners Based on
FastICA Algorithm. Journal IEEE 978-1-5090-3025-
5/17.
Tutorials, E. (2018). Butterworth Filter Design. Retrieved
from ElectronicTutorials: https://www.electronics-
tutorials.ws/filter/filter_8.html
Xianchuan Yu, e. a. (2014). Blind Source Separation:
Theory and Applications, First Edition. Singapore:
John Wiley & Sons Singapore Pte. Ltd.
Filter IIR (Butterworth) and ICA for Identifying Silent Chain’s Sound Characteristics
119
