
Development of Water Quality Monitoring Systems
in Super Intensive Aquaculture System
using ESP32 and Blynk
Murie Dwiyaniti
1
, Rika Novita W.
1
and Tohazen
1
1
Electrical Engineering, Politeknik Negeri Jakarta, Indonesia
Keywords: Water quality, real-time monitoring, IoT, ESP32, Blynk
Abstract: Best water quality is the most important medium to optimize fish growth in a super-intensive aquaculture
system. Any changes in the parameter of water will affect fish growth and even will cause death. For this
reason, parameters of water quality should be monitored in real-time and automatically send the data to the
owner based on the internet of things (IoT). So that the owner will know all data in real-time and does not
need to be located in the pond all day. The owner can simply look at the data on the smartphone. So working
time becomes more efficient. In this study, we developed a water quality monitoring integrated, consist of (1)
sensors: dissolved oxygen (DO) temperature, pH, and salinity; (2) ESP32 and ADS115 microcontrollers as
controllers and ADCs; (3) display of parameter values based on IoT with the Blynk platform. This system can
measure water conditions in real-time, display parameter values via a smartphone, and send notifications or
alarms if there is a change in value, exceed the specified threshold. The test results show that this system can
receive and send data to the Blynk application; alarm gives notification on the smartphone in the event of
reading the parameter values exceed the specified threshold.
1 INTRODUCTION
Aquaculture is an up-and-coming food production
sector. Business projections in Indonesia indicate that
aquaculture will grow to more than 10.1 tons per year,
creating 8.9 million jobs equivalent to full-time
employment in production and will become a sector
with a production value of USD 39.5 billion by 2030
(Phillips et al., 2016). Indonesian aquaculture
production includes seaweed, tilapia, catfish,
milkfish, shrimp, and tuna. However, to produce high
quality of aquaculture production need good water
quality. Parameter of water that affects fish growth is
dissolved oxygen (DO), temperature, pH, and salinity
(Wiranto & Hermida, 2010).
Changes in water quality parameters such as
changes in temperature will cause decreased appetite
and many calories lost, which can cause death (Fuady
& Nitisupardjo, 2013). Avery changes in water
quality parameters outside the standard have an
impact on the pattern of life, and its development
even can cause death. Therefore, it is necessary to
measure water quality in real-time and control
parameters so that they remain constant within the
allowable value.
Water quality management and monitoring
systems in aquaculture have been investigated with
various method of data reading using Arduino
(Anwar, Hermida, & Waslaluddin, 2018; Hongpin,
Guanglin, Weifeng, Jie, & Qiuwei, 2015; Multazam
& Hasanuddin, 2017; Sambora & Waluyanti, 2016;
Wiranto & Hermida, 2010). However, Raspberry Pi
is a lot more advanced compared with Arduino
because it has an intrinsic Wi-Fi module (Ferdoush &
Li, 2014). The continuously detected information is
sent directly to the owner through app/Android
(Hongpin et al., 2015; Kusrini, Wiranto, Syamsu, &
Hasanah, 2016). Recently IoT is reaching the top
level to the monitored parameter of water quality
(Abinaya, Ishwarya, & Maheswari, 2019; Chavan,
Patil, Chavan, Sana, & Shinde, 2018; Encinas, Ruiz,
Cortez, & Espinoza, 2017; Niswar et al., 2018;
Nocheski & Naumoski, 2018; Zhang, Hua, & Wang,
2013). However, for a case of water quality in super-
intensive aquaculture, controlling and monitoring
using ESP32 microcontroller connected to ADS115
based on the Blynk platform almost not found.
90
Dwiyaniti, M., W., R. and Tohazen, .
Development of Water Quality Monitor ing Systems in Super Intensive Aquaculture System using ESP32 and Blynk.
DOI: 10.5220/0009894200002905
In Proceedings of the 8th Annual Southeast Asian International Seminar (ASAIS 2019), pages 90-95
ISBN: 978-989-758-468-8
Copyright
c
2022 by SCITEPRESS – Science and Technology Publications, Lda. All rights reserved
Therefore, this research made a system design
with the ESP32 controller integrated with ADS115
and data monitoring via the IoT Blynk platform. In
this system, there is also an alarm that can provide
notification to the owner via a smartphone. If there is
a change in the parameter value that exceeds the
specified threshold. Also, the data recording for one
day will be sent to the owner via email.
2 METHODOLOGY
The research method consists of three parts, namely
(1) system architecture design; (2) manufacturing
hardware used for implementation; and (3) making
software that describes the functions of each
component.
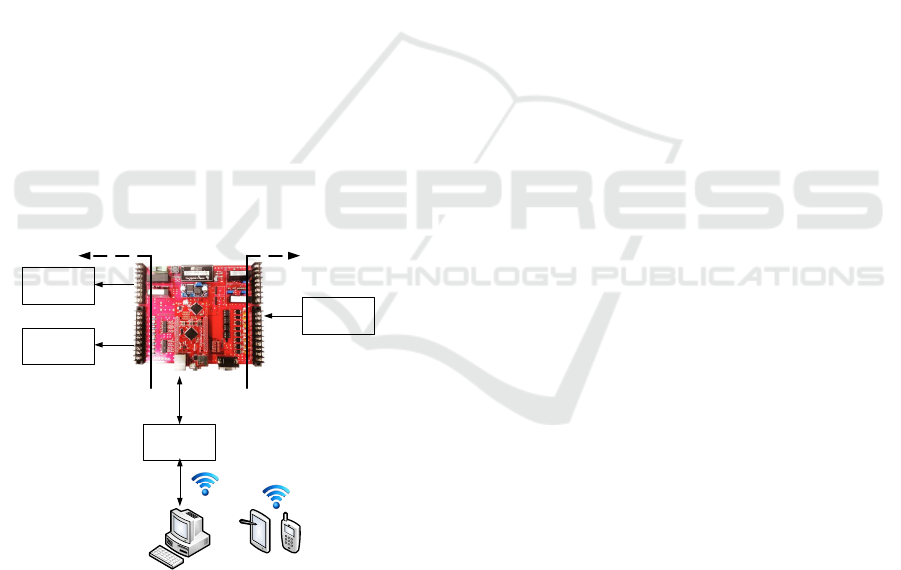
2.1 System Architecture
Integrated components in this system are ESP32
module, ADC with ADS115 type, Sensor, database,
Blynk platform IoT Service, mobile application, and
Desktop application. Figure 1 shows the system
architecture: input, process, output, connectivity, and
data display.
WEB IoT
Broker IoT
Prototipe RTU berbasis mikrokontroler
Telah dibuat pada penelitian tahun 2015 - 2017
Multi Valve
Multi Pompa
Multi sensor
Input (sensor)
Figure 1: System architecture
In this section, there are four sensors used,
namely the LM35DZ temperature sensor, the
SEB0161-V2 pH sensor, the salinity sensor, and the
Atlas Dissolved Oxygen sensor. Temperature, pH,
and salinity sensors are connected with ADS115 to
convert analog data to digital then the data is read by
ESP32. Whereas the DO Sensor sends data via UART
(Universal Asynchronous Transmitter-Receiver) to
ESP32. Data measurement is done by immersing all
of these sensors into water.
Connectivity data from the sensor transmit via
Wi-Fi that is in ESP32. Wi-Fi on ESP32 works in the
2.4 GHz frequency band and transfers data up to 150
Mbit / s.
The ESP32 module is used as a controller for
receiving and sending data to the internet. Data from
the ESP32 module is displayed on Blynk, which is an
internet-based mobile OS application platform.
2.2 Hardware
As equipment storage, we use aluminum luggage
with a material thickness of 5 mm, outer size,
27x23x7cm, and inner size 26.5x1.5x6cm. In this
suitcase, consist of the component, as in Figure 2.
2.2.1 Power Module
The power module has a DC-DC converter, BMS
(batteries management system), and 25 units of Li-
Ion 18650 Cylindrical batteries with a capacity of
2700 mAh, 3.7V voltage connected in parallel. The
battery is used to supply control in the night as water
quality parameters, for the most part, changes at
night. A DC-DC converter use for convert voltage to
scale controller module, which will work at 5V.
2.2.2 Sensor Module
The sensor module consists of pH, temperature,
salinity, and DO sensors. These sensors are connected
with ESP32 for detecting the water parameters.
2.2.3 Controller Module
The most important part of this project is ESP32 RTU
modules as a controller. ESP32 is a low budget,
inbuilt Wi-Fi module, easy write and read data
programming with Arduino language, and sends that
data to IoT platform.
2.2.4 Output Module
The output module consists of a relay that connected
to the water pump and valve. The operation of the
relay depends on a signal from the controller.
2.2.5 Display
Smartphone and 7-inch screen size tablets are used to
the monitored parameter of water quality. An app of
the Blynk platform has been developed in these. If the
sensed data exceed the threshold ranges alert message
will be shown in the monitor.
Development of Water Quality Monitoring Systems in Super Intensive Aquaculture System using ESP32 and Blynk
91
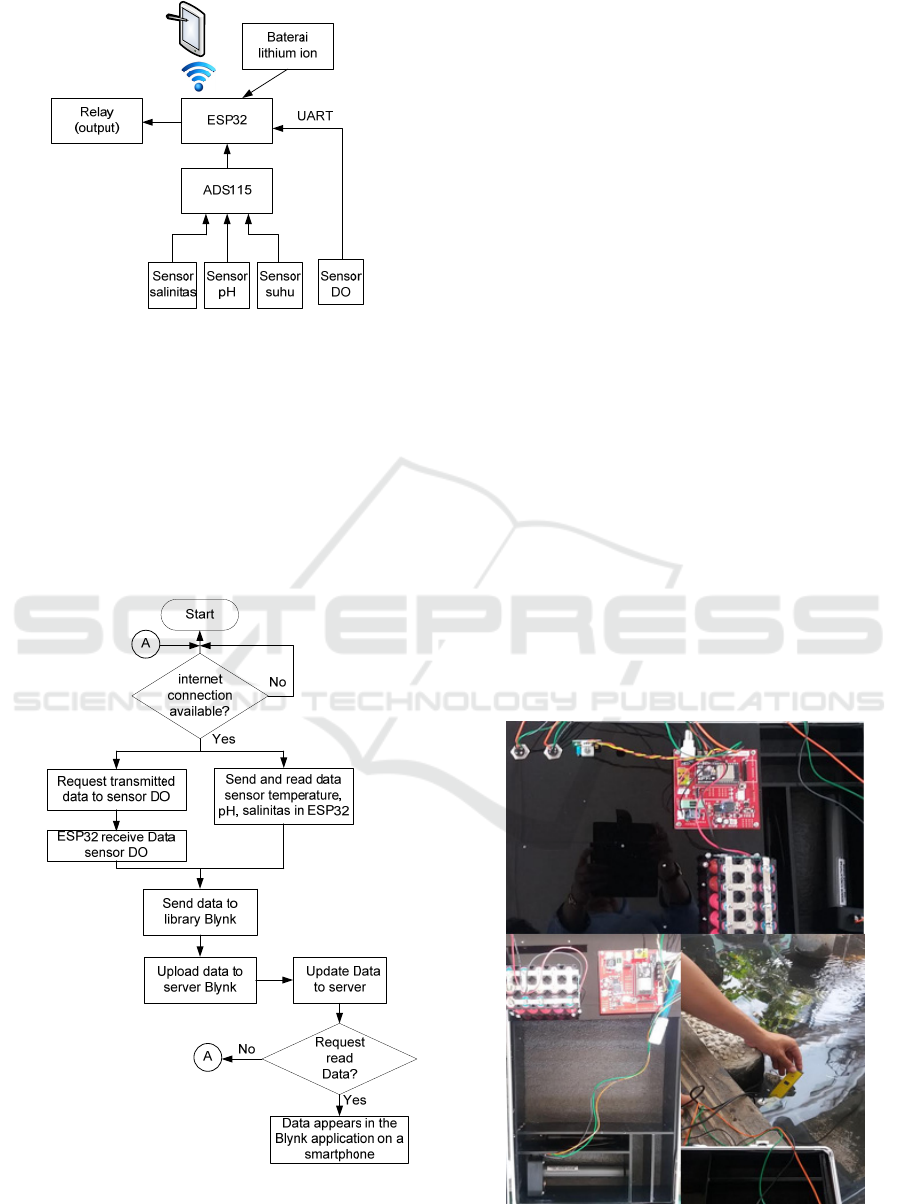
Figure 2: Hardware in the aluminum suitcase
2.3 Software
This system uses ESP32 with the Arduino
programming language. We made programming of
reading serial sensor data, analog sensor data,
conversion of analog to digital data, connection to
Blynk, sending data to Blynk, as shown in the
flowchart of Figure 3.
Figure 3: Flowchart system
The flowchart in the software starts with the detection
of an internet connection. It must be connected to the
Blynk server. If there is an internet connection, the
sensor starts sending data, and ESP32 receives the
data to be forwarded to the Blynk server. After the
server on Blynk is updated, the data will be displayed
on the Blynk application on the smartphone.
3 RESULT AND DISCUSSION
A water quality monitoring system has been
developed successfully using hardware, software, and
architecture that have been designed. The experiment
was taken to a fishpond to test the performance of the
equipment of a water quality monitoring system.
Water quality parameters are set as follows:
1. The range of values for temperature = 27
0
C -
33
0
C
2. The range of values for PH = 5 - 8.0
3. The range of values for dissolved oxygen
(DO) = 4 - 10 mg / l
4. The range of values for salinity = 0 - 1 g / l
Figure 4 shows the system implementation. An
aluminum suitcase with four sensors and electronic
devices are placed near the pond where the water
quality will be measured, and four sensors immersed
in the pond. Implementation is started at 07.00 AM
until 09.00 PM.
Figure 4: Implementation system
ASAIS 2019 - Annual Southeast Asian International Seminar
92
This system has a current of 0.85 a, using a lithium-
ion battery of 13,500 mA/hour, the system is capable
of working around 114.75 hours. This is more than
enough to prove the concept of this prototype. The
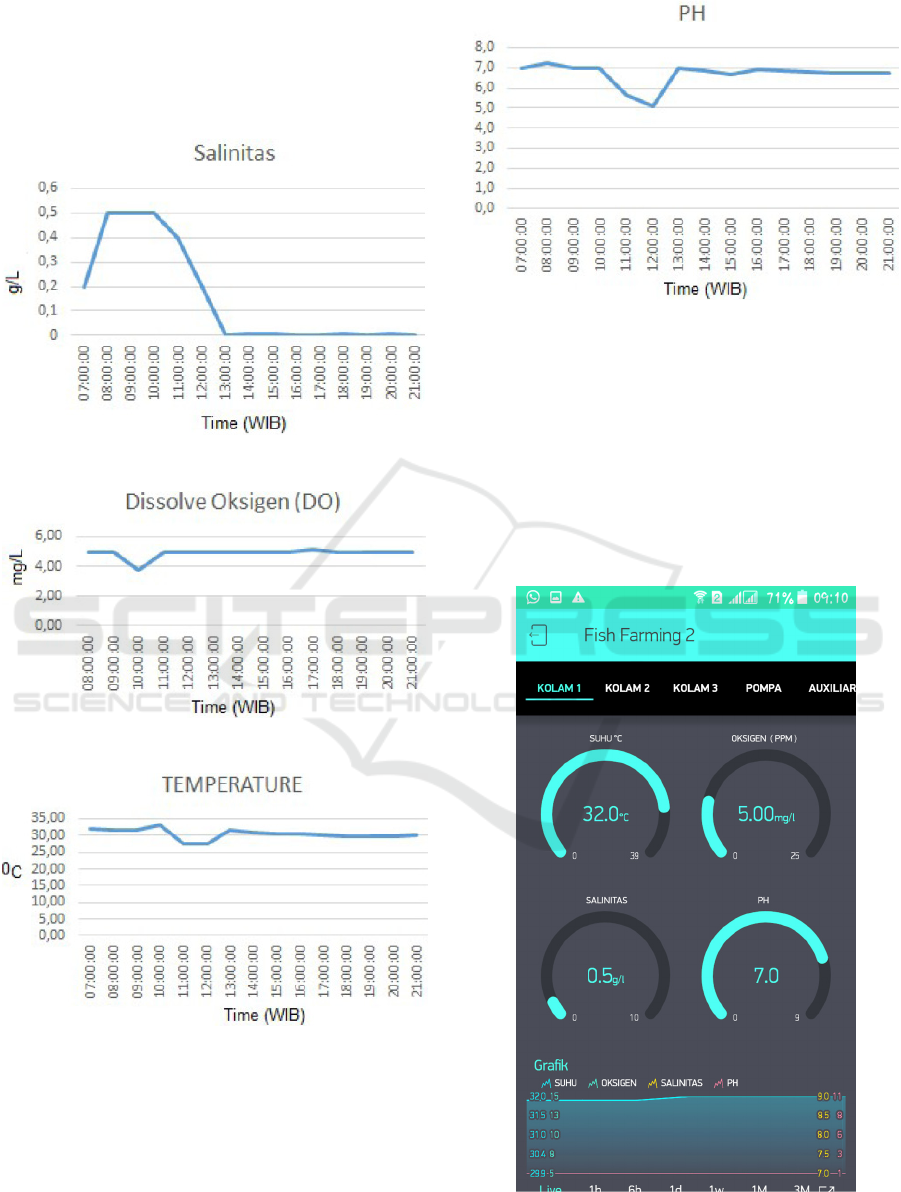
measurement result can be seen in Figures 5, 6, 7, 8.
Figure 5: Data measurement from a salinity sensor
Figure 6: Data measurement from the DO sensor
Figure 7: Data measurement from temperature sensor
Figure 8: Data measurement from pH sensor
From figure 5-8, we can see that all of the
measurement was taken from 07.00 AM until 09.00
PM. All data are within the standard range of values:
salinity is 0-0,5 g/L, DO tends to be constant at 5
mg/L, the temperature in range 27
0
C-33
0
C, and PH
stable at 7.
These data send to IoT with the Blynk
platform every second. Display data in a smartphone
or tablet can be seen in Figure 9.
Figure 9: Display data in smartphone
Development of Water Quality Monitoring Systems in Super Intensive Aquaculture System using ESP32 and Blynk
93
From Figure 9, it can be seen that the data of each
sensor appears on the smartphone display. Also,
history data appears in graphical form. This data
history can be sent to the owner if needed via email
in the form of data.csv.
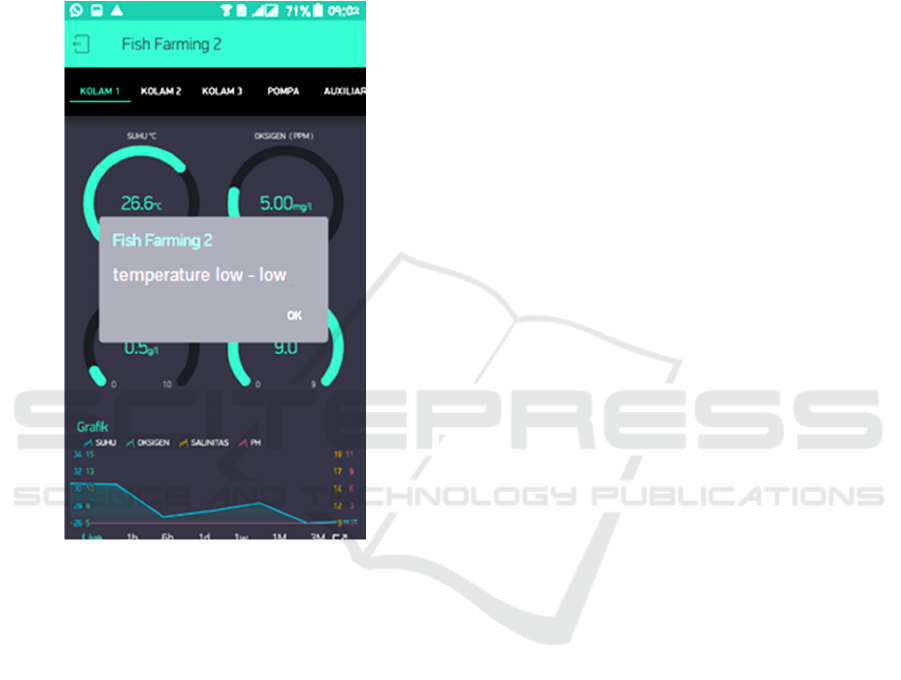
If there is a sensor reading condition exceed the
standard threshold, a notification will appear on the
smartphone, as shown in Figure 10.
Figure 10: Display of alert in smartphone
Figure 10 shows that the temperature that occurred
was 26.6
0
C. Because this temperature exceeds the
standard threshold, the notification "Temperature
low-low" appears. Similar to other parameters, if the
measurement exceeds the range of standard values,
this notification will show.
4 CONCLUSIONS
This study presents a prototype implementation of the
concept of a remote monitoring system with IoT
technology aimed at monitoring water quality in
aquaculture. The test results prove that the system has
worked well and able to measure the values of water
parameters such as pH, temperature, salinity, and DO.
ACKNOWLEDGEMENTS
This work was supported by Decentralization
Research “Skim Penelitian Produk Terapan” which is
the allocation for the Polytechnic State of Jakarta
under contract number: 221/PL3.18/SPK/2019.
REFERENCES
Abinaya, T., Ishwarya, J., & Maheswari, M. 2019. A Novel
Methodology for Monitoring and Controlling of Water
Quality in Aquaculture using Internet of Things (IoT).
Paper presented at the 2019 International Conference
on Computer Communication and Informatics (ICCCI).
Anwar, H., Hermida, I. D. P., & Waslaluddin, W. 2018.
Rancang Bangun Sistem Telemetri Wireless Realtime
Monitoring Kualitas Air Terintregrasi Dengan
Automatic Sampling Dan Aplikasi Database Berbasis
Mikrokontroler. Fibusi (Jurnal Online Fisika), 3(3).
Chavan, M., Patil, M. V. P., Chavan, S., Sana, S., & Shinde,
C. 2018. Design and implementation of IOT based real
time monitoring system for aquaculture using raspberry
pi. International Journal on Recent and Innovation
Trends in Computing and Communication, 6(3), 159-
161.
Encinas, C., Ruiz, E., Cortez, J., & Espinoza, A. 2017.
Design and implementation of a distributed IoT system
for the monitoring of water quality in aquaculture.
Paper presented at the 2017 Wireless
Telecommunications Symposium (WTS).
Ferdoush, S., & Li, X. 2014. Wireless sensor network
system design using Raspberry Pi and Arduino for
environmental monitoring applications. Procedia
Computer Science, 34, 103-110.
Fuady, M. F., & Nitisupardjo, M. 2013. Pengaruh
Pengelolaan Kualitas Air Terhadap Tingkat
Kelulushidupan Dan Laju Pertumbuhan Udang
Vaname (Litopenaeus Vannamei) Di Pt. Indokor
Bangun Desa, Yogyakarta. Management of Aquatic
Resources Journal, 2(4), 155-162.
Hongpin, L., Guanglin, L., Weifeng, P., Jie, S., & Qiuwei,
B. 2015. Real-time remote monitoring system for
aquaculture water quality. International Journal of
Agricultural and Biological Engineering, 8(6), 136-
143.
Kusrini, P., Wiranto, G., Syamsu, I., & Hasanah, L. 2016.
Sistem Monitoring Online Kualitas Air Akuakultur
untuk Tambak Udang Menggunakan Aplikasi Berbasis
Android. Jurnal Elektronika dan Telekomunikasi,
16(2), 25-32.
Multazam, A. E., & Hasanuddin, Z. B. 2017. Sistem
monitoring kualitas air tambak udang vaname.
JURNAL IT: Media Infromasi STMIK Handayani
Makassar, 8(2), 118-125.
Niswar, M., Wainalang, S., Ilham, A. A., Zainuddin, Z.,
Fujaya, Y., Muslimin, Z., . . . Fall, D. 2018. IoT-based
Water Quality Monitoring System for Soft-Shell Crab
Farming. Paper presented at the 2018 IEEE
ASAIS 2019 - Annual Southeast Asian International Seminar
94

International Conference on Internet of Things and
Intelligence System (IOTAIS).
Nocheski, S., & Naumoski, A. 2018. Water Monitoring Iot
System For Fish Farming Ponds. Industry 4.0, 3(2), 77-
79.
Phillips, M., Henriksson, P., Tran, N., Chan, C., Mohan, C.,
Rodriguez, U., . . . Koeshendrajana, S. 2016.
Menjelajahi masa depan perikanan budidaya Indonesia
(Exploring Indonesian aquaculture futures).
Sambora, Y. M., & Waluyanti, S. 2016. Monitoring
Kualitas Air Pada Budidaya Udang Berbasis
ATMEGA328 Yang Terkonfigurasi Bluetooth HC-05.
E-JPTE (Jurnal Elektronik Pendidikan Teknik
Elektronika), 5(6), 72-80.
Wiranto, G., & Hermida, I. D. P. 2010. Pembuatan Sistem
Monitoring Kualitas Air Secara Real-Time dan
Aplikasinya Dalam Pengelolahan Tambak Udang.
Jurnal Teknologi Indonesia, 33(2), 107-113.
Zhang, Y., Hua, J., & Wang, Y. B. 2013. Application effect
of aquaculture IOT system. Paper presented at the
Applied Mechanics and Materials.
Development of Water Quality Monitoring Systems in Super Intensive Aquaculture System using ESP32 and Blynk
95
