
Recommendation of SAW “Simple Additive Weighting” Model Employee
Acceptance Decision Support System with Analysis Regression
M. Z. Yumarlin
1
, Ryan Ari Setyawan
1
, Jemmy Edwin B.
1
, Sri Rahayu
1
and Nur Fitri Asih
1
1
Informatics Engineering Department, Faculty of Engineering, Janabadra University
Keywords:
Decision Support System, Employee acceptance , Simple Additive Weighting and Regression
Abstract:
Decision support system as a tool for decision makers that is integrated directly with computers provide useful
information to help make structured and unstructured decisions. This study aims to implement the SAW
(Simple Additive Weighting) Model to calculate the weights of the criteria that become benchmarks for the
feasibility of prospective applicants in providing optimal solutions. The results of correlation and regression
in building this application analysis for the sixth criteria used in the assessment of employee acceptance for
each alternative candidate there are five criteria that can be recommended in the employee acceptance decision
support system, with the result that the correlation criteria value for work experience is 0.300, Educational
Level criteria 0.253, Psychological Test criteria 0.479, criteria for the Administrative Test is 0.723 and the
criteria for the Interview Test 0.748 shows a sufficient and very high relationship, while for the Age criteria
-0.112 for a weak relationship so it is not recommended.
1 INTRODUCTION
An institution or college is driven by humans who are
trained and have certain skills and have experience.
Human resources in an institution or college are very
important things to support the progress and quality
of institutions or universities in achieving their goals
(Sinaga et al., 2016).
Employees are one of the resources used as a driv-
ing force in advancing a company(Umar et al., 2018).
Employee acceptance selection is a very important
factor for the smooth process in an institution or col-
lege to fill in a position that is classified as suitable
criteria for occupying a position proposed by an in-
stitution or college (Sinaga et al., 2016). In accor-
dance with the goals of institutions or universities, it
is very necessary for the process of receiving human
resources in a professional and accurate way to pro-
duce human resources that can support the quality and
success of institutions or universities.
Problems encountered in employee recruitment
are difficulties in determining standards that will
be used to measure selection qualifications objec-
tively(N, 2014). Difficulty in getting the right, hon-
est and objective selector(Hidayat, 2015), and to de-
termine applicants in accordance with specifications
do not have a standardized decision system that can
assess the feasibility of prospective job applicants in
accordance with the needs of the agency or univer-
sity(Sinaga et al., 2016). Decision is a series of activ-
ities to choose an action in solving a problem. The
act of choosing from an alternative faced based on
facts and carried out through a systematic approach
that can provide the best solution done by the leader
is called decision making(Palasara, 2017).
The study entitled The Effect of Financial Perfor-
mance on Stock Prices (Rinianty and Sukardi, ) aims
to develop theory and problem solving through sys-
tematic analysis. In managing data, the analysis used
in this paper is descriptive, in the form of hypothesis
testing using statistical tests, namely Statistical Prod-
uct and Service Solution (SPSS).
Assessment of employee soft skills by applying
four criteria has been discussed (Umar et al., 2018).
These four criteria are communication skills, ability
to work together, honesty, and interpersonal skills.
Data analysis applies the Analytical Hierarchical Pro-
cess (AHP) method, which allows mathematical cal-
culations with various criteria. The results showed the
value of the consistency ratio of 0.053 which means
less than the value of the consistency ratio used in the
AHP method that is 0.1, so the results of the calcu-
lation are valid, and can be used. This study resulted
in the competency competency skills assessment re-
quired by the company as follows: 48% of Commu-
nication, 27% of Cooperation, 16% of Honesty, and
90
Yumarlin, M., Setyawan, R., B., J., Rahayu, S. and Asih, N.
Recommendation of SAW “Simple Additive Weighting” Model Employee Acceptance Decision Support System with Analysis Regression.
DOI: 10.5220/0009878800900095
In Proceedings of the 2nd International Conference on Applied Science, Engineering and Social Sciences (ICASESS 2019), pages 90-95
ISBN: 978-989-758-452-7
Copyright
c
2020 by SCITEPRESS – Science and Technology Publications, Lda. All rights reserved
10% of Interpersonal. The results of this study prove
that the AHP method can be used in the assessment of
employee soft skills.
In a study of the best decision making system for
employee selection using Analytic Hierarchy Process
(Komalasari, 2020) shows clear differences in priori-
tization because there is data until the 4th digit is be-
hind the comma still has the same numbers, which is
ranked 2 and 3 with the same value - equal to 0.1040
and at rank 6 and 7 with a value equal to 0.0980.
This study implements the SAW (Simple Additive
Weighting) Model to calculate the weights of the cri-
teria that become benchmarks for the feasibility of ap-
plicants in providing optimal solutions and informa-
tion as a tool for making employee acceptance deci-
sions, and knowing the relationship between the cri-
teria contained in the employees acceptance system
using Correlation and Regression analysis.
2 METHODOLOGY
2.1 Research Mechanism
For the calculation of criteria with each weight that
has been determined, this study was taken using the
calculation of Simple Additive Weighting.
The SAW method can assist in the decision-
making of a case, in a calculation that produces the
greatest preference value that will be chosen as the
best alternative. SAW method is more efficient be-
cause the time needed in the calculation is shorter
(De Christin and Djamain, 2015).
The SAW method requires the process of nor-
malizing the decision matrix (X) to a scale that can
be compared with all available alternative ratings.
Where determining the transformation value into a
decision matrix (X) is a value from the results of the
above match rating table made into a matrix form as
follows:
x1 x2 x3
x4 x5 x6
x7 x8 x9
(1)
The formula for normalizing it (De Christin and
Djamain, 2015) is as follows:
r
i j
=
(
x
i j
Maxx
i j
Minx
i j
x
i j
Where r
i j
is the normalized performance rating of
the alternative A
i
in the attribute C
j
; i=1,2,...,m and
j=1,2,...,n. The preference value for each alternative
(V
i
) the following.
v
i
= Σ
n
j=1
w
j
r
i j
(2)
Larger V
i
values indicate that alternatives A
i
are
more chosen.
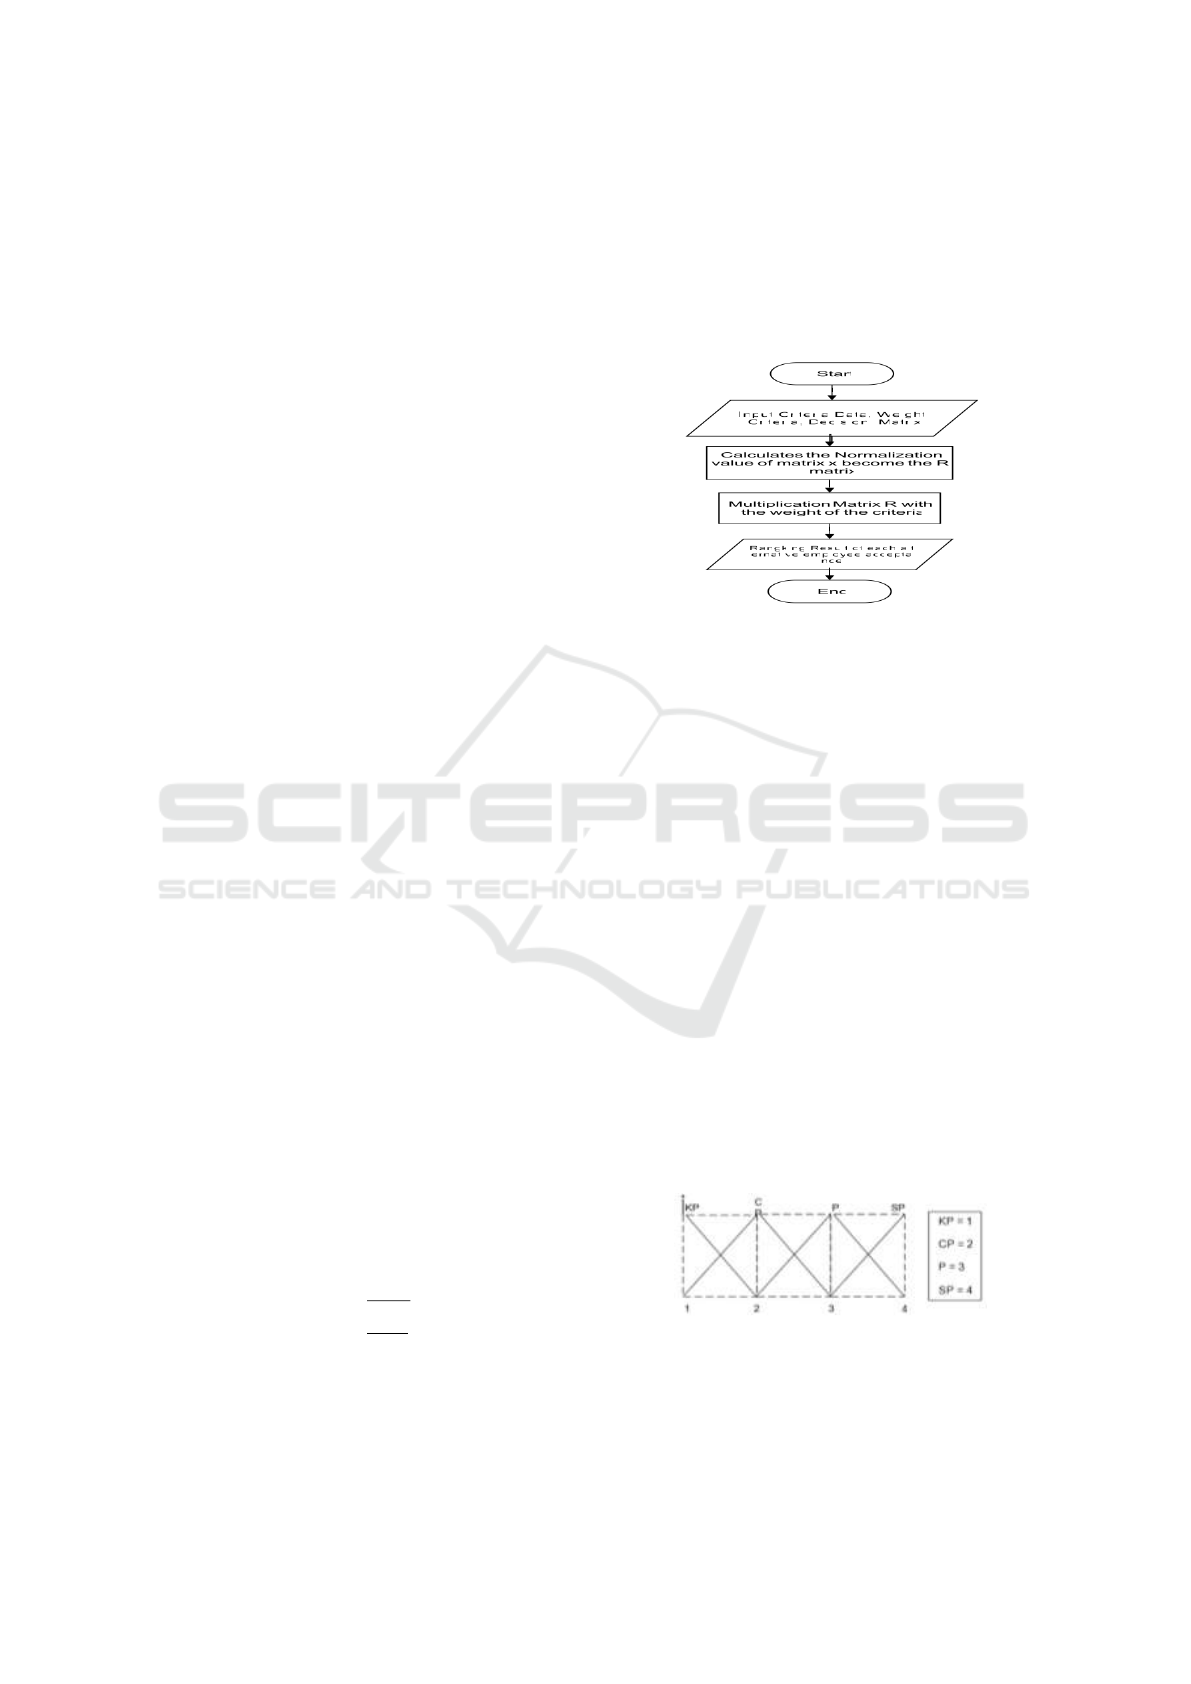
Following is the flow diagram of the calculation
using the SAW method, can be seen in figure 1 below.
Figure 1: Flowchart for calculation of SAW method
2.2 System Requirements
In this study used 6 criteria symbolized by C, that is
work experience (C1), education level (C2), age (C3),
administrative test (C4), interview test (C5), and psy-
chological test (C6). Making Alternative Data used
in this employee acceptance system are prospective
employees who submit applications. From several
applicants who submitted applications, 12 alternative
people were taken. Next is the determination of the
weight of each criterion for each Alternative Value
(Ai) in each Criteria (Ci) that has been determined.
Each component of the criteria must be given a weight
or value, according to the degree of importance, the
weight value of the criteria component is obtained
from the results of interviews related to which value
is greater or smaller.
the importance of each criterion is shown in Fig-
ure 2, judged by weights 1 to 4, where weight 1 (KP)
is less important, weight 2 (CP) is quite important,
weight 3 (P) is important and weight 4 (SP) is very
important shown in the following figure 2
Figure 2: Weighted fuzzy numbers
Recommendation of SAW “Simple Additive Weighting” Model Employee Acceptance Decision Support System with Analysis Regression
91
In this study decision-making will be carried out
using the Simple Additive Weighting (SAW) Model.
Suppose the data used is as in Figure 3.
Figure 3: Rating match alternatives and criteria.
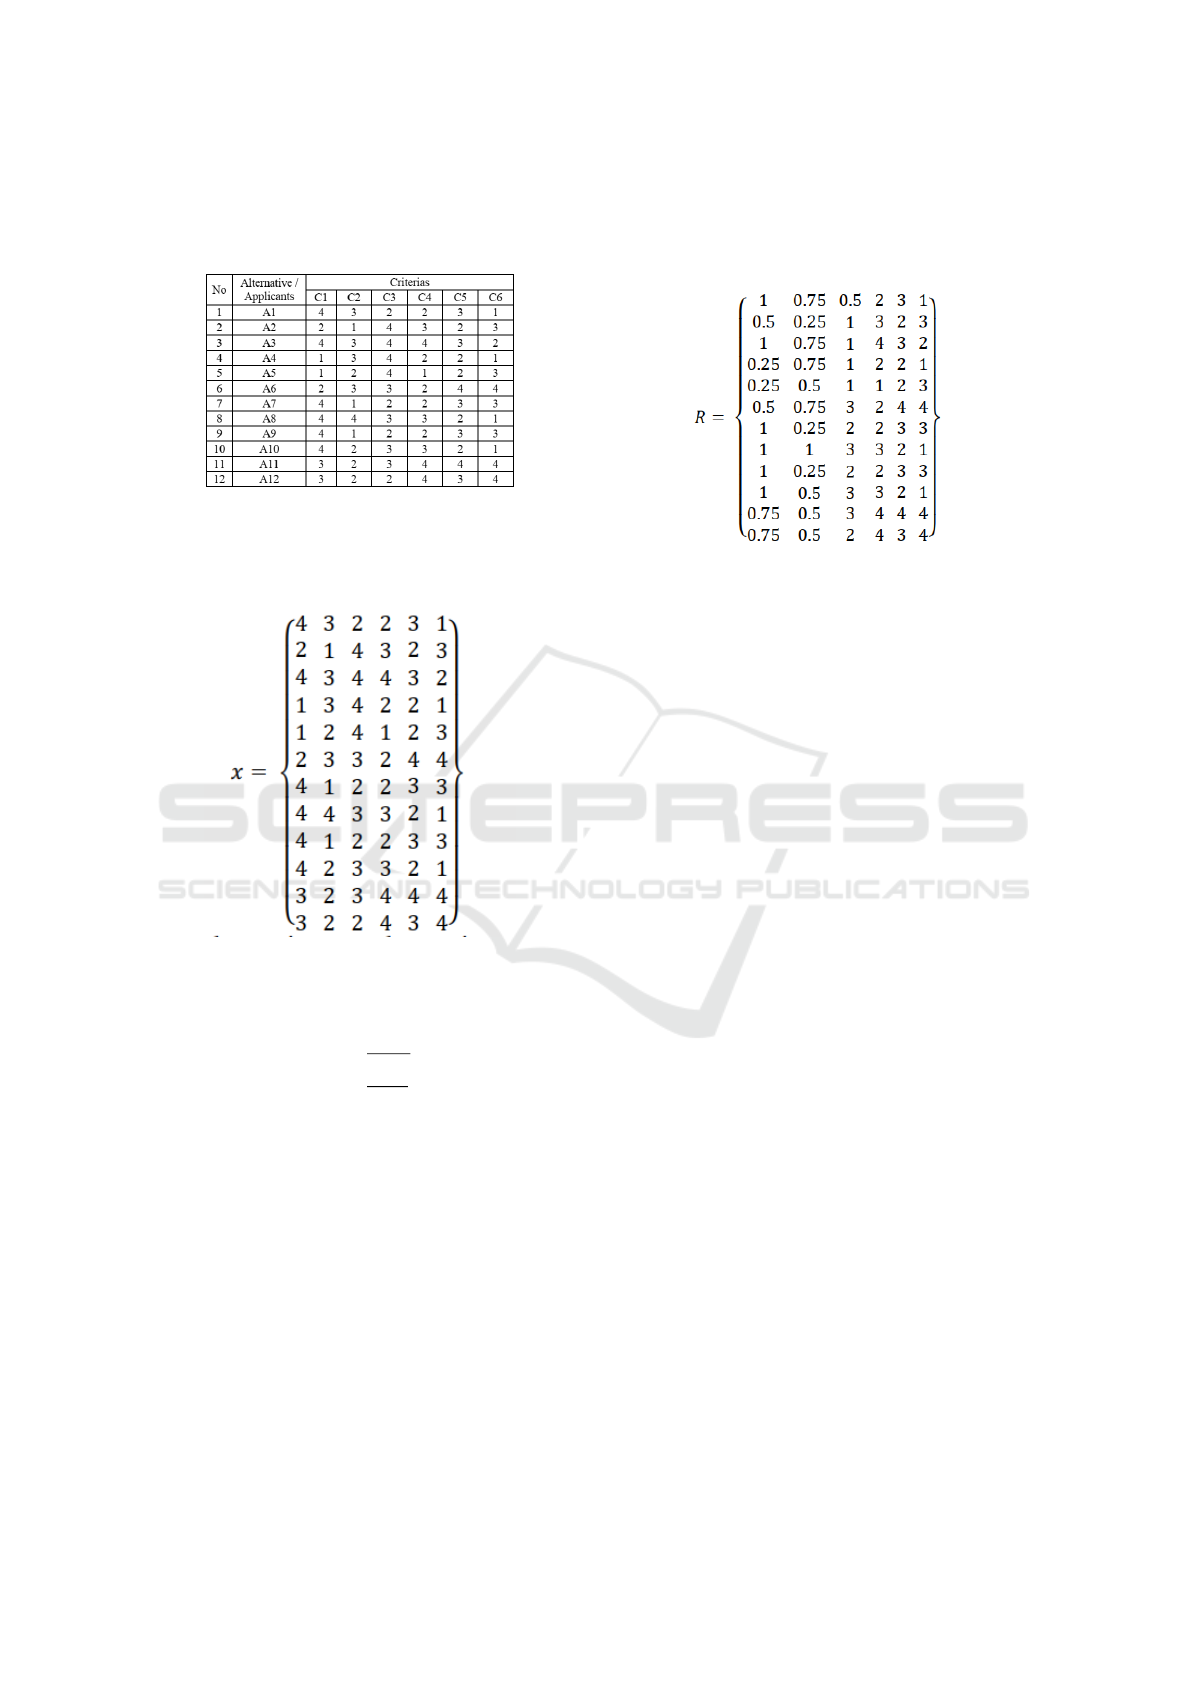
Based on the alternative suitability rating table and
the above criteria, an X decision matrix can be formed
(Figure 4) as follows.
Figure 4: Alternative match matrix and criteria
1) Normalizing the matrix X to be the matrix R
based on equation
r
i j
=
(
x
i j
Maxx
i j
Minx
i j
x
i j
The results of normalization of the X matrix are
obtained by the R matrix, presented in the following
Figure 5:
Figure 5: Matrix of normalization results
2) Perform ranking process by doing multiplica-
tion process using equation
v
i
= Σ
n
j=1
w
j
r
i j
(3)
The weight vector (W) that has been determined
is: W = [3, 4, 3, 3, 4, 4]
V1 = (3)(1) + (4)(0.75) + (3)(0.5) + (3)(0.5) +
(4)(0.75) + (4)(0.25) = 3 + 3 + 1.5 + 1.5 + 3 + 1 =
13
V2 = (3)(0.5) + (4)(0.25) + (3)(1) + (3)(0.75) +
(4)(0.5) + (4)(0.75) = 1.5 + 1 + 3 + 2.25 + 2 + 3 =
12.75
V3 = (3)(1) + (4)(0.75) + (3)(1) + (3)(0.5) +
(4)(0.5) + (4)(0.25) = 3 + 3 + 3 + 3 + 3 + 2 = 17
V4 = (3)(0.25) + (4)(0.75) + (3)(1) + (3)(0.5) +
(4)(0.5) + (4)(0.25) = 0.75 + 3 + 3 + 1.5 + 2 + 1 =
11.25
V5 = (3)(0.25) + (4)(0.5) + (3)(1) + (3)(0.25) +
(4)(0.5) + (4)(0.75) = 0.75 + 2 + 3 + 0.75 + 2 + 3 =
11.5
V6 = (3)(0.5) + (4)(0.75) + (3)(0.75) + (3)(0.5) +
(4)(1) + (4)(1) = 1.5 + 3 + 2.25 + 1.5 + 4 + 4 = 16.25
V7 = (3)(1) + (4)(0.25) + (3)(0.5) + (3)(0.5) +
(4)(0.75) + (4)(0.75) = 3 + 1 + 1.5 + 1.5 + 3 + 3 =
13
V8 = (3)(1) + (4)(1) + (3)(0.75) + (3)(0.75) +
(4)(0.5) + (4)(0.25) = 3 + 4 + 2.25 + 2.25 + 2 + 1
= 14.5
V9 = (3)(1) + (4)(0.25) + (3)(0.5) + (3)(0.5) +
(4)(0.75) + (4)(0.75) = 3 + 1 + 1.5 + 1.5 + 3 + 3 =
13
V10 = (3)(1) + (4)(0.5) + (3)(0.75) + (3)(0.75) +
(4)(0.5) + (4)(0.25) = 3 + 2 + 2.25 + 2.25 + 2 + 1 =
12.5
ICASESS 2019 - International Conference on Applied Science, Engineering and Social Science
92
V11 = (3)(0.75) + (4)(0.5) + (3)(0.75) + (3)(1) +
(4)(1) + (4)(1) = 2.25 + 2 + 2.25 + 3 + 4 + 4 = 17.5
V12 = (3)(0.75) + (4)(0.5) + (3)(0.5) + (3)(1) +
(4)(0.75) + (4)(1) = 2.25 + 2 + 1.5 + 3 + 3 + 4 = 15.75
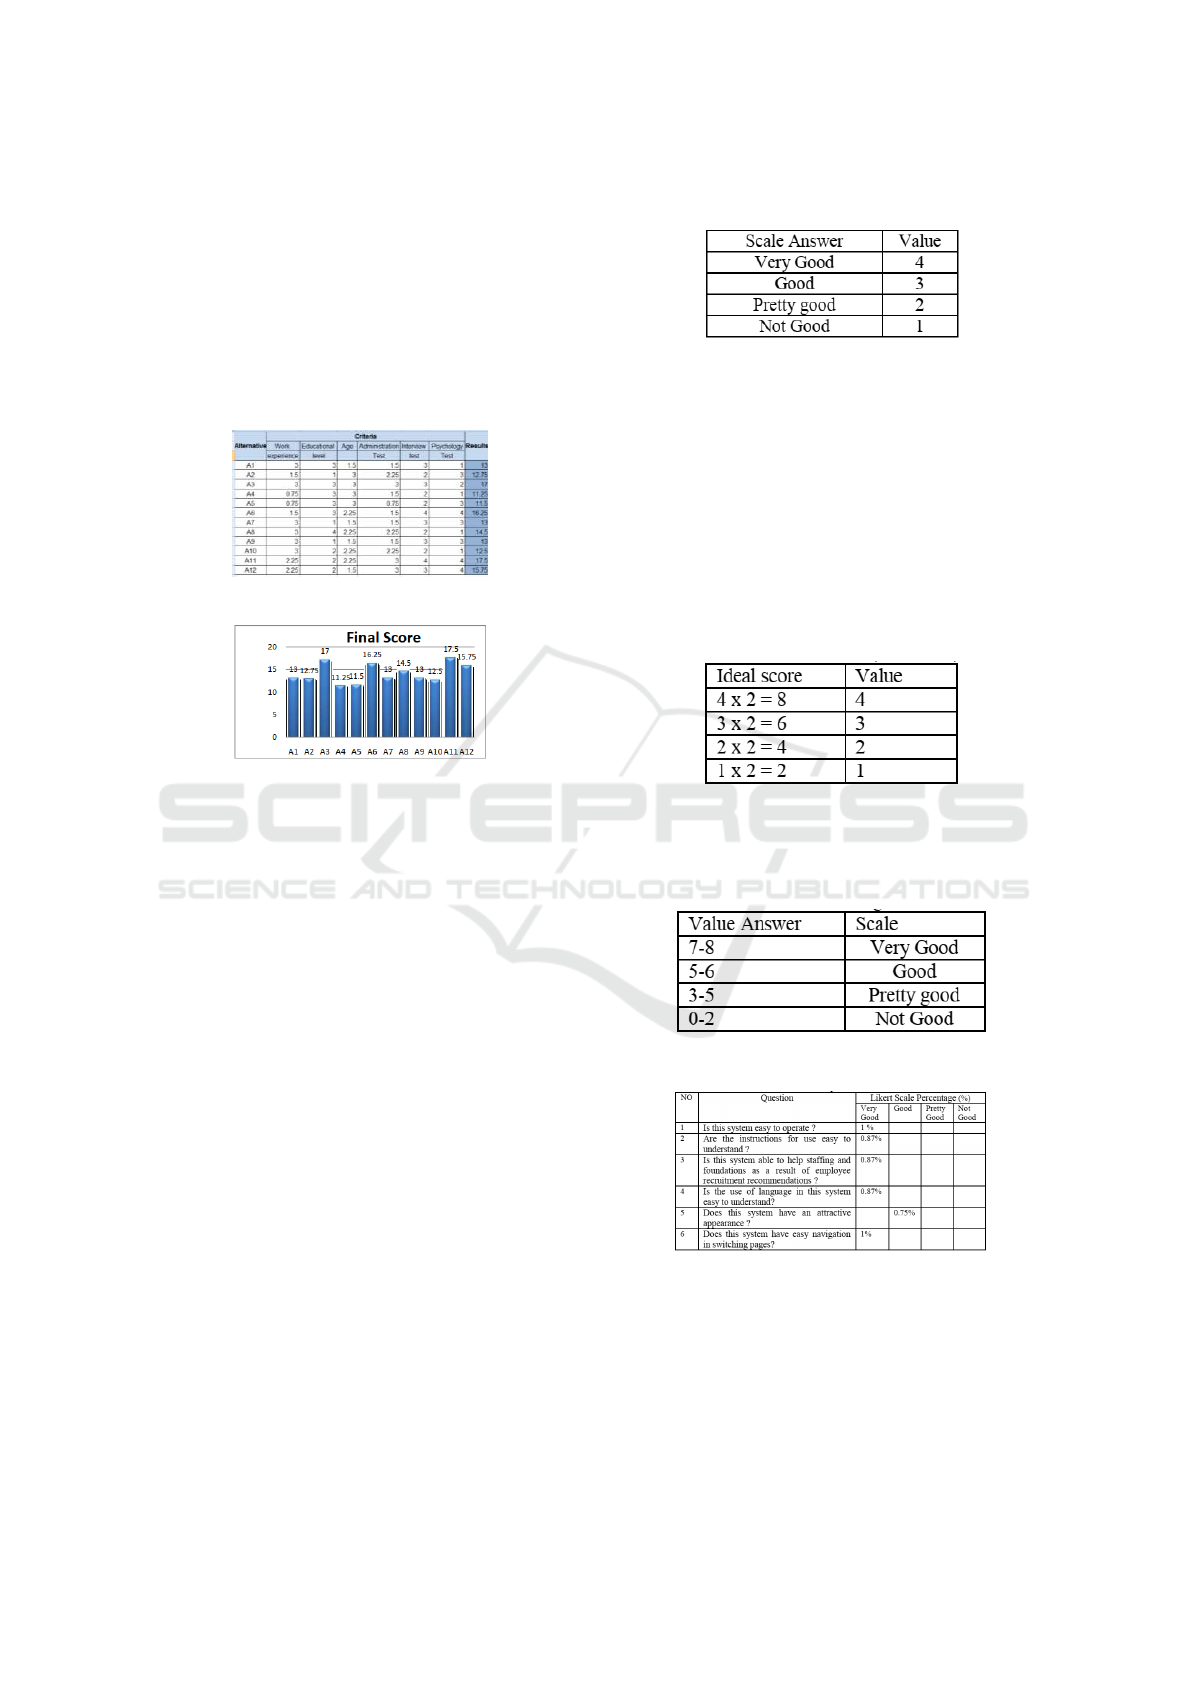
3) From the calculation of the final value, the
biggest value is found in V11 so that alternative V11
is the alternative chosen as the best alternative. The
following ranking for prospective applicants can be
seen in Figure 6 and Figure 7 below.
Figure 6: Ranking for prospective applicants.
Figure 7: Chart ranking prospective applicants
From the graph in Figure 7 above shows the first
rank 17.5 for A11 and second rank 17 for A3 as a
recommendation for hiring employees
3 RESULTS AND DISCUSSION
3.1 Test System for Users
In this study, there are 4 step in the trial Implementa-
tion of the SAW Method and Regression in the Em-
ployee Acceptance decision support system, as fol-
lows:
1. The technique used in this trial uses a question-
naire
2. The trial implementation of the SAW Method and
Regression in the Employee Acceptance System
was tested at the Janabadra University Campus
3. Determine the average user rating of the system
with a Likert scale
4. Calculate the percentage of user ratings of the sys-
tem.
(a) Determining the answer score, is the answer
value that will be given by the respondent
(Sugiyono, 2017), the answer score can be seen
in Figure 8 below:
space
Figure 8: Score Answers.
(b) Calculating the ideal score, is a score used to
determine the rating scale and the number of
all answers, (Sugiyono, 2017). To calculate the
number of ideal scores (criteria) of all items,
use the following formula:
CriteriumScore = Scalevaluex
Numbero f respondents (4)
The ideal score results are presented in Figure
9 below:
Figure 9: Ideal score (Kriterium).
(c) Calculating the Scale, the scores that have been
obtained are then entered into the rating scale
presented in Figure 10 below:
Figure 10: Skor rating scale.
Figure 11: User trials are presented.
Recommendation of SAW “Simple Additive Weighting” Model Employee Acceptance Decision Support System with Analysis Regression
93
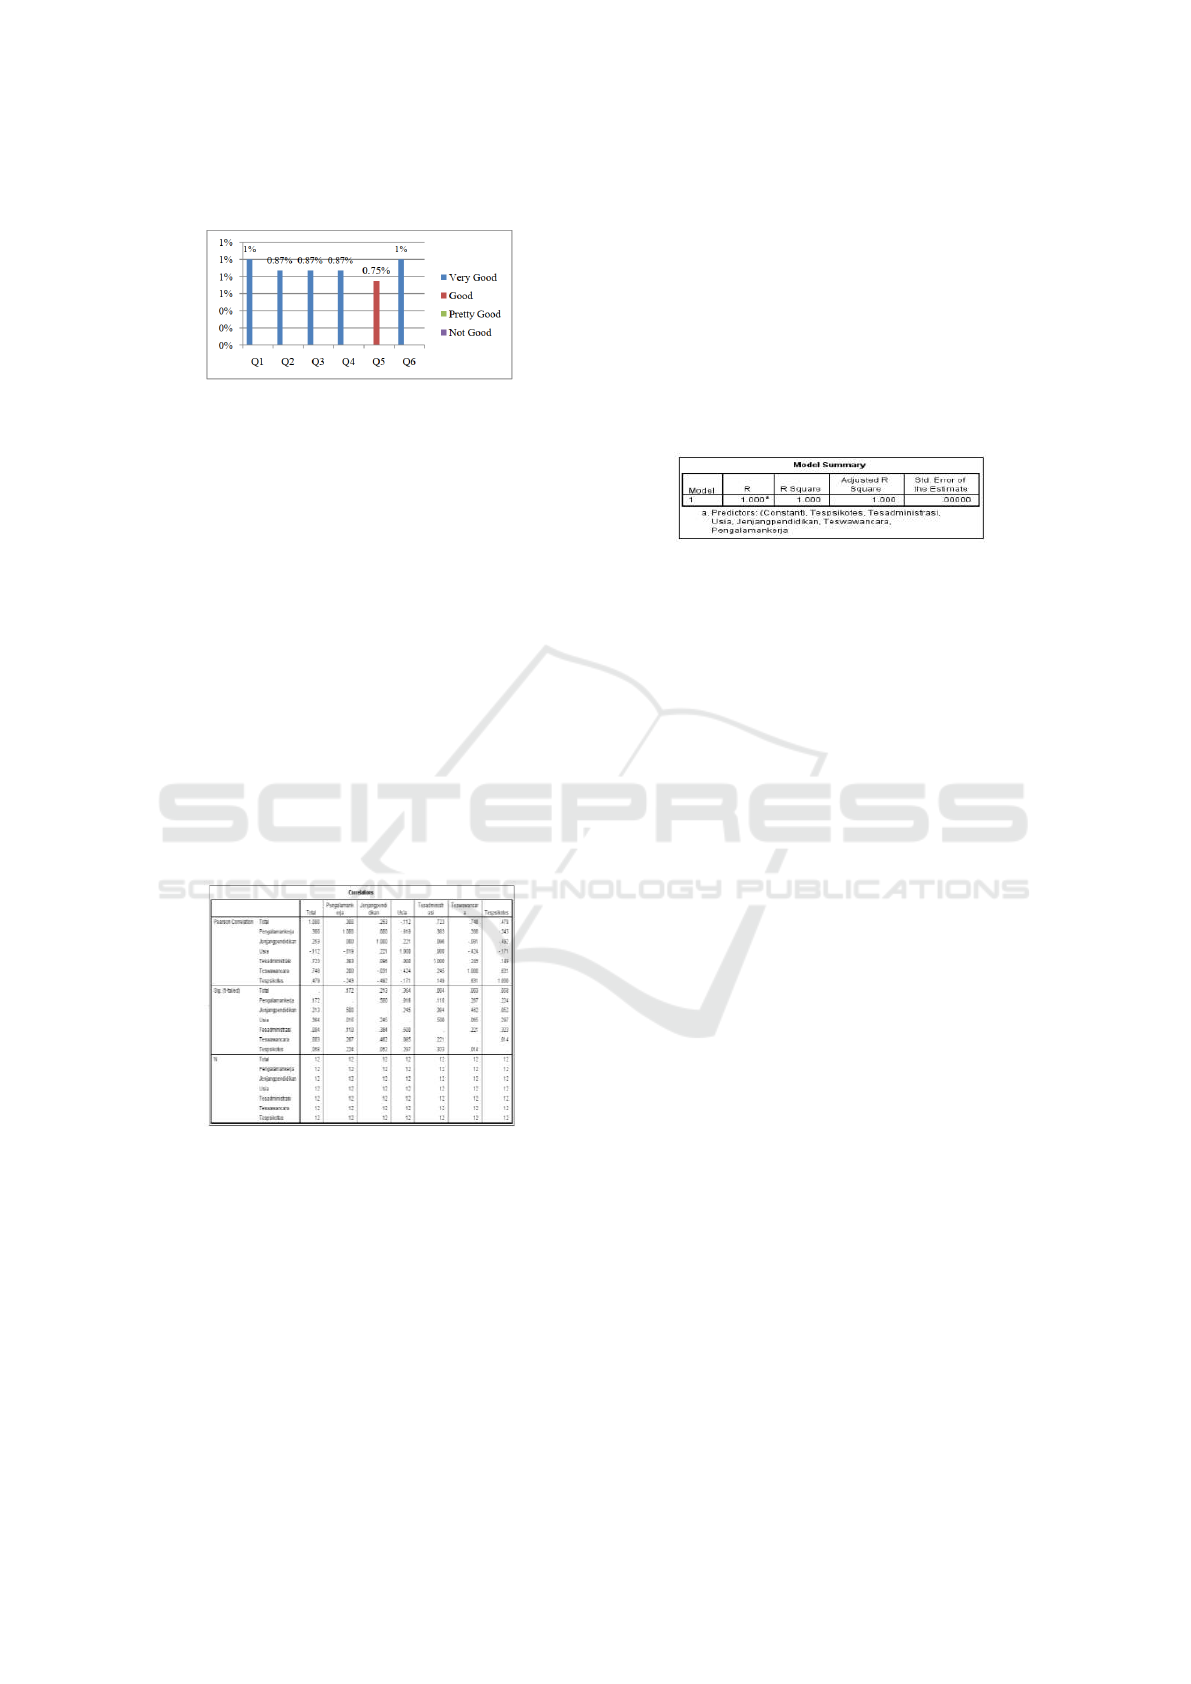
space
Figure 12: Percentage of System Assessment
From the graph in Figure 12 above shows Q1 1%
average value for very good, Q2 0.87% average value,
Q3 average value 0.87%, Q4 average value 0.87%, Q5
average value average average 0.75% and Q6 average
value of the average value of 1% of the results of the
quiz assessment of users.
3.2 Results of Correlation and
Regression Analysis
1. Correlation Analysis of Relationships between
Criteria
Correlation is a statistical method that is used to
test the presence of relationships and the direction
of relationships or two variables, (Ary, ).
The results of data processing (see below) to see
the relationship between criteria for employee ac-
ceptance using SPSS 17 software, can be seen in
Figure 13 below:
Figure 13: Correlation values between criteria
Correlation (relationship) Work Experience to
Levels of Education, Age, Administrative Tests,
Interview Tests and Psychological Tests. There
are four criteria that have a Sig (Significant)>
0.05 value which indicates a very high relation-
ship with Work Experience namely Education,
Age, Administrative Tests, Interview Tests, Psy-
chotest Tests while Age has a low relationship
with Work Experience because of the Sig (Signif-
icant) < 0.05.
2. Regression Analysis Based on the results of data
processing from each criterion as shown in figure
8, a regression (R) value of 1,000 is obtained. This
value (R) shows that the influence between inde-
pendent variables (Work Experience, Level of Ed-
ucation, Age, Administrative Test, Interview Test,
Psychological Test) with total dependent variable
(overall value) has a positive nature and has a very
strong relationship, because correlation value of
1,000. (Ary, ) And the coefficient of determi-
nation (R2 Square) is 1,000. This indicates that
the overall criteria greatly affect employee accep-
tance.
Figure 14: Results of Data Processing Criteria for Regres-
sion analysis
4 CONCLUSIONS
From the research that has been done, it can be con-
cluded as explained below:
1. Decision support system application for employee
acceptance method of Simple Additive Weighting
(SAW) and Regression that is built can help in
evaluating according to predetermined criteria, so
that there is no exact final value.
2. Based on the results of regression analysis for the
criteria used in building this application has an R-
sqaure value of 1,000, it can be recommended in
the employee acceptance decision support system
where the criteria have a very high relationship.
3. Correlation for the sixth criteria used in the as-
sessment of employee acceptance for each alter-
native candidate there are five criteria that can be
recommended in the employee acceptance deci-
sion support system, with the result that the corre-
lation criterion value for work experience is 0.300,
Educational Level criteria 0.253, Psychological
Test criteria 0.479, criteria for the Administrative
Test is 0.723 and the Criteria for the Interview
Test 0.748 shows a sufficient and very high re-
lationship, while for the age criteria -0.112 for a
weak relationship so it is not recommended.
ICASESS 2019 - International Conference on Applied Science, Engineering and Social Science
94

REFERENCES
Ary, M. Analisis korelasi & regresi sederhana menggu-
nakan spss 17.0.
De Christin, H. and Djamain, Y. (2015). Sistem pendukung
keputusan penerimaan pegawai baru pt. pln (persero)
kantor pusat dengan menggunakan metode simple ad-
ditive weighting (saw). Jurnal Teknologi dan Infor-
masi, 5(1):11–24.
Hidayat, S. (2015). Msdm pengujian seleksi karyawan.
Komalasari, N. (2020). Sistem pendukung keputusan ke-
laikan terbang (spk2t). Jurnal Industri Elektro dan
Penerbangan, 4(1).
N, B. (2014). Manajemen perusahaan seleksi sdm.
Palasara, N. (2017). Sistem pengambilan keputusan pemil-
ihan karyawan terbaik menggunakan metode analytic
hierarchy process. Bina Insani ICT Journal, 4(1):31–
46.
Rinianty, R. and Sukardi, S. Sistem pendukung keputusan
penerimaan karyawan menggunakan metode saw pada
cv. green advertising. Creative Communication and
Innovative Technology Journal, 11(1):48–57.
Sinaga, A. R., Marbun, M., and Siregar, J. S. (2016). Sistem
pendukung keputusan penerimaan karyawan dengan
metode saw pada pt. karya sahata medan. Journal Of
Informatic Pelita Nusantara, 1(1).
Sugiyono, P. (2017). metode penelitian bisnis.(suryandari
sofia yustiyani, ed.)(edisi 3).
Umar, R., Fadlil, A., and Yuminah, Y. (2018). Sistem pen-
dukung keputusan dengan metode ahp untuk penila-
ian kompetensi soft skill karyawan. Khazanah In-
formatika: Jurnal Ilmu Komputer dan Informatika,
4(1):27–34.
Recommendation of SAW “Simple Additive Weighting” Model Employee Acceptance Decision Support System with Analysis Regression
95
