
The Effect of Sticky Cost to Profit Prediction using the
Cost Variability and Stickiness Model at Manufacturing
Industry
Sri Mulyati
1
, Dy Ilham Satria
1
, Murhaban
1
, Maulida
2
, and Wardhiah
3
1
Department of Accounting Faculty of Economic and Bussiness Malikussaleh University,
Aceh, Indonesia
2
Graduation of Accounting Department Faculty of Economic and Bussiness,
Universitas Malikussaleh, Aceh, Indonesia
3
Department of Management Faculty of Economic and Bussiness Malikussaleh University,
Aceh, Indonesia
murhaban@unimal.ac.id,maulida.54@yahoo.com,wardhiah@unimal.ac.id
Abstract. This study aims to examine the effect of sticky cost on profit prediction
using the cost variability and cost stickiness (CVCS) model. This study also tries
to look at the relationship between sticky cost behavior on profit predictions. In
this study sticky costs are calculated with variables, namely sales, administration
and general costs. While profit predictions are measured by the model of cost
variability and cost stickiness (CVCS). Cost behavior has traditionally been an
important aspect of management accounting for analyzing profit for managers.
This cost behavior study is important, because of the uncertain future demand
faced by managers. The type of data used in this study is secondary data. This
research was conducted by taking a sample of 62 companies from 144 companies
on the manufacturing industry listed on the Indonesia Stock Exchange from
2014-2016. Sampling is done by purposive sampling method. Processing data is
done by multiple linear regression techniques and has met the classical
assumption test requirements. This study shows the results that the cost of sales
(X
1
) does not affect the profit prediction (Y), The second hypothesis testing X
2
has a significant effect on Y. The results of this study indicate the amount of
increase in sales, administrative and general costs when net sales rise is higher
than the magnitude of decrease in sales, administrative and general costs when
net sales fall. This means that there are sticky cost behaviors in sales,
administration and general costs in IDX manufacturing industry companies.
Keywords: Sticky cost ꞏ Sales cost ꞏ General and administrative costs ꞏ Profit
prediction
1 Background
Cost behavior has traditionally been an important aspect of management accounting for
analyzing profit for managers. The cost accounting literature explains 2 basic types of
cost behavior patterns, namely variable costs and fixed costs. These variable costs and
fixed costs can be used as components to analyze costs, volumes and profits (Garrison
and Noreen, 2002 in Banker and Chen, 2006). If this model is valid then estimation
364
Mulyati, S., Satria, D., Murhaban, ., Maulida, . and Wardhiah, .
The Effect of Sticky Cost to Profit Prediction using the Cost Variability and Stickiness Model at Manufacturing Industry.
DOI: 10.5220/0009870500002900
In Proceedings of the 20th Malaysia Indonesia International Conference on Economics, Management and Accounting (MIICEMA 2019), pages 364-373
ISBN: 978-989-758-582-1; ISSN: 2655-9064
Copyright
c
2022 by SCITEPRESS – Science and Technology Publications, Lda. All rights reserved

using past data can be used as a basis for predicting future profit (Banker and Chen,
2006).
Several companies listed on the Indonesia Stock Exchange (IDX) are many that link
the decline or increase in profits with production, sales and efficiency activities. As PT
Mayora Indah Tbk (MYOR) decided to cut its net profit target this year (2014). Based
on public exposures, MYOR predicts profit will drop 20% compared to 2013. MYOR
said there are three obstacles that will be faced, namely the global economic situation,
competition and stability of supply and prices of raw materials. This study tries to look
at the relationship between sticky cost behavior on profit predictions. In this study
sticky costs are calculated with variables, namely sales, administration and general
costs. While profit predictions are measured by the model of cost variability and cost
stickiness (CVCS).Related to research on profit predictions, there have been several
studies analyzing them, some of them analyzing the Effect of Sticky Cost Behavior on
Profit Prediction Using the Model Variability and Cost Stickiness (CVCS) conducted
by Hidayatullah I. J (2011). The results showed that the effect of sticky cost on profit
predictions using the cost variability and cost stickiness (CVCS) models was very
small, but the accuracy of the model was better than the simple ROE model.Research
conducted by Susilo (2016) which analyzes Sticky Cost Behavior and Its Effect on
Profit Prediction Using Cost Variability and Cost Stickiness (CVCS) Models on Issuers
on the IDX for Manufacturing Industry . The test results show that the variation in
administrative and general marketing costs (PA&U) when net sales have increased is
greater than when net sales have decreased. This means marketing, administrative and
general costs are sticky . This gives a signal that sticky cost behavior needs to be
considered in predicting profit. Variation in cost of goods sold (COGS) when net sales
have increased slightly smaller than when net sales have decreased. This means that the
cost of goods sold is not sticky . This is because the cost component of cost of sales is
largely are variable costs which rise and decline greatly influenced by the volume of
sales. The effect of sticky cost on profit predictions using the costvariability and cost
stickiness (CVCS) models is very small, but the accuracy of the model is better than
the simple ROE model.
Based on the above phenomenon, the researcher is interested in reexamining "The
Effect of Sticky Cost on Profit Prediction Using the Model Variability and Cost
Stickiness (CVCS). (For Issuers on the Indonesia Stock Exchange for
Manufacturing Industry for the 2014-2016 Period) ".
Prior Research. There are several previous studies that have tried to reveal the effect
of sticky cost behavior on profit predictions using the model of cost variability and cost
stickiness (CVC). In the first study conducted by Susilo (2016), with the title Effect of
Sticky Cost Behavior on Profit Prediction Using the Cost Variability and Cost
Stickiness (CVCS) Models . With the results of the study show that the variation in
marketing, administrative and general costs (PA&U) when net sales have increased is
greater than when net sales have decreased. This means the marketing,
administrationand general costs are sticky .In the second study conducted by Ratnawati
and Nugrahanti (2015), with the title Sticky Cost Behavior in Sales, Administration and
General Costs and Cost of Sales in Manufacturing Companies. With the results of the
study that Based on the results of the first hypothesis test that has been done, it is
concluded that there are indications of sticky cost behavior in sales, administration and
general costs of manufacturing companies on the Indonesia Stock
Exchange. The third
The Effect of Sticky Cost to Profit Prediction using the Cost Variability and Stickiness Model at Manufacturing Industry
365
Profit
Prediction
study was conducted by Apriliawati and Nugrahanti (2015), with the title Sticky Cost
Behavior on Sales, Administration and General Costs. With the results of research that
show that the results of the first hypothesis testing, found indications of sticky cost
behavior in sales, administrative and general costs in manufacturing companies in
Indonesia 2009-2012. The fourth study was conducted by Hidayatullah, et al (2011),
with the title Effect of Sticky Cost Behavior on Profit Predictions Using Cost
Variability and Cost Stickiness (CVCS) Models . With the results of the study show
that the variation in marketing, administrative and general costs (PA&U) when net sales
have increased is greater than when net sales have decreased. This means the marketing,
administration and general costs are sticky.
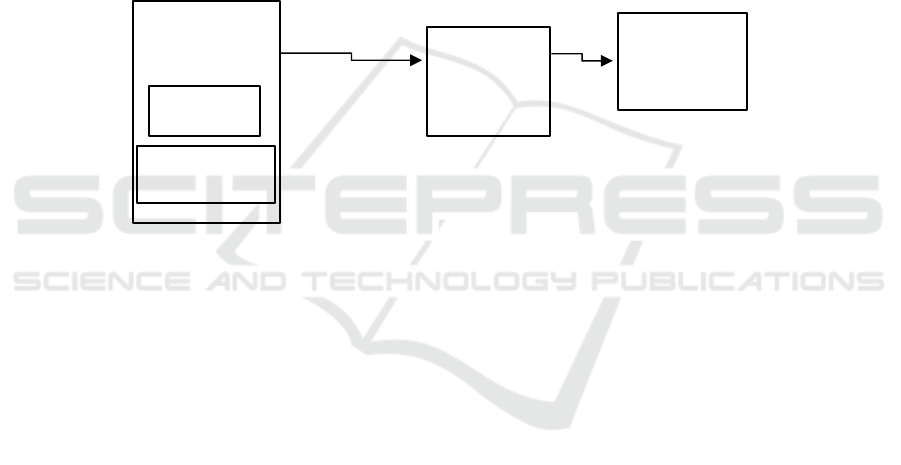
Conceptual Framework. Relationship of Sticky Cost Behavior (sales, administrative
and general costs) to the variable predicted profit. can be described as follows:
Relationship of Sticky Cost Behavior (sales, administrative and general costs) to the
variable predicted profit. can be described as follows:
Fig. 1. Conceptual Framework.
Hypothesis. Based on the theoretical basis and the results of previous studies that have
been described, the hypotheses formulated are as follows:
- Sales costs affect the earning prediction.
- Administrative and general sales costs affect profit predictions.
Research Sites. The location of this research is for manufacturing industry companies
listed on the Indonesia Stock Exchange in the 2014-2016 period.
Population and Sample. The population used in this study are all manufacturing
industry companies listed on the Indonesia Stock Exchange (BEI) from 2014 to 2016,
with the aim of knowing how the company's profit prediction development over time.
The company issued financial statements for the period ended December 31, 2014 to
December 31, 2016.
Data Collection Technique. The data collection method in this research is by
conducting a documentation study on the audited financial statements of manufacturing
industry companies in the 2014-2016 period.
Model Cost
Variability
dan Cost
Stickiness
Sticky Cost
Behaviour
Sales Cost
administration
& general cost
MIICEMA 2019 - Malaysia Indonesia International Conference on Economics Management and Accounting
366

Data Types and Sources. The type of data used in this study is secondary data. This
study obtained necessary data from food and beverage sector companies manufacturing
companies listed on the Indonesia Stock Exchange (IDX), namely the annual financial
statements of companies that have been audited and listed in 2014-2016. Data obtained
by accessing the Indonesia Stock Exchange's website (www.idx.co.id).
2 Operational Definitions of Research Variable
The definitions of each variable are as follows:
Cost Behavior. Garrison and Noreen (2002) in Banker and Chen (2006) define
boarding behavior which is defined as how the boarding will change in the level of
activity that occurs. Managers who understand boarding behavior will be better at
predicting what will happen to the boarding path in several operating situations, making
it easy to plan their activities, results and profits. One of the causes of stickycost on
sales, administration and general costs arises because of decisions taken by managers
whose aim is to maximize profits but are seen as inefficient from the owner's side
(Jensen and Meckling, 1976).
Profit Prediction. Profit prediction is an estimate of the amount of profit or excess
income over costs in return for producing goods and services over an accounting period
for the future. To know the profit prediction, the cost variability and cost stickiness
(CVCS) models are used . Banker and Chen (2006) make a CVCS model based on
accounting profit ( Et ) assumptions in period t , measured from sales revenue ( St )
minus costs ( Ct ):
Et = St - Ct
Information:
Et: accounting profit
St: sales revenue
Ct: costs
Classic Assumption Test. Testing of classical assumptions aims to find out whether a
regression model is good or not if used to do the assessment. A model is said to be good
if it is BLUE ( Best LinearUnder Estimator ), which fulfills classical assumptions or
avoids problems of normality, multicollinearity, heteroscedasticity and autocorrelation.
Therefore in this study a classical assumption is tested, whether deviations occur or not,
so that the research model is feasible to use. The classic assumption tests used in this
study are the normality test, the multicollinearity test, the autocorrelation test, and the
heterokedasticity test.
Normality Test. The normality test aims to test whether in the regression model,
confounding or residual variables have a normal distribution. We can see from the
normal probability plot that compares the cumulative distribution with the normal
distribution. The normal distribution forms a diagonal straight line, and plotting
The Effect of Sticky Cost to Profit Prediction using the Cost Variability and Stickiness Model at Manufacturing Industry
367

residual data will be compared with the diagonal line. If the data is normally distributed,
then the lines that describe the actual data will follow the normal line, Ghozali (2011:
110). There are two ways to detect whether residuals are normally distributed or not,
namely by graphical analysis and statistical tests, Ghozali (2011: 111).
Graph Analysis. One of the easiest ways to see residual normality is to look at the
histogram chart. A more reliable method is to look at the normal probability plot that
compares the cumulative distribution from the normal distribution. The normal
distribution will form a straight diagonal line and the ploting of residual data will be
compared with the diagonal line. If the distribution of residual data is normal, then the
line that represents the actual data will follow the diagonal line, Ghozali (2011: 161).
Statistic Analysis. Tests for normality with graphs can be misleading if you are not
careful visually it looks normal, even though statistically it can be the opposite.
Therefore it is recommended in addition to the graph test equipped with statistical tests,
Ghozali (2011: 163). Another statistical test that can be used to test residual normality
is the Kolmogorov-Smirnov (KS) non-parametric statistical test, namely by first
determining the testing hypothesis, namely:
If the significance is> 0.05, then the data is normally distributed
If the significance is <0.05, then the data is not normally distributed.
Multicollinearity Test. This test was conducted to test whether the regression model
found a correlation / relationship between independent variables . A good regression
model should not occur correlation between independent variables . If there is a
correlation, then these variables are not orthogonal . Variable orthogonal are variables
independent the correlation values between the members of variables independently
equal to zero, Ghozali (2005: 91).
In this study, to detect the presence or absence of multicollinearity in the regression
model used a correlation matrix of independent variables , and see the value of
Tolerance and Variance Inflation Factor (VIF) with calculations using SPSS program
assistance. Testing the presence or absence of multicollinearity symptoms is done by
taking into account the value of the correlation matrix produced during data processing
and the value of VIF and tolerance . If the value of the correlation matrix between
independent variables has a fairly high correlation (generally above 0.90) then this is
an indication of multicollinearity problems, and vice versa. And the cut-off value that
is generally used to indicate the absence of multicollinearity problems is Tolerance >
0.10 or equal to VIF value <10, Ghozali (2005: 92-93).
3 Heteroscedasticity Test
This test aims to test whether in the regression model there is a similarity in variance
from the residuals of one observation to another. If the variance shows a fixed pattern,
it can be stated that there was no heteroscedasticity. If the variance of the residuals from
one observation to another is fixed, then it is called homokedasticity, and if it is different
is called heteroscedasticity, Ghozali (2005: 105). To detect the presence or absence of
heteroscedasticity, it can be done using a Scatterplot chart . A good regression model
MIICEMA 2019 - Malaysia Indonesia International Conference on Economics Management and Accounting
368

is a homokedastisitas or heteroscedasticity does not occur.The basis of the analysis is,
Ghozali (2005: 105):
If there are certain patterns, such as dots that form a regular pattern (wavy, widened
and then narrowed), then it indicates heteroscedasticity has occurred.
If there is no clear pattern, and the points above and below the number 0 (zero) on
the Y axis, then there is no heteroscedasticity.
Autocorrelation Test. This test aims to test whether in the linear regression model
there is a correlation of confounding errors in period t, with confounding errors in
period t-1 (previous period). If there is a correlation, then there is a problem called
autocorrelation. Autocorrelation arises because observations that aim all the time are
related to one another, Ghozali (2005: 95).
Data Analysis Method. This study uses a calculation model developed by Anderson
et al. (2003), and used in the research of Subramanyan and Weidenmier (2003),
Windyastuti and Biyanto (2005), Hidayatullah et al. (2011) to find stickycost
indications on sales, administrative and general costs. The explanation of the regression
model is as follows:
Y = a + b
1
X
1
+ b
2
X
2
+ e
Information:
Y = Profit Prediction
A = constant
b
1
-b
2
= Regression coefficient for each variable
X
1
= Cost of Sales
X
2
= Administrative and General Costs
e = standard error
Hypothesis Testing. Statistical tests on multiple linear regression aim to prove the
hypothesis of the presence or absence of a significant or strong influence then it is
performed by t test.
Partial Test (t-test). This test is based on a comparison of the
calculated
t value of each
regression coefficient with the value of t
table
with a significant level of 5% with degrees
of freedom df = (nk), where n is the number of observations and k is the number of
variables.
If t
arithmetic
<t
table
(nk), then the independent variable has no effect on the dependent
variable .
If t
arithmetic
> T
table
(nk ), then the independent variable influences the dependent variable
Statistical Testing. The analysis in this study uses multiple regression analysis which
functions to analyze the presence or absence of influence between the two variables,
namely the independent variable and the dependent variable. To determine the effect of
the theme of environment and energy, social themes, the theme of labor and consumer
and product of the k inerja k euangan p ompany used the regression equation:
Y = a + b
1
X
1
+ b
2
X
2
+ e
The Effect of Sticky Cost to Profit Prediction using the Cost Variability and Stickiness Model at Manufacturing Industry
369

Data testing was performed with the help of the SPSS ( Statistical Package for the
Social Sciences ) computer program . After processing the data, the results of the
regression analysis are as shown in the following table:
Table 1.
Model
Unstandardized
Coefficients
Standardized
Coefficients
B
Std.
Erro
r
Beta
1 (Constant)
9,305 .869
X
1
-.032 122 -.031
X
2
.923 .118 .948
Dependen
t
Variable: Y
4 Results of Multiple Regression Analysis
Source: research results, 201 6
Based on the results of the analysis of the regression model shown in Table 4. 4
above, it can be arranged into multiple linear regression as follows:
Y = 9.305-0.032X1 + 0.923 + e
From the regression equation it can be seen that the magnitude of a constant value
of 9 , 305 (930.5%) means that if the influence variables X
1
and X
2 are
considered
constant, then the magnitude of Y is 930.5% . Regression coefficient value X
1
of -0.032
indicates negatifyang relationship meant that any drop of X
1
by 1 00 % then causes Y
m en urun amounted to -3 , 2%, assuming other independent variables constant.
Regression coefficient value X
2
for 0, 923 shows the relationship positive which
gives the sense that any increase in X
2
for 1 00 % then causes Y m eningkat by 92 , 3%
assuming other independent variables constant.
4.1 Correlation Analysis and Determination
Table 2. Correlation and Determination Analysis Results.
Model R R Square Adjusted R Square Std. Error of the Estimate
1 .919
a
.845 .840 2.14823
Source: Research Results, 2018
Based on the table above can be seen the value of the correlation coefficient (R) of
0.919 indicates that there is a relationship which is significant / strong among
independent variables on the dependent variable amounted to 91.9% , while the value
of adjudted R
2
is 0.840, this shows that the variation of the independent variable
MIICEMA 2019 - Malaysia Indonesia International Conference on Economics Management and Accounting
370

capable explain the variation of the dependent variable by 84%, while the remaining
16% is explained by other variables outside the model.
Hypothesis Testing. To prove the hypothesis in this study whether the independent
variables affect the dependent variable, then several tests are used, namely:
Partial Influence (t test). Partial effect was carried out using t test statistics. This test
aims to determine whether the independent variables included in the model are able to
explain the dependent variable individually. The test results can be seen in the table
below:
Table 3. Partial Analysis Results (t test).
Model
Unstandardized
Coefficients
Standardized
Coefficients
t
Si
g
. B Std. Erro
r
Beta
1 (Constant) 9,305 .869 10,704 .000
Sales fee -.032 122 -.031 -.260 .796
Administration
an
d
g
eneral fee
.923 .118 .948 7,842 .000
Source: Research 2016
From the above table it can be seen that the
calculated
t value of X
1
is -0 , 260 with a
significant value of 0.796, while the value of t
table
with (df) = nk (62 - 3 = 59) at α =
0.05 obtained values amounted to 1,671. Thus t
count
<t
table
is -0.260 <1.671 and 0.796
significant level, then X
1
no effect on Y .
The first hypothesis testing X
1
does not significantly influence Y. The magnitude
of the increase in sales, administrative and general costs when net sales rise is higher
than the magnitude of the decrease in sales, administrative and general costs when net
sales fall. This means that there are sticky cost behaviors in sales, administration and
general costs in BEI manufacturing industry companies, Anderson, et al (2003).
However, the results of this study indicate that the increase in sales, administrative and
general costs when net sales fluctuate compared to the magnitude of the decrease in
sales, administrative and general costs when net sales rise, so there is no sticky cost
behavior in sales, administration and general costs.
This study shows the results that the cost of sales (X
1
) does not affect the earning
prediction (Y), this is in accordance with research conducted by
From Table 4.6 it can be seen that the value of t
arithmetic
of X
2
is equal to 7 , 842 with
significant value is 0,000, while the value of t
table
with (df) = nk (62-3 = 59) at α = 0.05
was obtained a value of 1.671 . Thus the t
count
> t
table
is 7.842> 1.671 and significant
level of 0.000, then X
1
influence on Y . This is according to research conducted by
Susilo (201 6 ) X
2
effect on Y .
The second hypothesis testing X
2
has a significant effect on Y. The results of this
study indicate the amount of increase in sales, administrative and general costs when
net sales rise is higher than the magnitude of decrease in sales, administrative and
general costs when net sales fall. This means that there are sticky cost behaviors in
The Effect of Sticky Cost to Profit Prediction using the Cost Variability and Stickiness Model at Manufacturing Industry
371

sales, administration and general costs in BEI manufacturing industry companies,
Anderson, et al (2003).
This study shows the results that administrative and general costs (X
2
) affect
profitpredictions (Y), this is consistent with research conducted by Susilo (2016) where
administrative and general costs affect profit predictions , with the title of his research
" Effect of Sticky Behavior Cost Against Profit Prediction Using the Cost Variability
and Cost Stickiness (Cvcs) Model ". Also in accordance with research conducted by
Nugrahanti (2015) where the results of the study showed indications of behavior at
administrative and general costs, with the research title " Sticky Cost Behavior in Sales,
Administration and General Costs and Cost of Sales in Manufacturing Companies".
References
Anderson, M. C., Banker, R. D. And Jankiraman, S. N. (2003). Are Selling,General, and
Administrative Costs “Sticky”?. Journal Of Accounting Research. Vol 41, No. 1.
Atkinson, A., Banker, R., Kaplan, R.S. (1995).Management Accounting. NewJersey:Prentice-
Hall International. Inc.
Banker, R. D. and Chen, Lei (2006). Predicting Earning Using A Model Based On Cost
Variability and Cost Stickiness. The Accounting Review Vol. 81, No. 2.
Cooper, R., and R. Kaplan (1998). The Design Of Cost Management Systems:ext, Cases, And
Readings. Upper Saddle River, Nj: Prentice Hall.
EkoSusilo, (2016). “Analisis Perilaku Sticky Cost dan Pengaruhnya Terhadap Prediksi Laba
Menggunakan Model Cost Variability dan Cost Stickiness (CVCS) Pada Emiten Di BEI
Untuk Industri Manufaktur”,Jurnal Vol. 2No. 2, Januari 2016
Ghozali, Iman. (2005). Aplikasi Analisis Multivariate Dengan Program SPSS. Badan Penerbit
Universitas Diponegoro Semarang.
___________. (2011 “AplikasiAnalisisMultivariat Dengan Program IBM SPSS 19”.Badan
Penerbit Universitas Diponegoro.
Harahap, SofyanSyafri, (2009). “Analisis Kritis Atas Laporan Keuangan”. Jakarta: RajaGrafindo
Persada.
Hidayatullah, IJ., et al., (2011), “Analisis Perilaku Sticky Cost dan Pengaruhnya Terhadap
Prediksi Laba Menggunakan Model Cost Variability dan Cost Stickiness (CVCS) Pada
Emiten Di BEI Untuk Industri Manufaktur”,SNA, Availableat SNA:
sna.akuntansi.unikal.ac.id/ makalah/029AKPM45.pdf
Horngren, C. T., Foster, G., Datar, S. M. (1997). Cost Accounting A Managerial Emphasis.
9
Th
Editions. New Jersey: Prentice Hall International Edition.
Husein, Umar. (2001). Strategic Management In Action.Edisi 1, Jakarta:Gramedia Pustaka
Utama. Jensen, M. C. dan W. H. Meckling (1976). Theory ofThe Firm: Managerial
Behavior,Agency Cost, and Ownership Structure.Journal of Financial Economics 3, 305-360
Lea Ratnawati danYeterina Widi Nugrahanti, (2015). “Perilaku Sticky Cost Biaya Penjualan,
Administrasi Dan Umum Dan Harga Pokok Penjualan Pada Perusahaan Manufaktur”. Jurnal
Ekonomi Dan Bisnis Fakultas Ekonomika Dan Bisnis Vol. Xviii No 2 Edisi Agustus 2015
Universitas Kristen Satya Wacana Issn :1979-6471
Malcom, Robert E. (1991). Overhead Control Implications of Activity Costing. Accounting
Horizons.
Risvia Apriliawati dan Yeterina Widi Nugrahanti, (2015). “Perilaku Sticky Cost Pada Biaya
Penjualan, Administrasi Dan Umum”, Jurnal Universitas Kristen Satya Wacana.
Sugiyono. (2013). Metode Penelitian Pendidikan.= Edisi 16. Bandung: Alfabeta.
Suwardjono. (2008). Teori Akuntansi: Perekayasaan Pelaporan Keuangan.Yogyakarta:BPFE.
MIICEMA 2019 - Malaysia Indonesia International Conference on Economics Management and Accounting
372

Weis, D., 2010, “Cost Behavior And Analysts Profit Forecast”. The Accounting Review Vol. 85,
No. 4 Windyastuti Dan FrastoBiyanto (2005). Analisis Perilaku Kos : Stickiness Cost
Pemasaran, Administrasi & Umum Pada Penjualan Bersih. Sna VIII Solo,15 – 16 September
2005.www.idx.co,id
Yasukata, K., Kajiwara , T., 2011, "Are 'Sticky Costs' The R esult of Deliberate Decision of
Managers ?", Working Paper, Available at SSRN: http: // ssrn . com / abstract = 1444746 or
http: //dx.doi . org / 10.2139 / ssrn.1444746
The Effect of Sticky Cost to Profit Prediction using the Cost Variability and Stickiness Model at Manufacturing Industry
373
