
Comparison of Waiting Times at Patient Satisfaction Level at
Moestopo University Dental and Oral Hospital
Sulistyaningsih, Tria Saras Pertiwi and Witri Zuama Qomarania
Program Studi Manajemen Informasi Kesehatan, Fakultas Ilmu-Ilmu Kesehatan,
Universitas Esa Unggul, Jakarta, Indonesia
Keywords: Patient Satisfaction, Waiting Time.
Abstract: Patient satisfaction is an indicator of the quality of health services at Prof. Dr. Moestopo (Beragama) Oral
and Dental Hospital (RSGM) Bintaro. Based on the preliminary survey, it was found that the waiting time
for outpatient services exceeded the standard (> 60 minutes) at RSGM. This study aims to determine the
comparison of waiting time-based on the level of patient satisfaction. This study uses a quantitative
approach with an observational survey and a cross-sectional design. The population in this study was 11,668
patients and the sample size was 100 patients. Data collection using questionnaires, with data analysis using
one-way Anova test. Anova one way test results obtained that there is a significant difference in waiting
time with the level of patient satisfaction, based on p-value 0,000 <0.05, a significant difference in waiting
time occurs between groups of respondents dissatisfied with groups of respondents who are satisfied and
very satisfied. Therefore the Hospital should provide comfortable and adequate facilities in the patient
waiting room to avoid the patient feeling saturated. The medical staff (doctors and nurses) have the
commitment and time discipline to provide services in accordance with a predetermined schedule.
1 PRELIMINARY
Waiting time is the time used by patients to get
outpatient and inpatient services from the place of
registration to enter the doctor's examination room.
Patient waiting time is one component that has the
potential to cause dissatisfaction. Patients will
consider bad health services if the pain does not heal
- heal, long queues, and health workers are not
friendly even though professional. Health
Information Canada reports that for 90% of visits to
units Long waiting times for patients are usually
seen in outpatient facilities, and this difficulty
contributes to various public health problems,
including disruption of access to care, disruption to
hospital work patterns, and patient dissatisfaction.
Canada's emergency department, the actual time
spent from triage to the initial assessment of the
doctor is far longer than the recommended response
time. The actual waiting time is 47 to 229 minutes,
compared to the recommended standard of up to 120
minutes. Whereas according to MO Oche and H
Adamu Sixty-one percent (59/96) of respondents
waited 90-180 minutes in the clinic, while 36.1%
(35/96) patients spent less than 5 minutes with
doctors in the consultation room. The most common
reason for long waiting times in GOPD is the large
number of patients with few health care workers.
Service time is the minimum time spent serving
patients from the initial entry to the clinic. Service
time is one of the factors that can be used to measure
the effectiveness of an organization consisting of
punctuality and speed. The accuracy and speed of
service time are related to patient satisfaction.
According to Nur Laeliyah and Heru Subekti, the
average waiting time for patient services in the
outpatients of Indramayu Regency Hospital is 70.18
minutes and most of the categories are long time (>
60 minutes). The level of satisfaction in the
moderately satisfied category, based on five
dimensions of service quality is found in the
dimensions of tangibles, responsiveness, assurance,
and empathy in the moderately satisfied category
while in the reliability dimension in the satisfied
category. The relationship between waiting time for
outpatient patient care and patient satisfaction with
outpatient care at Indramayu District Hospital is
indicated by p = 0.042 or chi-square correlation
value of 4.135.
184
Sulistyaningsih, ., Pertiwi, T. and Qomarania, W.
Comparison of Waiting Times at Patient Satisfaction Level at Moestopo University Dental and Oral Hospital.
DOI: 10.5220/0009581201840188
In Proceedings of the 1st International Conference on Health (ICOH 2019), pages 184-188
ISBN: 978-989-758-454-1
Copyright
c
2020 by SCITEPRESS – Science and Technology Publications, Lda. All rights reserved
Problems Waiting Time (queuing) Patients also
occur in the Moestopo Hospital, which is in the
implementation of patient service waiting time is
still not going well and less than the maximum,
especially what happens to old patients. As a result,
there are still some whose patients wait a long time
to get services starting from the patient registering
until the patient is called/entered the clinic, which in
turn will indirectly have an impact on patient
satisfaction with the services provided. Tools used
by using questionnaires given to the patient.
2 RESEARCH METHODS
This type of research is observational analytic with
cross-sectional design. It is descriptive because it
describes patient satisfaction and is analytic because
the researcher wants to know the difference in
average waiting time on the level of patient
satisfaction. The population of this study was 11,668
old patients who visited the Moestopo Bintaro
Dental and Mouth Hospital with a sample size of
100 patients. The sampling technique is Nonrandom
sampling by Proportional Sampling sampling, which
is taking a sample that takes into consideration
elements or categories in the study population. The
instrument used was a questionnaire given to
patients and an observation sheet to determine the
difference in waiting for time-based on the level of
patient satisfaction at the Moestopo Bintaro Dental
and Mouth Hospital. The analysis used in this study
is one way ANOVA analysis with the dependent
variable is waiting time and the independent variable
is patient satisfaction. Data processing with the help
of applications on a computer
3 RESULT AND DISCUSSION
3.1 Characteristics of Respondents
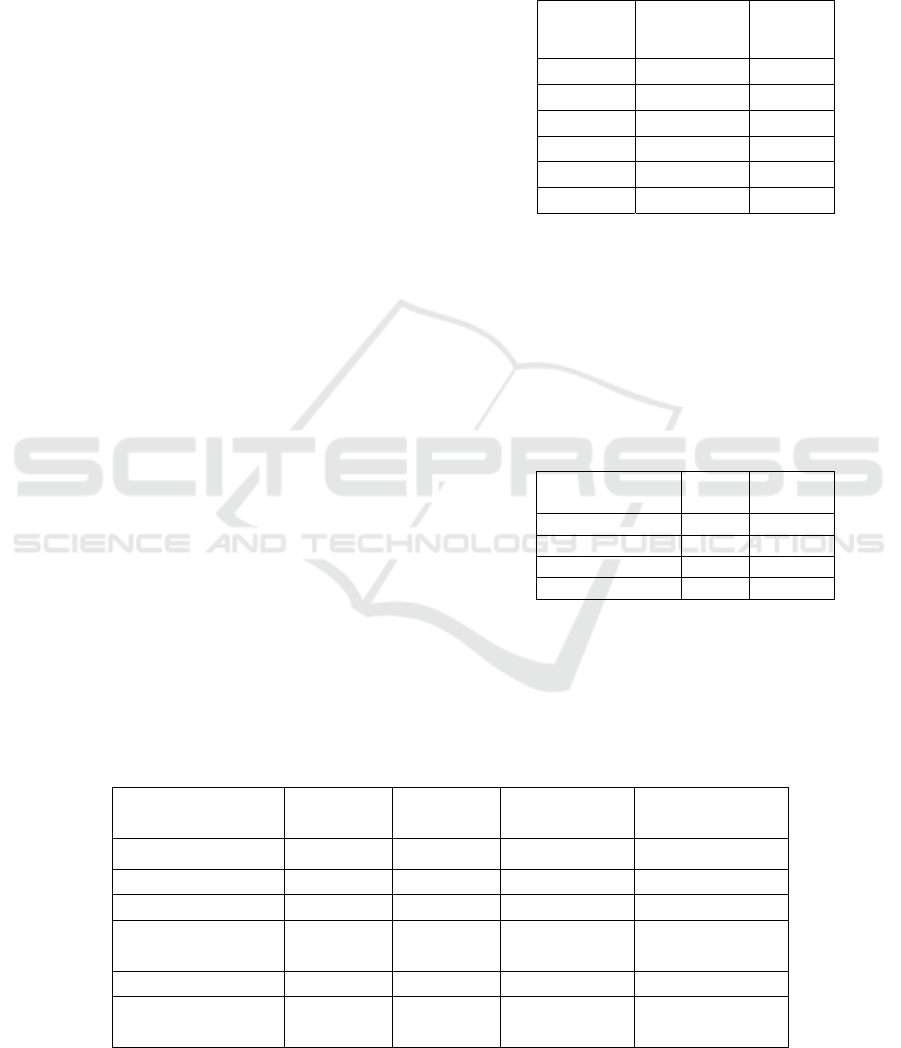
Table 1: Frequency distribution of respondents based on
age at 2019 RS.
Age
(Year)
Amount %
<17 2 2
,
0
18 – 27 46 46,0
28 – 37 24 24,0
38
–
47 14 14
,
0
48 - 57 11 11,0
>58 3 3
,
0
Based on table 1 that out of 100 respondents in
RSGM, the highest number of respondents showed
that the age group between 18-27 years was 46
(46.0%), while the least respondents in the age
group between <17 years were 2 (2.0%).
3.2 Univariate Analysis
Table 2: Distribution of Frequency Category for
Outpatients RSGM Moestopo.
Patient
satisfaction
Total %
Not satisfied 22 22
Quite satisfied 21 21
Satisfied 32 32
Very satisfied 25 25
Based on table 2, it can be seen that patient
satisfaction in Moestopo General Hospital is 22%
unsatisfied, 21% satisfied, 32% satisfied and 25%
very satisfied. So it can be concluded that the patient
is satisfied with the service at Moestopo Hospital.
Table 3: Frequency Distribution of Patient Satisfaction in RSGM Moestopo.
Dimension Lowest Highest Mean
(Rata-rata)
Standard
Devisiasi
Reliability 8 12 9,77 0,920
Responsiveness 8 16 12,04 1,769
Guarantee 10 16 12,97 1,114
Attention 13 24 18,10 2,393
Attention 13 20 17,26 1,330
Total patient
satisfaction
58 80 70,14 4,519
Comparison of Waiting Times at Patient Satisfaction Level at Moestopo University Dental and Oral Hospital
185
Based on table 3 it can be seen that from the 5
dimensions of satisfaction, the highest dimension is
in the dimension of attention (empathy) with an
average of 18.10 (SD 2,393) the lowest 13 is highest
24, the lowest value is found in the dimension of
reliability with an average of 9.77 (SD 0.920) lowest
8 and highest value 12, and average responsiveness
12.04 (SD 1,769) lowest 8 highest 16, physical
average 17.26 (SD 1,330) lowest 13 highest 20 and
average guarantee 12.97 ( SD 1,114) 10th highest of
16.
Table 4: Waiting Time Overview of RSGM Moestopo
Outpatient Services.
Standard Average
Activity
Average
Activity
Deviation
Called on the land 6.77 3.673
Patients on-call were
6.29 2.358
When called by the doctor 66.60 11.193
The total waiting time 79.66 11.512
Based on table 4 it can be seen that the average
waiting time called at the cashier is 6.77 minutes
(SD 3.673), with the fastest time of 1 minute, the
longest time is 17 minutes, while the average patient
time called at registration is 6.29 minutes (SD
2.358), with the fastest time of 3 minutes, the
longest time is 10 minutes and the average time
called by the doctor is 66.60 minutes (SD 11.193),
with the fastest time of 39 minutes, the longest time
is 90 minutes, then the total waiting time is 79.66
minutes. The average waiting time at the cashier is
known to be 6.77 minutes, the average waiting time
at registration is 6.26 minutes, and the average
waiting time at the doctor's call is 66.60 minutes, so
it can be concluded that the waiting time is called by
the doctor for longer. The length of the waiting time
is due to the mismatch of the doctor's watch settings
and the busy schedule of doctors who work in other
hospitals. This result also supports research
conducted by Astuti (2015) which shows the
difference in waiting time between capitation
patients and fee for service with a p-value of 0.028.
Another study from Fitriana (2018) stated that there
was a significant difference in the waiting time
dimension with general patient satisfaction and
BPJS patients with a p-value of 0.001 <0.005.
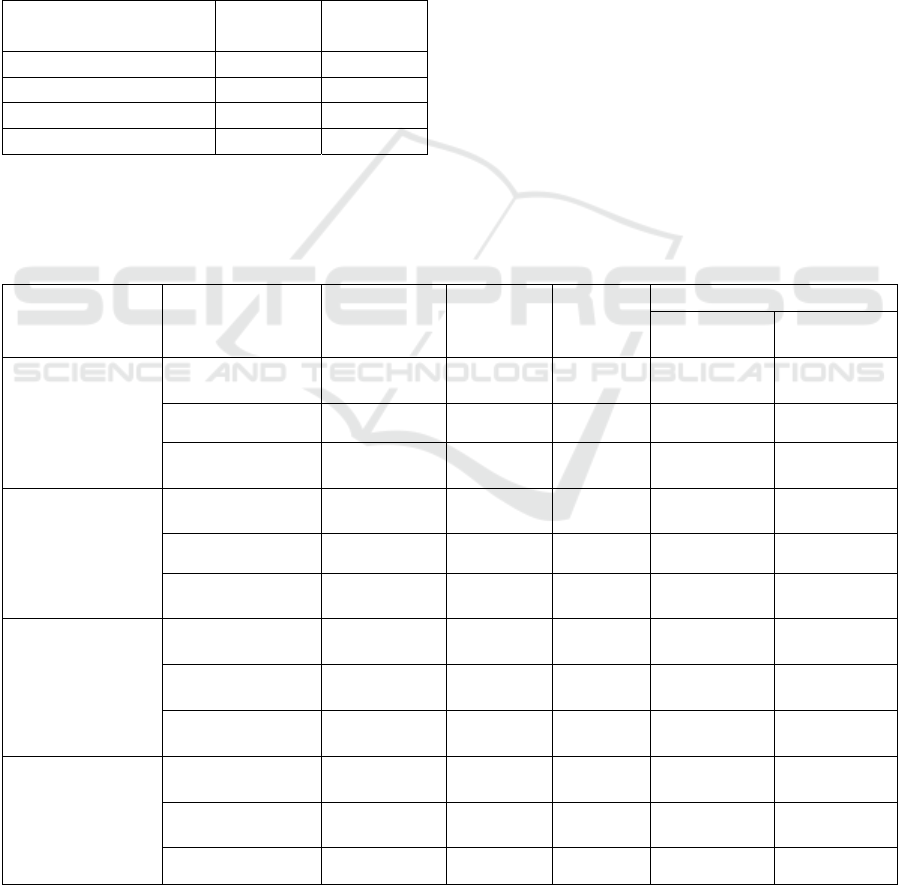
Table 5: Results from the Bonferroni Multiple Comparisons.
Satisfaction
Patient Group
Satisfaction
Patient Group
Mean
Difference
Std
Error
P-value
95% Confidence Interval
Lower
Bound
Upper
Bound
Not
Satisfied
Quite
Satisfied
-7.324 3.211 .149 -15.97 1.33
Satisfied
-10.610*
3.211 .008 -19.26 -1.96
Very
Satisfied
-23.762*
1.993 .000 -29.13 -18.39
Quite
Satisfied
Not
Satisfied
7.324 3.211 .149 -1.33 15.97
Satisfied -3.286 3.750 1.000 -13.39 6.82
Very
Satisfied
-16.439*
2.779 .000 -23.93 -8.95
Satisfied
Not
Satisfied
10.610*
3.211 .008 1.96 19.26
Quite
Satisfied
3.286 3750 1.000 -6.28 13.39
Very
Satisfied
-13.153*
2.799 .000 -20.64 -5.67
Very
Satisfied
Not
Satisfied
23.762*
1.993 .000 18.39 29.13
Quite
Satisfied
16.439*
2.779 .000 8.95 23.93
Satisfied
13.513*
2.799 .000 5.67 20.64
*groups are significantly related
ICOH 2019 - 1st International Conference on Health
186

3.3 Multivariant Analysis
According to table 5, it can be seen that it is useful
to further explore which groups are related or the
significant waiting time at the level of satisfaction.
Several pairs that are significantly different from the
results of the analysis above can be shown:
1) For the pair of categories not satisfied with
satisfied the mean difference of -10,610 and
the significance of the count of 0.008 (0.008
<0.05), and very satisfied the mean difference
of - 23,762 and the significance of the count
of 0,000 (0,000 <0.01).
2) For the pair, the category is quite satisfied
with very satisfied the mean difference of -
16.439 and the significance of the calculation
of 0,000 (0,000 <0.05).
3) For the pair of categories satisfied with
dissatisfied the mean difference of -10,610
and the significance of the count of 0.008
(0.008 <0.05), and very satisfied the mean
difference of -13.153 and the significance of
the count of 0,000 (0,000 <0.01).
4) For paired categories very satisfied paired
with dissatisfied mean difference 23,762 and
significance 0,000 (0,000 <0,05), quite
satisfied mean difference 16,439 and
significance 0,000 (<0.05), satisfied mean
difference and significance 0,000 (0,000 <0,
05), so it can be concluded that there are
significant differences between groups that
are meaningful in comparison the dissatisfied
patients differ significantly in the group of
patients who are satisfied with very satisfied.
For groups that were significantly
comparable, the patients were quite satisfied
differed significantly in the group of highly
satisfied patients, for the groups of patients
that were meaningfully satisfied the patients
were significantly different in the unsatisfied
group with very satisfied, for the groups of
patients who were meaningfully satisfied the
patients were very satisfied differently
significant in the group of patients dissatisfied
with quite satisfied and satisfied. Therefore
the Hospital should provide comfortable and
adequate facilities in the patient waiting room
to avoid the patient feeling saturated. The
medical staff (doctors and nurses) have the
commitment and time discipline to provide
services in accordance with a predetermined
schedule.
4 CONCLUSION
a. Judging from the frequency distribution
that can be seen in table 4.15, that of the
five highest dimensions of satisfaction
found in the dimension of attention 58
people (58%). On the dimension of
attention there are still patients who are
not satisfied because the patient feels that
the registration officer is providing picky
patients, and the registration officer does
not always greet the patients who come to
RSGM Moestopo.
b. Based on table 4.16 the results of the
analysis of waiting time for outpatient
services out of 100 respondents observed
that the average waiting time for outpatient
services is 79.66 minutes (SD 11,512).
This time exceeds the standard when
compared to the minimum service standard
of the Ministry of Health RI 129 / Minister
of Health / SK / II / 2008. Waiting time for
outpatient services exceeds the standard
because of the long waiting time for
patients dueto doctors who arrive late to
the hospital. In addition, the distribution of
medical records to the clinic will be
disrupted when the network error, so that
officials do not know if there is a request
for medical records
c. From the ANOVA analysis, it is known that
the sig value is 0,000, then 0,000 <0.05 so it
can be concluded that there is a significant
difference between waiting time and patient
satisfaction level
REFERENCES
Kreitz T. M., Winters B. S., Pedowitz D. I. The Influence
of Wait Time on Patient Satisfaction in the Orthopedic
Clinic. 2016; 3 (2): 39–42.
Xie Z, Or C. Associations Between Waiting Times,
Service Times, and Patient Satisfaction in
Endocrinology Outpatient Department: A Time Study
and Questionnaire Survey. 2017;
Oche M, Adamu H. Determinants of Patient Waiting Time
in the General Outpatient Department of a Tertiary
Health Institution in North Western Nigeria. 2013;
Available from: https://www.ncbi.nlm.nih.gov/pmc/
articles/PMC3868129/?report=reader
Laeliyah N, Subekti H. Waiting Time for Outpatient
Services with Patient Satisfaction with Outpatient
Services at Indramayu Regency Hospital. 1 (2): 102–
12.
Comparison of Waiting Times at Patient Satisfaction Level at Moestopo University Dental and Oral Hospital
187

Yulia Y. Relationship of waiting time for outpatient
services with personal specialist patient satisfaction at
Atma Jaya Hospital. 2017;
Hasan. Relationship of Waiting Times / Waiting Times
with Patient Satisfaction in the Eye Clinic at
Outpatient Installation at Tarakan Regional Hospital in
East Kalimantan Province in 2013. 2014;
R. Gunawan Sudarmanto. Computer-based applied
statistics with the IBM SPSS Statistics 19. Partner
Wancana Media; 2013.
Herudhiyanto. Relationship Waiting Time Check ..., Heru
Dhiyanto, UMP Faculty of Health Sciences, 2014.
2009; (2005): 13-27.
Alifah Nur Jannah. Digital Digital Repository University
of Jember University Jember Digital Digital
Repository University of Jember University. 2016;
I Gede Mahatma Yuda Bakti Sik Sumaedi. IKM PLUS
Technique for Measuring Public Satisfaction to
Support Bureaucratic Reform of Public Service
Agencies. 2017. 55
Hendri Nofiana SS. Latar Belakang Masalah Hubungan
Mutu Pelayanan Pendaftaran dengan kepuasa pasien
rawat jalan di Rumah Sakit PKU Muhammadiyah
Karanganyar. 2012; V (1): 90- 106.
Supranto. Pengukuran Tingkat Kepuasan Pelanggan.
Jakarta: PT RINEKE CIPTA; 2011
Zamilah. Zamilah: Hubungan Kualitas Pelayanan
Kesehatan Gigi Mulut Terhadap Kepuasan Pasien Di
Puskesmas Simpang Tiga Pekanbaru-Riau Tahun
2009, 2009. Repositori USU © 2009. 2009;
Azwar. Pengantar administrasi kesehatan. 2010
Noor J. Metodologi Penelitian. Jakarta: Grup Media
Kencana Prenada; 2012
Notoatmodj Soekidjo. Metodologi Penelitian Kesehatan.
jakarta: PT Rineke Cipta, Jakarta; 2012
Lestari Y, Nurcahyanto H, Publik DA, Diponegoro U,
Profesor J, Soedarto H. Analisis tingkat kepuasan
pasien rawat jalan. 2017; 33.
Srisurani I, Astuti W, Murti B, Probandari AN, Ilmu D,
Masyarakat K, et al. Rasio Rujukan Pasien Dokter
keluarga. 2009; 30-4.
Ida Srisurani Wiji Astuti, Bhisma Murti ANP. Rasio
Rujukan Pasien Dokter keluarga. 2017; 5: 51–60.
Kreitz TM, Winters BS, Pedowitz DI. The Influence of
Wait Time on Patient Satisfaction in the Orthopedic
Clinic. 2016;3(2):39–42.
Xie Z, Or C. Associations Between Waiting Times ,
Service Times , and Patient Satisfaction in an
Endocrinology Outpatient Department : A Time Study
and Questionnaire Survey. 2017;
Oche M, Adamu H. Determinants of Patient Waiting Time
in the General Outpatient Department of a Tertiary
Health Institution in North Western Nigeria. 2013;
Available from: https://www.ncbi.nlm.nih.gov/pmc/
articles/PMC3868129/?report=reader
Laeliyah N, Subekti H. Waktu Tunggu Pelayanan Rawat
Jalan dengan Kepuasan Pasien Terhadap Pelayanan di
Rawat Jalan RSUD Kabupaten Indramayu. 1(2):102–
12.
Yulia Y. Hubungan waktu tunggu pelayanan rawat jalan
dengan kepuasan pasien spesialis pribadi di Rumah
Sakit Atma Jaya. 2017;
Hasan. Hubungan Waiting times/waktu tunggu dengan
Kepuasan Pasien di poliklinik Mata pada Instalansi
Rawat Jalan di RSUD Tarakan Propinsi Kalimantan
Timur tahun 2013. 2014;
R. Gunawan Sudarmanto. Statistik terapan berbasis
komputer dengan program IBM SPSS Statistik 19.
Mitra Wancana Media; 2013.
Herudhiyanto. Hubungan Waktu Tunggu Periksa..., Heru
Dhiyanto, Fakultas Ilmu Kesehatan UMP, 2014.
2009;(2005):13–27.
Alifah Nur Jannah. Digital Digital Repository Repository
Universitas Universitas Jember Jember Digital Digital
Repository Repository Universitas Universitas Jember.
2016;
I Gede Mahatma Yuda Bakti Sik Sumaedi. IKM PLUS
Teknik Pengukuran Kepuasan Masyarakat untuk
Mendukng Reformasi Birokrasi Instansi Pelayanan
Publik. 2017. 55 p.
Hendri Nofiana SS. Latar Belakang Masalah Hubungan
Mutu Pelayanan Pendaftaran dengan kepuasa pasien
rawat jalan di Rumah Sakit PKU Muhammadiyah
Karanganyar. 2012;V(1):90–106.
Supranto. Pengukuran Tingkat Kepuasan Pelanggan.
jakarta: PT RINEKE CIPTA; 2011.
Zamilah. Zamilah : Hubungan Kualitas Pelayanan
Kesehatan Gigi Mulut Terhadap Kepuasan Pasien Di
Puskesmas Simpang Tiga Pekanbaru-Riau Tahun
2009, 2009. USU Repository © 2009. 2009;
Azwar. Pengantar administrasi kesehatan. 2010.
Noor J. Metodologi Penelitian. Jakarta: Kencana Prenada
Media Group; 2012.
Notoatmodj Soekidjo. Metodologi Penelitian Kesehatan.
jakarta: PT Rineke Cipta, Jakarta; 2012.
Lestari Y, Nurcahyanto H, Publik DA, Diponegoro U,
Profesor J, Soedarto H. Analisis tingkat kepuasan
pasien rawat jalan. 2017;33.
Srisurani I, Astuti W, Murti B, Probandari AN, Ilmu D,
Masyarakat K, et al. Perbedaan Kualitas Pelayanan
Berdasarkan Waktu Tunggu serta Rasio Rujukan
Pasien Dokter keluarga. 2009;30–4.
Ida Srisurani Wiji Astuti, Bhisma Murti ANP. Perbedaan
Kualitas Pelayanan Berdasarkan Waktu Tunggu serta
Rasio Rujukan Pasien Dokter keluarga. 2017;5:51–60.
ICOH 2019 - 1st International Conference on Health
188
