
Quality Evaluation of Pharmacy Services in the Outpatients at
Hospital in Jakarta
Aprilita Rina Yanti Eff
1
, Ayu Puspita Lena RTR
1
and Almira Ristizsa Shabrina Da Costa
2
1
Departement of Pharmacy Faculty of Health Sciences, Esa Unggul University,
Arjuna Utara Street, North Jakarta, Indonesia
2
Departement of Public Health, Faculty of Health Sciences, Esa Unggul University,
Arjuna Utara Street, North Jakarta, Indonesia
Keywords: Pharmaceutical Service, Drug Service Time, Satisfaction Level, Hospital.
Abstract: The pharmacy system in a hospital is maintained by a pharmacy unit, assigned to conduct, coordinate, arrange,
and supervise all the pharmacy services activities. The fundamental problems in the dimensions of medicine
time-serving and consumer satisfaction levels have become the primary indicator in guaranteeing the
credibility of pharmacy services for society. This research aims to evaluate the satisfaction level of patients
and the dimension of medicine time-serving in the outpatient pharmacy of the pharmacy installation at Rawa
Lumbu Hospital. This study was non-experimental with an observational design, which is precisely
descriptive using a quantitative approach. The number of respondents therein research is 171. The obtained
results based on the standard of pharmacy services are that the tangible aspect reached up to 85,35%, the
reliability aspect pursued 88,10%, the assurance dimension achieved 85,91%, the empathy dimension
obtained 80,94%, and in the responsiveness, perspective gained 78,46%. Meanwhile, the average serving of
medicines and medicines has met the standards according to the Indonesian Minister of Health No. 129/2008,
which shows that the prepared recipe can be served in no more than 30 minutes and the recipe for the
concoction will be ready within 60 minutes..
1 INTRODUCTION
Patient-oriented hospitals must provide one type of
minimum service, namely pharmacy services. Based
on Government Regulation of the Republic of
Indonesia No. 51/ 2009 pharmacy services are an
integral part of the hospital health care system that is
intact and oriented to patient services, provision of
quality medicine and clinical and affordable
pharmacy services for all levels of society
(Indonesian Ministry of Health, 2009). Pharmacy
services in a hospital are managed by a
pharmaceutical installation that is in charge of
organizing, coordinating, managing, and overseeing
all pharmacy service activities. Pharmaceutical
services, according to the Decree of the Minister of
Health of the Republic of Indonesia No. 197/2004 is
one of the hospital services to support quality health
services (Indonesian Ministry of Health, 2004).
The results of the study on pharmacy services
showed that 76.86% of the people wanted the
appearance of a good drug store, (Muslicnah, M, &
Syamsudin, 2010) 80.6% expected a friendly service
provider (Hariany, 2014), whereas according to
86.7% patients were satisfied if you get fast service
(Muslicnah et al., 2010). Excellent pharmacy services
at pharmacies are still unpracticed much and are still
optimally undone. The pharmacy that applies the new
pharmaceutical service standards is 47.63% - 56.16%
(Ginting, 2009).
At present, the community needs more qualified
and friendly health services that are oriented towards
their safety. Patient satisfaction using pharmacy
services is a reflection of the results of the quality of
health systems provided. These services range from
interactions with doctors, nurses, and pharmacists, as
well as interactions with administrative officers and
other health workers. Satisfaction using pharmacy
services represents the attitude of consumers in
determining the direction and intended destination in
the process of interpreting the proper use of drugs or
the purchase of a medicinal product so that patient
satisfaction using the pharmacy services can be used
as a benchmark to reflect how much patient
satisfaction the services provided (Ofili, 2014).
Eff, A., Rtr, A. and Shabrina Da Costa, A.
Quality Evaluation of Pharmacy Services in the Outpatients at Hospital in Jakarta.
DOI: 10.5220/0009566600830091
In Proceedings of the 1st International Conference on Health (ICOH 2019), pages 83-91
ISBN: 978-989-758-454-1
Copyright
c
2020 by SCITEPRESS – Science and Technology Publications, Lda. All rights reserved
83

Rawalumbu Hospital remains a type C hospital,
with the primary task of providing medical services
to all levels of society who live in the Rawalumbu
area, East Bekasi. Rawalumbu hospital pharmacy
installation divides its activities into two main groups,
namely clinical and non-clinical pharmacy activities.
Prescription systems and drug information services
are part of clinical pharmacy activities.
Outpatient pharmacy facilities start at 07.30 pm-
21.00 am on Mondays to Fridays with an average of
300 sheets recipe per day. The number of workers on
duty is ten people consisting of one pharmacist as the
head of the installation, eight pharmacist assistants
and one service supervisor.
Based on the background above, we are interested
in examining the quality evaluation of pharmacy
services in the outpatients at the rawa lumbu hospital
Based on Pharmaceutical Service Standards on the
dimensions of drug service time and the level of
customer satisfaction.
2 MATERIAL AND METHODS
2.1 Subject of Research
The subject was all outpatients (n=171) who were
taking drugs at the Hospital Pharmacy Installation
that met the inclusion criteria: had taken drugs or
received pharmaceutical services at least once, 18-65
years old, able to communicate and read well and
willing to fill out questionnaires.
2.2 Research Design
This study is a non-experimental with an
observational and descriptive design with a
quantitative approach. The researcher preferred
descriptive research because we wanted to describe
the relevant forms regarding the practice of
pharmaceutical standards carried out at the
Rawalumbu Hospital pharmacy installation. The data
are obtained directly from the respondents in the
selected scope using a questionnaire (Kothari, 2004).
2.3 Research Subject
The population in this study was all outpatients who
were taking drugs at the Hospital Pharmacy
Installation. Samples are outpatients who meet the
inclusion criteria that are involved in the drug or
received service at least once, aged 18-65 years, able
to communicate and read properly and are willing to
fill out questionnaires. The sample in this study was
collected using accidental sampling technique.
Considering the population varies, the characters are
heterogeneous. Besides, the validity and reliability of
the questionnaire were previously tested with 30
different outpatients. The sufficient number of
respondents based on calculations adopting the Slovin
(Setiawan, 2007) formula comprise 171 people.
2.4 Research Instruments
Data were collected using a set of questions and
observation sheets. The questionnaire consisted of 25
questions that covered five dimensions of satisfaction
(tangibles, reliability, responsiveness, assurance,
emphaty). All questions in this used questionnaire
were naturally adapted from questionnaire
examinations in the Kautsar (2017) study.
Observation sheets are utilized to record the time of
each recipe service process from receipt of the
prescription by the official to the delivery of the drug
to the patient using a digital clock.
2.5 Evaluation of Research Instrument
The research instrument evaluation was conducted
through questionable validity and reliability testing.
The specific test was carried out by distributing initial
questionnaires to 30 outpatient respondents who were
taking drugs at the Rawalumbu hospital pharmacy
installation. A validity test is done by accurately
measuring the level of patient satisfaction using the
SERVQUAL questionnaire (Daniel & Berinyuy,
2010). The set of questions is declared validly if the
value of Corrected item-total Correlation 0.361.
Reliability tests were performed applying the
Cronbachα technique, and the data obtained were
statistically analyzed using IBM SPSS 22 software.
2.6. Data Analysis
2.6.1 Descriptive Statistical Analysis
This analysis was attempted to affect the distribution
of respondents' characteristics. Patient characteristics
noted consisted of gender, age, education level,
occupation, monthly income, and distance of the
house from the hospital. The data distribution is
presented in the form of tabel.
2.6.2 Gap Test
The gap is a mismatch between the services received
by customers with the services expected. Gap test
ICOH 2019 - 1st International Conference on Health
84
calculates the difference between the average
performances with the average expectation. The
difference figures illustrate the level of patient
satisfaction (Daniel & Berinyuy, 2010).The sentence
must end with a period.
2.6.3 Importance and Performance Analysis
Importance-Performance Analysis (IPA) represents
an analysis of the level of conformity between
customer expectations or interests and the
performance or reality received by the customer. To
find out the assessment score of the average level of
company performance and the grade of the level of
useful customer interest to correctly determine the
primary issue of increasing attributes that affect
satisfaction used Cartesian diagram, with the
following formula:
χ ̅ ΣXi Y ̅=ΣYi/n
n
(1)
Where χ ̅ = The average score of performance
appraisal of an attribute or service quality dimension;
Y ̅ = The average score of expectation rating of an
attribute or service quality dimension; and n= number
of respondents (Abalo, Varela, & Manzano, 2007)
3 RESULTS AND DISCUSSION
3.1 Evaluation of Research Instrument
The research instrument test was carried out by
distributing questionnaires to 30 selected
respondents. The results show that the reliable
questionnaire with Cronbach’s alpha is 0.745 for the
expectation level, and 0, 738 for the performance
level. In the validity, parameter obtained Corrected
item-total Correlation> 0.361. The instrument test
results show that the questionnaire is reliable and
valid and can be used in research.
3.2 Descriptive Statistical Analysis
Results of descriptive statistical analysis (patient
characteristic) can be seen in table 1. From table 1, it
can be seen that most of the research respondents
were female, that is, 54%. Some theories state that
women have a higher level of satisfaction compared
to men; women tend to be more satisfied with health
services than men (Gigantesco et al., 2019). Most of
the research respondents were aged 36 to 45 years at
30% while the least aged 65 years at 0.5%. At
productive age (adults), unwholesome habits
frequently occur because of unhealthy lifestyles,
shortage of rest, consuming unhealthy food, and lack
of physical activity. Age is present one of the
contributing factors that influence one's health
behavior. Age affects the way of thinking,
experience, and patient satisfaction. Respondents
aged 36-45 years are adults who want quality health
services (Deeks, Lombard, Michelmore, & Teede,
2009). At the education level, the majority of
respondents had a diploma and bachelor education
(56%). Zimmerman stated that educated community
groups more quickly accept themselves as sick people
if they experience a specific symptom. They are more
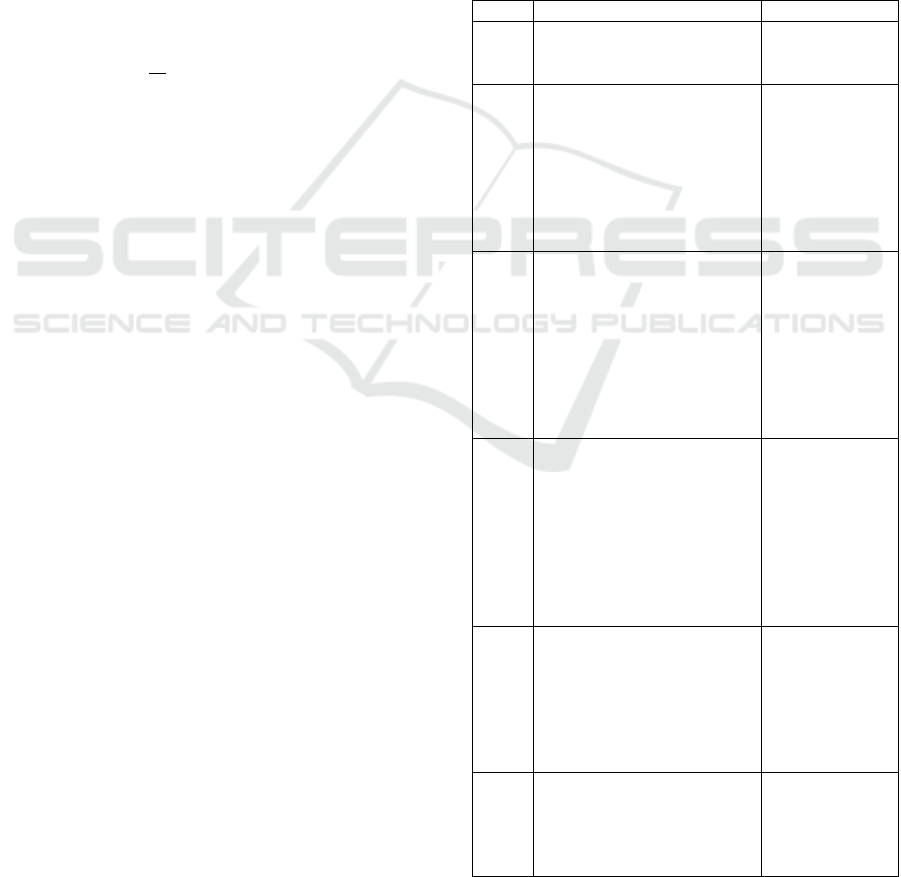
Table 1: Patient characteristic.
No Description Percentage (%)
1 Gender
- Women
- Man
54
46
2 Aged (year)
- <18
- 18-25
- 26-35
- 36-45
- 46-55
- 55-65
- >65
4.4
21
18
30
13
13
0.6
3 Education
- elementary school /
equivalent
- junior high school /
equivalent
- high school / equivalent
- diploma / bacelor
- master and doctor
1
6
33
56
4
4 Occupation
- Student
- College student
- Government employees
- Private employees
- entrepreneur
- state-owned enterprises
- Housewife
- Retired
11
16
9
28
11
2
19
4
5 Income (rupiah)
- 1,000,000
- 1,000,001-2,500,000
- 2,500,001- 5,000,000
- 5,000,001-10,000,000
- 10,000,001
10
25
46
18
1
6 distance of residence to the
hospital (km)
- <10
- 10 - 25
- > 25
3
23
74
Quality Evaluation of Pharmacy Services in the Outpatients at Hospital in Jakarta
85
active in seeking help from doctors than those with
lowly social status. Someone who is less educated
may because of ignorance will choose not to seek
treatment as long as he can still withstand the pain.
The higher level of education a person will also
increase the knowledge and information obtained. A
person's perception of health services is influenced by
several factors, namely, resources, knowledge,
education, and attitudes. External factors include
culture, socio-economy, family, and the situation at
hand (Zimmerman & Woolf, 2014).
From table 1, it can be seen that most of the
research respondents were female, that is, 54%.
Some theories state that women have a higher level of
satisfaction compared to men; women tend to be more
satisfied with health services than men (Gigantesco et
al., 2019). Most of the research respondents were
aged 36 to 45 years at 30% while the least aged 65
years at 0.5%. At productive age (adults),
unwholesome habits frequently occur because of
unhealthy lifestyles, shortage of rest, consuming
unhealthy food, and lack of physical activity. Age is
present one of the contributing factors that influence
one's health behavior. Age affects the way of
thinking, experience, and patient satisfaction.
Respondents aged 36-45 years are adults who want
quality health services (Deeks, Lombard,
Michelmore, & Teede, 2009). At the education level,
the majority of respondents had a diploma and
bachelor education (56%). Zimmerman stated that
educated community groups more quickly accept
themselves as sick people if they experience a
specific symptom. They are more active in seeking
help from doctors than those with lowly social status.
Someone who is less educated may because of
ignorance will choose not to seek treatment as long as
he can still withstand the pain. The higher level of
education a person will also increase the knowledge
and information obtained. A person's perception of
health services is influenced by several factors,
namely, resources, knowledge, education, and
attitudes. External factors include culture, socio-
economy, family, and the situation at hand
(Zimmerman & Woolf, 2014).
3.3 Assessment of Expectations on
Service Quality Attributes
The performance and quality of service expected by
patients are assessed using several dimensions,
namely, reliability, responsiveness, assurance,
empathy, and tangibility. The average value of
expectation on service quality attributes can be
referred to in table 2.
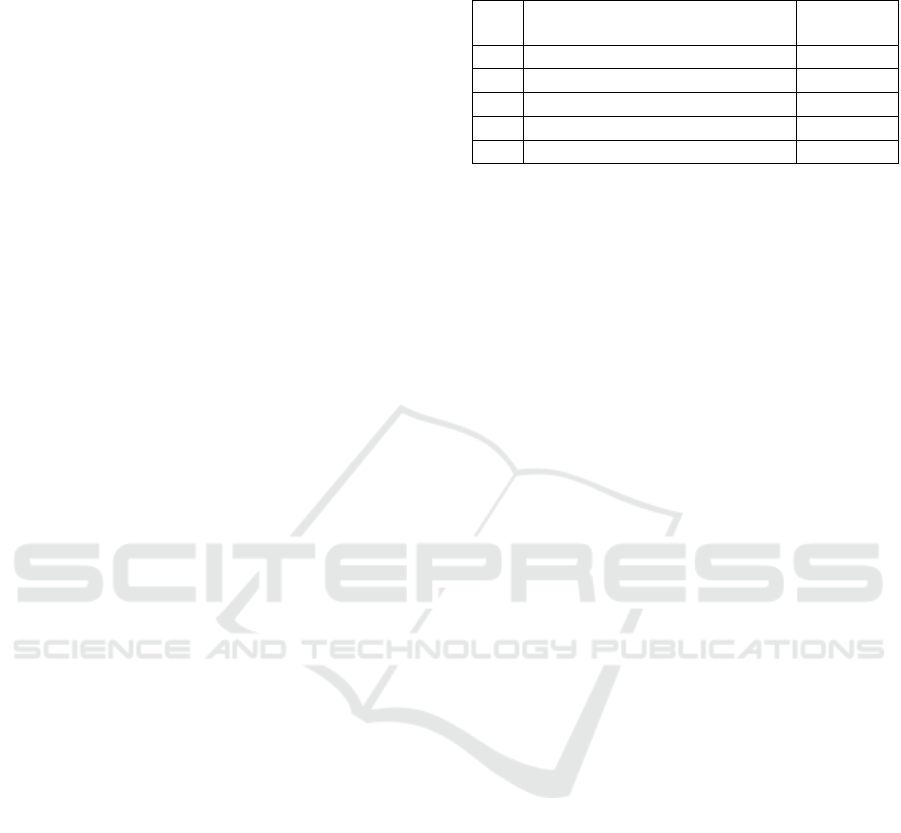
Table 2: The average value of expectation on service quality
attributes.
No
The attributes of Pharmaceutical
Services
Score
(mean)
1
Dimension of Realibity 3.5
2
Dimension of Responsiveness 3.38
3
Dimension of Assurance 3.46
4
Dimension of Emphaty 3.24
5
Dimension of Tangibles 3.36
Table 2 shows that the reliability dimension has
the tallest average (3.50) compared to other
dimensions, meaning that the highest level of
expectation is found in that dimension. The
dimension that has the lowest average value is present
the empathy dimension (3.24), meaning that the most
elementary level of expectation is found in that
dimension. So that patients feel that these attributes
do not affect the ongoing service. Within the empathy
dimension, the attribute of pharmaceutical service
quality that has the highest average value is that the
patient is convinced of the cure that will be achieved
in treatment. This attribute is considered essential by
patients because this is one form of attention carried
out by officers who will influence patients to recover
rapidly. The quality of pharmaceutical service
attributes in the dimension of responsiveness, which
has the highest average value, is how to obtain drugs
quickly. How to receive drugs easily is considered
essential because the ease inside receiving drugs will
increase the level of patient confidence in the service
at this hospital. In the assurance dimension, the
service quality attribute that has the highest average
value remains the drug given in good condition.
Medication dispensed with the right conditions is
considered necessary by the patient because the drug
obtains the most crucial element in the healing
process. If the drug is given in a condition that exists
not well, this will undoubtedly cause adverse effects
for patients and hospitals (M. A. Abujarad Alhuwitat
& Salem, 2017).
In the tangibles dimension, the service quality
attribute that has the highest average value remains a
pristine waiting room. A clean waiting room is
considered primary because this will cause comfort in
the patient.
3.4 Assessment of Performance Level
on Service Quality Attributes
Evaluation of the level of performance on service
quality attributes is done by filling out the
questionnaire conducted by respondents based on the
dimensions of reliability, responsiveness, assurance,
ICOH 2019 - 1st International Conference on Health
86
empathy, and tangible. The results of the evaluation
of the level of performance in the service quality
attributes can be seen in table 3.
Table 3: The average value of performance in the service
quality attributes.
No
The attributes of Pharmaceutical
Services
Score
(mean)
1
Dimension of Realibity 3.08
2
Dimension of Responsiveness 2.66
3
Dimension of Assurance 2.97
4
Dimension of Emphaty 2.62
5
Dimension of Tangibles 2.83
Table 3 shows that the reliability aspect maintains
the most elevated average level of satisfaction (3.08)
compared to other service dimensions. The Directors
of Rawalumbu Hospital always emphasize their
employees to be professional, work optimally, and
provide an excellent facility within a variety of
services, especially in drug services. This appropriate
attitude will convey the patient's confidence to seek
treatment and not switch to another hospital
consistently. The empathy dimension possesses the
deepest average level of satisfaction (2.66). This
value means the patient considers that the drug
service officer is still unable to satisfy the patient.
Officers have been unable to convince patients about
healing, and in providing services, officers still
distinguish patients. Overall, the level of conformity
obtained from the comparison between the level of
expectation and the level of performance against 25
attributes of pharmaceutical services at Rawalumbu
Hospital represent an appropriate category
(Saraswati, Kristina, & Zulkarnain, 2018).
3.5 Importance and Performance
Analysis
Importance and Performance Matrix is a diagram that
is divided into four quadrants, which are bounded by
two lines that intersect the perpendicular to the point
(X, Y). The X-axis (horizontal axis) will fill the
performance level score, while the Y-axis (vertical
axis) will provide the score for the level of
expectation (importance) (Abalo et al., 2007). The
position of 25 pharmacy service quality attributes can
be observed by using the Importance and
Performance Matrix based on the score of
expectation/importance and the reality/performance
score of 171 Rawalumbu Hospital patients. However,
before that, it is necessary to calculate the average
value of the expectation level score and the
performance level score, which will be plotted on the
Cartesian diagram. Patient satisfaction is known for
assessing the level of expectation and satisfaction
during the patient's treatment at Rawalumbu Hospital.
The mean score of importance (Y) and the average
score of satisfaction (χ) are totaled, then averaged
overall. The score of expectation and performance
assessment of each attribute can be seen in the
following table 4.
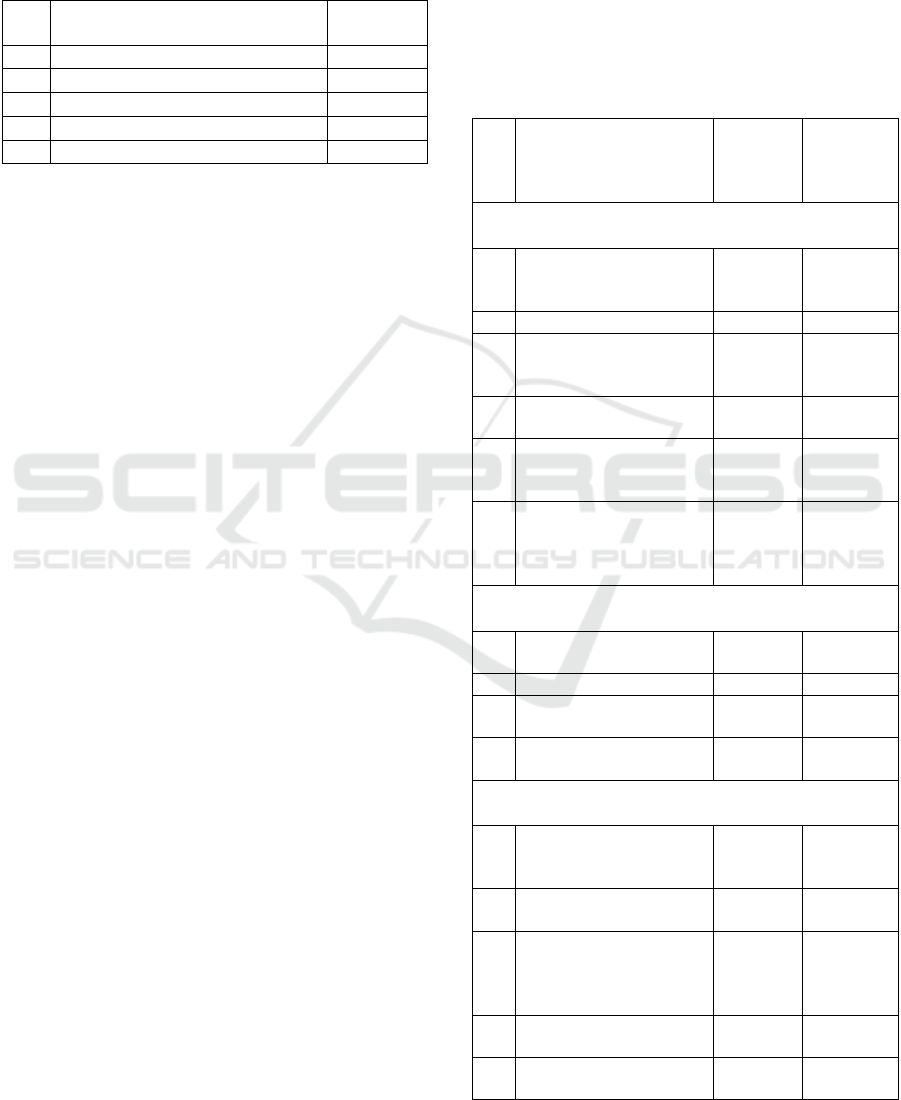
Table 4: The score of expectation and performance
assessment of each attribute.
No Quality Attributes of
Pharmaceutical Services
Average
Expectation
Score
Average
Level of
Performance
Score
Dimension of Realibity
1 How the use of drugs is
written clearly on the
packages of drugs
3,54 3,15
2 Drug wrapped neatly 3,44 3,17
3 Pharmacy staff provides
information on how to use
drugs
3.59 3.18
4 Prescription services easy
and straightforward
3,23 3,08
5 Pharmacists provide
information about the side
effects of drugs
3,59 3,14
6 Patients get the
appropriate dosage, how
to utilize it, and when to
merely take it
3,64 3,15
Dimension of Responsiveness
7 The time for waiting for
drugs is fast.
3,29 2,48
8 Medicine is easy to get. 3,53 2,91
9 Opening hours of service
on time
3,46 2,83
10 Officers are responsive to
patient problems
3,27 2,43
Dimension of Assurance
11
The pharmacy staff
provides consulting
services that satisfy.
3,40 2,55
12
Pharmacists serve recipes
politely.
3,57 3,06
13
Medication services are
well served when the
patient asks for an
explanation of the drug.
3,43 2,87
14
Patients receive proof of
payment of the drug.
3,25 3,09
15
Medications are given in
good condition
3,65 3,29
Quality Evaluation of Pharmacy Services in the Outpatients at Hospital in Jakarta
87
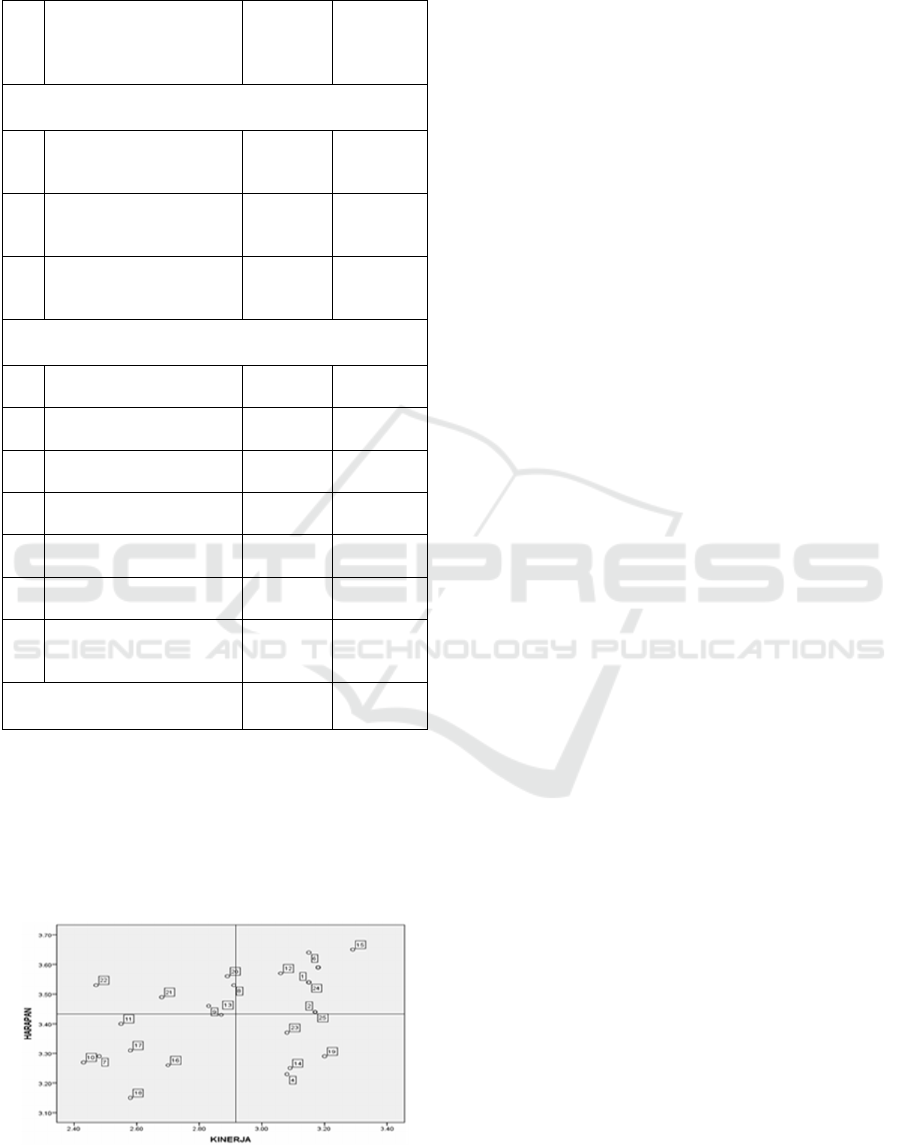
Table 4: The score of expectation and performance
assessment of each attribute (cont.).
No Quality Attributes of
Pharmaceutical Services
Average
Expectation
Score
Average
Level of
Performance
Score
Dimension of Emphaty
16 The patient's family
supervises regular drug
use.
3,26 2,70
17 Patients gain confidence
in the healing that will be
achieved in treatment.
3,31 2,58
18 Officers provide the same
service regardless of
patients.
3,15 2,58
Dimension of Tangibles
19 Pharmacy staff dressed
neatly
3,29 3,20
20 The waiting room is
clean
3,56 2,89
21 Seating in the lounge is
comfortable.
3,49 2,68
22 The atmosphere of the
waiting room is calm.
3,53 2,47
23 There are television
facilities in waiting room.
3,37 3,08
24 Spacious waiting room
with air conditioner
3,43 3,09
25 The waiting room
provides the latest
newspapers/magazines.
2,91 2,45
Overall average score
3,43 2,91
Importance and Performance Matrix is a diagram
that is divided into four quadrants, which are bounded
by two lines that intersect perpendicular to the point
(X, Y). The X-axis (horizontal axis) will fill up the
performance level score, while the Y-axis (vertical
axis) will fill the score for the level of expectation
(importance). In figure 1, it can be seen that the
Figure 1: Cartesian Diagram of Pharmaceutical Services
attributes at Rawalumbu Hospital.
location of the pharmaceutical service attributes
analyzed divided into four parts, namely quadrant A
(top priority), quadrant B (maintain performance.),
quadrant C (low priority), and quadrant D (excessive)
(Abalo et al., 2007) (Minta & Stephen, 2017).
The attributes of each dimension that are in
quadrant A indicate the attributes that are considered
to influence patient satisfaction. The handling of
attributes in this quadrant needs to be prioritized by
the hospital management because the existence of
these attributes is considered essential for patients but
cannot be fulfilled by the hospital. Attributes in this
quadrant indicate the weakness of the management of
Rawalumbu Hospital in meeting the needs of patients.
In figure 1 it can be seen that the attributes included
in this quadrant exist: medicine is easy to get, opening
hours of service on time, Medication services are well
served when the patient asks for an explanation of the
drug, the waiting room is clean, Seating in the lounge
is comfortable, and the atmosphere of the waiting
room is calm. Minta and Stephen states that quadrant
A is present the location of various aspects or
attributes of health services felt to be distinguished by
patients, but cannot be felt optimal by patients.
Quadrant A is an attribute position that possesses high
importance, low performance. From quadrant A, it
can be seen that the quality of service performance of
the attribute is still below expectations so that it
affects the patient's dissatisfaction with the attribute.
This dissatisfaction can cause the patient to switch to
another hospital. Customer satisfaction essentially
remains the goal of a business. The creation of
customer satisfaction can provide a satisfactory basis
for repeat purchases and the creation of customer
loyalty. It exists worth noting that customer
satisfaction is a long-term strategy that requires
commitment, both in terms of funds and human
resources (Minta & Stephen, 2017).
Attributes that are in quadrant B shows that need
to be maintained by the hospital in providing services
needed by patients. Carrying out of the attributes in
this quadrant has been considered in conformity with
patient expectations resulting in satisfaction.
Attributes that are in this quadrant are attributes that
are considered crucially essential and have been
implemented satisfactorily. As for the attributes
included in this quadrant are as follows: how the use
of drugs is written clearly on the packages of drugs,
Drug wrapped neatly, Pharmacy staff provides
information on how to use drugs Pharmacists provide
information about the side effects of drugs,
Pharmacists serve recipes politely. Medications are
given in good condition, Spacious waiting room with
air conditioner, The waiting room provides the latest
ICOH 2019 - 1st International Conference on Health
88
newspapers/magazines. The quality improvement
strategy for this quadrant is to maintain the
performance of these attributes. As explained by Minta
and Stephen that all aspects or attributes contained in
the quadrant B are attributes that are considered
fundamentally crucial by patients, and performance
has been above the average rating. Quadrant B is an
attribute position that has high importance, high
performance. This means that the quality of service
performance of these attributes is by patient
expectations so that it has an impact on patient
satisfaction. For this reason, the attributes in this
quadrant need to be maintained to create patient loyalty
and interest in repurchases (Minta & Stephen, 2017).
Quadrant C shows the service attributes that are
considered to be the expectations of the patient and
his family, where the hospital has run them. The
attributes included in this quadrant have not remained
the key priority to be corrected because the patient is
satisfied with what obtains presently, but will indicate
satisfaction if it is increased again. The attributes
included in the C quadrant are the time for waiting for
drugs is fast, Officers are responsive to patient
problems, the pharmacy staff provides consulting
services that satisfy, the patient's family supervises
regular drug use, Patients gain confidence in the
healing that will be achieved in treatment and
Officers provide the same service regardless of
patients. The quality improvement strategy for this
quadrant is to improve the performance of these
attributes after increasing the performance of the
attributes contained in quadrant A. As granting to
Deng and Pierskalla states, all aspects or attributes
contained in quadrant C are attributes that are
considered less important by patients. Attributes in
quadrant C need to be improved, but the priority is
still below the attributes contained in quadrant A.
Quadrant C is a position attribute that assumes limited
importance, low performance. This means the quality
of service performance of these attributes is still
below the average performance appraisal, thus
impacting on the patient's dissatisfaction with these
attributes. This dissatisfaction receives consequences
for the transfer of patients from other hospitals (Deng
& Pierskalla, 2018).
Quadrant D represents an attribute that is
considered less valuable by the patient, while the
implementation is proper, so it seems excessive but is
considered satisfactory. Attributes included in
quadrant C are as follows: prescription services easy
and straightforward, patients receive proof of
payment of the drug, pharmacy staff dressed neatly,
and there are television facilities in waiting room. The
attributes contained in quadrant D do not need a
quality improvement strategy. Quadrant D is an
attribute position that possesses low importance, high
performance. This means that the quality or
performance of the service attributes accordingly
outperforms patient expectations so that it impacts on
patient satisfaction. The attributes in this quadrant do
not need to be increased. They are sufficiently
maintained to encourage patient loyalty and patient
interest in rehearsing purchases (Abalo et al., 2007)
(Deng & Pierskalla, 2018).
3.6 Gap Analysis
The value of the gap will provide information about
how much a pharmaceutical service attribute at
Rawalumbu Hospital has fulfilled the expectations of
its patients. Part of the resulting difference is
negative, and the smaller the negative value, the
better. The possibility of a positive gap is unusually
slight. Gap analysis results presented in Table 5.
Tabel 5: Gap analysis between performance and
Expectation Level on Attributes Quality of Pharmacy
Services.
No Average
Performance
Average
Expectations
Gap
1 3,15 3,54 -0,39
2 3,17 3,44 -0,27
3 3,18 3,59 -0,41
4 3,08 3,23 -0,15
5 3,18 3,59 -0,41
6 3,15 3,64 -0,49
7 2,48 3,29 -0,81
8 2,91 3,53 -0,62
9 2,83 3,46 -0,63
10 2,43 3,27 -0,84
11 2,55 3,40 -0,85
12 3,06 3,57 -0,51
13 2,87 3,43 -0,56
14 3,09 3,25 -0,16
15 3,29 3,65 -0,36
16 2,70 3,26 -0,56
17 2,58 3,31 -0,73
18 2,58 3,15 -0,57
19 3,20 3,29 -0,09
20 2,89 3,56 -0,67
21 2,68 3,49 -0,81
22 2,47 3,53 -1,06
23 3,08 3,37 -0,29
24 3,09 3,43 -0,34
25 2,45 2,91 -0,46
Average -0,57
From table 5, it can be perceived that the attributes
that contain the enormous gap are the quiet waiting
room atmosphere (-1.06), pharmacists providing
Quality Evaluation of Pharmacy Services in the Outpatients at Hospital in Jakarta
89

satisfactory consulting services (-0.85), and officers
responding to patient problems (-0.84). These
attributes possess the deepest level of compatibility
between patient expectations and the performance of
the resulting service. These attributes must remain a
priority for performance improvement. As for the
attributes that contain the slightest gap represent the
appearance of neat pharmacy personnel (-0.09), proof
of payment of drugs given to them (-0.16), and
prescription services that are not convoluted (-0.15)
which means these attributes have the highest level of
conformity between patient expectations and the
performance of services produced by the hospital
(Daniel & Berinyuy, 2010).
3.7 Evaluation of Time Dimensions of
Drug Services
The time dimension in common is the drug service
from the patient submitting a prescription until they
receive the drug and drug information.
Pharmaceutical service is mentioned to be useful if
the length of the period the drug service from the
patient submits the prescription until the patient
receives the drug, and drug information is measured
by time. Determination of the time dimension in drug
service is intended so that patients feel comfortable
and not wait for a long time (Kautsar, Nurhayati, &
Gozali, 2017). Based on the RI Minister of Health
Decree No. 129 of 2008 concerning Hospital
Minimum Service Standards, indicators and
standards of service in pharmacy for finished drugs ≤
30 minutes and formulated medicines ≤ 60 minutes
(Indonesian Ministry of Health., 2008). The process
of receiving recipes and giving prices is done by
administrative staff. The clerk receives a prescription
from the patient, gives the serial number, checks the
availability of drugs, performs a price calculation, and
writes the price on the prescription. Most of the
process of receiving recipes and giving the price of
drugs takes 4 minutes (23.97%). This process uses a
computer so that if the computer experiences an
interruption, then this process will take about 1-9
minutes. In the payment process, the cashier calls the
patient to make a payment and provides a payment
receipt after the patient pays. This process is carried
out by one cashier clerk who requires the skills and
agility of officers to enter payment transactions into
computers, print receipts, swipe cards, both credit
cards or guarantee cards, and count money. Some of
these processes took 4 minutes (23.98%). During the
study period, researchers found that several
respondents who made the payment process took up
to 8 minutes. These respondents came from insurance
patients who, at the time, needed a long time due to
technical constraints on the machine and waited for
confirmation from the guarantor. The process of
supplying and compounding medicine is carried out
by two pharmacist assistants and a prescription
interpreter. This process requires the knowledge of
officers to determine the location of drugs along with
substitute drugs if the medicines written on the
prescription do not exist. Besides, it takes the skills
and ability of officers in choosing and preparing
concoction drugs. Most of the time of taking and
compounding the drug is 10 minutes (16.96%), where
the fastest time is 1 minute (7.02%), and the longest
time is 13 minutes (2.34%). This process takes time
because the staff needs to count the number of drugs
to be mixed, wrap, or put the medicine into capsules
one by one or put the mixture of medications into a
container. Officers also need to see a list of
guaranteed drugs and confirm to the doctor or patient
if the prescribed drug is not available. The process of
administering drug etiquette is carried out after the
officer checks the suitability of the drug with the
prescription. The observations showed that the
majority of drug etiquette time was 2 minutes
(31.58%), the fastest time was 1 minute (4.68%), and
the longest time was 9 minutes (1.75%). This process
requires the officers' skills in writing and sticking to
drug labels, checking the compatibility of drugs with
prescriptions, and making copies of medicines if
needed. The process of drug delivery is carried out
by the drug delivery officer. Officers bring drugs to
the drug delivery counter, call the patient, check the
suitability of the patient's identity with proof of
payment receipt, and provide an explanation of the
rules of use. The process of drug delivery takes 4
minutes (25.15%), with the fastest time is 1 minute
(4.10%), and the longest time is 9 minutes (0.58%).
4 CONCLUSION
1. Importance and Performance Analysis results
obtained 6 attributes whose roles are considered
the most important but the patient has not felt
satisfied performance, namely medicine is easy
to get, opening hours of service on time,
Medication services are well served when the
patient asks for an explanation of the drug, the
waiting room is clean, Seating in the lounge is
comfortable, and the atmosphere of the waiting
room is calm.
2. The results of the gap analysis showed that the
attributes of the most significant gap were the
attributes of a quiet waiting room atmosphere,
ICOH 2019 - 1st International Conference on Health
90

pharmacists providing satisfactory consulting
services, and officers responding to patient
problems.
3. The average serving of medicines has met the
standards, according to the Indonesian Minister
of Health No. 129/2008, which shows that the
prepared recipe can be served in no more than 30
minutes, and the recipe for the concoction will be
ready within 60 minutes.
REFERENCES
Abalo, J., Varela, J., & Manzano, V., 2007. Importance
values for Importance-Performance Analysis: A
formula for spreading out values derived from
preference rankings. Journal of Business Research,
60(2), 115–121.
Daniel, C. N., & Berinyuy, L. P., 2010. Using the
SERVQUAL Model to assess Service Quality and
Customer Satisfaction. An Empirical Study of Grocery
Stores in Umea. Umea School of Business, 1–78.
Deeks, A., Lombard, C., Michelmore, J., & Teede, H.,
2009. The effects of gender and age on health related
behaviors. BMC Public Health, 9, 1–8.
Deng, J., & Pierskalla, C. D., 2018. Linking importance-
performance analysis, satisfaction, and loyalty: A study
of Savannah, GA. Sustainability (Switzerland), 10(3).
Gigantesco, A., Fagnani, C., Toccaceli, V., Stazi, M. A.,
Lucidi, F., Violani, C., & Picardi, A., 2019. The
relationship between satisfaction with life and
depression symptoms by gender. Frontiers in
Psychiatry, 10(Jun), 1–9.
Ginting, A., 2009. Application of Pharmaceutical Services
Standards in Medan in 2008. Jurnal USU Medan.
Hariany, Z. (2014). Analysis of Community Satisfaction
Index (IKM) Towards Public Services at Puskesmas
Xxx. Jurnal Teknik Industri USU, 5(2), 17–21.
Indonesian Ministry of Health., 2004. Decree Of The
Minister of Health of The Republic Of Indonesia No
1197/MENKES/SK/X/2004.
Kautsar, A. P., Nurhayati, N. R., & Gozali, D., 2017. Effect
of prescription waiting time on patient satisfaction
mediated by service quality of pharmacy unit in public
hospital in Bandung city. National Journal of
Physiology, Pharmacy and Pharmacology, 7(11),
1230–1234.
Indonesian Ministry of Health., 2008. Decree of the
Minister of Health of the Republic of Indonesia No.
129/Menkes/SK/II/2008.
Kothari, R., 2004. Research Methodology, Methods and
Techniques. In C. Kotharr (Ed.), (2nd ed.). Jaipur: New
Age International.
M. A. Abujarad Alhuwitat, & Salem, F. S., 2017. The
Impact Of Pharmaceutical Services Quality On
Building A The Impact Of Pharmaceutical Services
Quality On Building A Strong Relationship Between
Pharmacists And Their Customers Introduction : As a
result of globalization , great changes on the economic.
International Journal of Pharmaceutical Sciences and
Research, Volume 8(July), 3138–3145.
Minta, N. K., & Stephen, O., 2017. Importance-
Performance Matrix Analysis (IPMA) of Service
Quality and Customer Satisfaction in the Ghanaian
Banking Industry. International Journal of Academic
Research in Business and Social Sciences, 7(7), 532–
550.
Muslicnah, M, W., & Syamsudin., 2010. The Influence of
Environmental Factors, Individual Factors, and
Marketing Communication Factors on the Purchase
Decision of Pharmaceutical Drugs between Pharmacy
in Sukoharjo Regency and Pharmacy in Surakarta City.
Jurnal USU, 11(7), 73–74.
Ofili, O., 2014. Patient Satisfaction In Healthcare Delivery–
A Review Of Current Approaches And Methods.
European Scientific Journal, 10(25), 25–39.
Indonesian Ministry of Health., 2009. Government
Regulation Of The Republic Of Indonesia Number 51
Of 2009 Concerning Pharmaceutical Work..
Saraswati, M. S., Kristina, S. A., & Zulkarnain, A. K., 2018.
Perceived Service Quality and Patient Satisfaction At
Pharmacy Department in Yogyakarta, Indonesia.
International Journal of Pharmacy and Pharmaceutical
Sciences, 10(2), 42.
Setiawan, N., 2007. Determination Of Sample Sizes Using
Formula Slovin And Krejcie-Morgan Table: Concept
And Its Application. Diskusi Ilmiah Jurusan Sosial
Ekonomi Fakultas Peternakan UNPAD, (November),
10.
Zimmerman, E., & Woolf, S. H., 2014. Understanding the
Relationship Between Education and Health. NAM.
Quality Evaluation of Pharmacy Services in the Outpatients at Hospital in Jakarta
91
