
Online Decoding in the Auditory Cortex using Functional
Near-infrared Spectroscopy
Hendrik Santosa
1
and Arjon Turnip
2
1
Department of Radiology, University of Pittsburgh,Pittsburgh, USA
2
Department of Electrical Engineering, Universitas Padjadjaran, Indonesia
Keywords: functional near-infrared spectroscopy (fNIRS), auditory cortex, online decoding.
Abstract: The aim of this study is to decode the hemodynamic response evoked by six sound categories (generated from
various speech and non-speech sounds) using functional near-infrared spectroscopy (fNIRS). fNIRS is used
to examine the concentration changes of oxy-hemoglobin (HbO) and deoxy-hemoglobin (HbR) in the bilateral
auditory cortex from 7 healthy subjects. For offline processing, linear discriminant analysis (LDA) classifier
is utilized to classify various sound categories. For an online processing, general autoregressive linear model
with iteratively reweighed least squares (AR-IRLS) algorithm for single trials is investigated. In the results,
we found that the overall two-class classification accuracies were 71.3 ± 8.0% (offline) and 73.2 ± 14.7%
(online) with two different schemes. The computation time for classification took less than two seconds, which
demonstrates the potential of using an online AR-IRLS classification for decoding what people hear in daily
life.
1 INTRODUCTION
FNIRS is non-invasive brain imaging method that
uses safe levels of near-infrared light to penetrate the
head and brain to record changes in the cerebral blood
volume and oxygenation. In most studies, two or
more wavelengths of light are recorded, which
provide information to spatially and temporally
distinguish both oxy-hemoglobin (HbO) and deoxy-
hemoglobin (Hb) changes via modified Beer-
Lambert law (Cope et al, 2006; Santosa, Fishburn,
Zhai, Huppert 2019; Pollonini, L., et al 2014). Figure
1 show one example of the HbO data from finger-
tapping task activation. Using a grid of optical light
source and detector positions, fNIRS can record the
spatial distribution of changes in hemoglobin during
functional tasks, providing a measurement of
underlying brain activity. The similar research about
brain activity has been done with different tools
(Simbolon et al, 2016, Turnip et al, 2016, Turnip and
Simbolon, 2016).
FNIRS has been shown to be promising tool in
investigating sound and speech processing in these
populations (Pollonini, L., et al 2014). Compared to
functional magnetic resonance imaging (fMRI),
fNIRS recordings are silent, cost less, and can be
performed in an environment that is more conducive
to specific studies. Applications of this technology
have the potential to provide feedback for speech
therapy or in the tuning of hearing aid devices (e.g.,
cochlear implants) at an early stage of development
based on brain recordings. Several groups have
demonstrated the use of fNIRS in measuring brain
responses in deaf children with cochlear implants
(Lawler, C. A., et al, 2015).
Figure 1: Oxy-hemoglobin (HbO) of 2-s finger-tapping task
with the range of interstimulus interval between 4 and 20 s
(average = 12 s), which is averaged from 2,200 responses
(Huppert, T. J. et al, 2006). The thin dotted line and thin
dashed line represent 25 to 75 and 5 to 95 percentiles,
respectively. The thick line shows the average (normalized)
evoked response for 2-s task period (Pollonini, L., et al 2014).
Santosa, H. and Turnip, A.
Online Decoding in the Auditory Cortex using Functional Near-infrared Spectroscopy.
DOI: 10.5220/0009512203330340
In Proceedings of the International Conference on Health Informatics and Medical Application Technology (ICHIMAT 2019), pages 333-340
ISBN: 978-989-758-460-2
Copyright
c
2020 by SCITEPRESS – Science and Technology Publications, Lda. All rights reserved
333

The aim of the present study is to identify what
humans hear upon a set of training data by measuring
the task-evoked hemodynamic responses from the
auditory cortex bilaterally. Six sound categories
(English-speech, non-English-speech, annoying
sounds, nature sounds, classical music, and gunshot
sounds) are investigated. In our previous work using
four sound categories (Hong and Santosa, 2016), we
showed the potential of fNIRS to measure
hemodynamic response from 18 subjects in offline
scheme, which are temporally and spatially
distinguishable. In those offline analyses, all the trials
from the whole experiment were used in the
classification and thus the approach is not suitable for
an online brain-computer interface. In this work, we
investigate the possibility of performing online
processing using six different sound categories. The
algorithm requires filtering (including removal of
artifacts such as motion and systemic global
response) and estimation should be performed as
quick as possible to keep up with the data rate.
In this work, a single trial general linear model is
used base on our iterative autoregressive least squares
algorithm (Barker, J. W., et al., 2013), which has been
also extended for a real-time process (Barker, J. W.,
et al., 2016). This algorithm uses a two-stage
autoregressive whitening model and robust
regression to statistically account for false discoveries
due to serially correlated errors due to systemic global
response and motion artifacts and does not require
additional pre-processing or filtering, which makes it
ideal for real-time analysis. Using this algorithm, the
auditory evoked hemodyamic responses to these six
sound categories were estimated from fNIRS data in
simulated online conditions (offline analysis but
mimicking the conditions of online analysis).
Furthermore, we interpret the confusion matrix in the
LDA model for summarizing the performance of
actual and predicted classifications done by the
classification system.
2 MATERIALS AND METHODS
2.1 Stimuli
A total of 7 subjects (age 27 3 years, 2 females, 2
left-handed). All the subjects had normal hearing and
no history of any neurological disorder. All subjects
were informed about the nature and purpose of the
respective experiments before providing their written
consent. In the 6-class problem, each subject lay
down on a bed. All subjects were asked to remain
relaxed, to close their eyes and to avoid major bodily
movements during the experiment. The subjects were
asked to listen attentively to various audio-stimuli and
to guess in their mind which category was heard for
each stimulus. After the experiment, all were asked to
verbally explain whether they were able to distinguish
what they had heard precisely or not. The fNIRS-
experimentation of healthy subjects along with the
entire experimental procedure was conducted in
accordance with the Declaration of Helsinki and the
guidelines approved by the Ethics Committee of the
Institutional Review Board of Pusan National
University.
2.2 Audia Stimuli
The audio-stimuli consisted of six different sound
categories selected from a popular website
(http://www.youtube.com). As shown in Table 1, the
first and second categories entailed speech-hearing
from a number of languages (i.e., English and several
non-English) chosen from a language proficiency
test. It is noted that the subjects were Indonesian,
Korean, Chinese, Vietnamese, and Pakistani.
Table 1: Audio categories (M: male, F: female) (Hong and
Santosa, 2016)
Non-vocal hearing
Trial
English
Non-English
1
M
Russian (F)
2
F
German (F)
3
M
French (F)
4
MF*
Bulgarian (MF*)
5
F
Italian (MF*)
6
F
Japanese (F)
Non-vocal hearing
Trial
Annoying
sound
Nature
sound
Music
Gunshot
1
Baby cry
River
Canon in D
10 times
2
Car alarm
Forest
Canon in D
10 times
3
Police siren
Rain
Canon in D
10 times
4
Horror
sound
Jungle
Canon in D
10 times
5
Male
scream
Ocean
Canon in D
10 times
6
Nuclear
alarm
siren
Waterf
all
Canon in D
10 times
*MF denotes male-female conversation
Therefore, in this study, each participant
understood only English among all other speech
sound categories. Additionally, the non-English
speech sound categories were Russian, German,
French, Bulgarian, Italian, and Japanese. The third
ICHIMAT 2019 - International Conference on Health Informatics and Medical Application Technology
334
and fourth categories were annoying sounds and
nature sounds. Those stimuli are almost identical with
the previous work as emotional category (Plichta, et al,
2011). The fifth category was a segment of classical
music (Canon in D by Pachelbel). The sixth category
was gunshot sounds at a frequency of 1 Hz (i.e., 1
gunshot sound every second). Each stimulus
consisted of an audio duration of 10 sec followed by
a quiet rest of 20 sec. In addition to the 24 and 36
audio-stimuli, pre- and post-trials (classical music
which is a different song with the fifth category) were
added (neither of which was included in the data
processing). Accordingly, the entire fNIRS recording
took about 19 min. All audio-stimuli were digitally
mixed using the Adobe Audition software (MP3-
format file: 16-bit quantification, 44.1 kHz sampling,
stereo channel) and were normalized to the same
intensity level (i.e., average RMS). Active noise-
cancellation earbuds (Sony MDR-NC100D) were
utilized for acoustic stimulation of all subjects with
the same sound-level setting. After each fNIRS
recording session, all of the subjects reported that
they were able to distinguish the sound items among
the sound categories accurately in every trial.
2.3 FNIRS Measurement
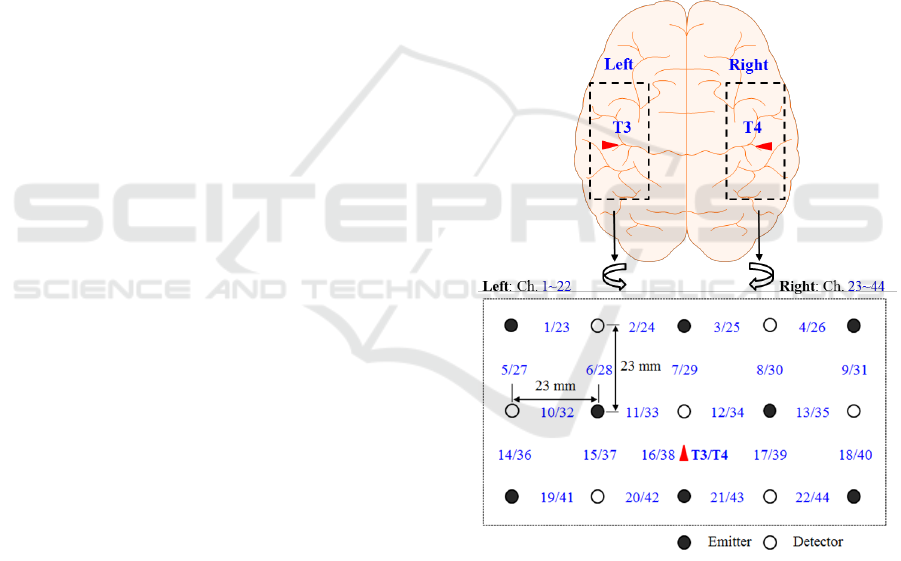
Figure 2 shows the optode configuration of the
continuous-wave fNIRS system (DYNOT: DYnamic
Near-infrared Optical Tomography; NIRx Medical
Technologies, Brooklyn, NY) for bilateral imaging of
the auditory cortex in both hemispheres. The emitter-
detector distance was 23 mm, and the sampling rate
was set to 1.81 Hz at two wavelengths (760 and 830
nm). The optode configuration consisted of 3 × 5
arrays (8 emitters and 7 detectors) with 22 channels
(e.g. emitter-detector measurement pair) for each
hemisphere. The two 22-channel sets were placed on
the scalp covering the left (Channels 1-22) and right
(Channels 23-44) temporal lobes. According to the
International 10-20 system, Channels 16 and 38 were
placed at T2 and T4 locations, respectively (Santosa,
H., et al, 2014). It should be noted that, in the left
hemisphere, both Broca’s area and Wernicke’s area
were covered by this configuration. Finally, during
the experiment, all of the lights in the room were
switched off to minimize signal contamination from
ambient light sources.
The measured intensity data of the two wavelengths
were converted to relative oxy-hemoglobin (HbO)
and deoxy-hemoglobin (HbR) concentration changes
using modified Beer-Lambert law (1. Cope, M. et
al, 1998). All analyses were done using our NIRS
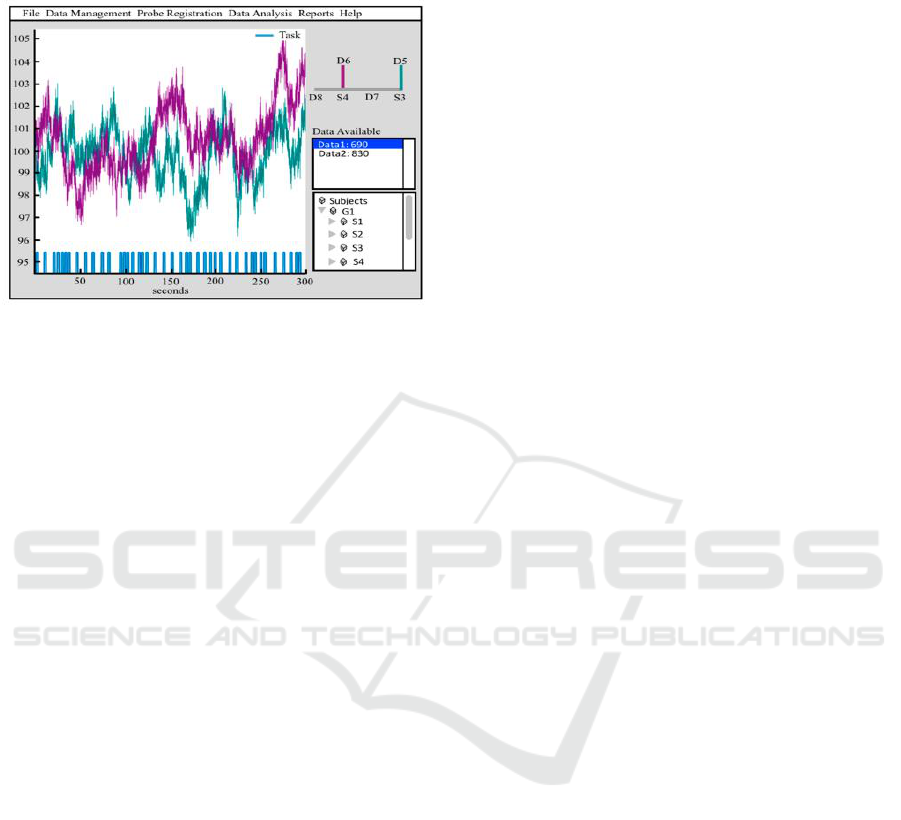
Brain AnalyzIR toolbox (Santosa et al, 2018). Figure
3 shows the screenshot of nirs.viz.nirsviewer to
visualize the time series of raw data (690 nm) for two
channels with its stimulus info. The menu commands
(i.e., File, Data Management, Probe Registration,
Data Analysis, Reports, Help) provide access to most
operations available in the toolbox through the
graphical interface for users who prefer not to use the
command line. For example, this GUI will provide
the ability to load NIRS files, edit subjects
demographics, register probe, etc. The GUI also
provides access to data structures (e.g.., raw,
wavelength, hemoglobin data, etc.) and NIRS files
(subject information from demographics). The
stimulus design and signal from a particular channel
can be viewed by selecting the corresponding source-
detector pairs in the probe configuration. In Figure 3,
it shows two channels from 300 s data of 690 nm with
the stimulus design of the task (“Task”).
Figure 2. Optode configuration: The numbers represent the
measurement channels, where Channels 16 and 38 coincide
with T3 and T4 locations in the International 10-20 System
(Sentosa et al, 2014).
2.4 Pre-processing for Classification
In our study, we employed the AR-IRLS algorithm as
pre-processing for single trial in every channel of
fNIRS data. The single-trial regression model used
each trial as a separate regressor. The resulting
regression coefficients (beta) of the HbO and HbR
Online Decoding in the Auditory Cortex using Functional Near-infrared Spectroscopy
335
responses for each trial and their associated t-statistic
estimates were used in the classification process.
Figure 3: Graphical user interface of AnalyzIR toolbox
(Sentosa et al, 2018).
2.5 LDA Classification
In this work, we examined two different schemes for
classification: offline and online versions of
classification model using LDA classifier. LDA
performs better than support vector machine (SVM)
for these sound categories activation using fNIRS
particularly in 4-class problem as already shown in
the previous works (Hong and Santosa, 2016). The
offline model used the data from all trials for each
subject in the subject level classification. Thus, the
offline model can only be run after the scan is
completed and makes use of the whole time course of
data. To determine the offline classification accuracy,
we used leave-one-out cross-validation for every
subject. In comparison, the online classification
model has been trained using all trials up to the
current test trial. Thereafter, the training data were
updated accordingly as time passed. For example, in
4-class problem (total of 24 trials), when trial 23 was
tested in the program, trials 1~22 were used as
training data. Thus, the online version of the model
mimics the conditions of real-time feedback, whereas
the offline model represents the expected upper-limit
of model performance. For both versions, all
computation was done post-hoc and not in actual real-
time.
Beta- and t-values from every channel and every
trial were used for features selection as the output
from AR-IRLS algorithm. This method entails the
following steps: i) For offline process (subject level),
take one trial as testing data and the rest trials as
training data. (ii) Repeat i) in all data, that is, 24 and
36 iterations for 4-class and 6-class problem,
respectively. iii) Compute the accuracy of each
subject by comparing the predicted one with the
group data. The classify function available in
MatlabTM was used as a classifier. iv) Furthermore,
the confusion matrix on the group data (confusionmat
function available in MatlabTM) contains
information about actual and predicted classification
done by the previous classification system (leave-out-
out) was investigated. This confusion matrix allowed
us to determine the best distinguishable classes in
these sound categories. v) Based on the confusion
matrix, we binned the four-class problem into two-
class problem (i.e., speech and non-speech sound
categories) for online processing. It also confirmed
the accuracy for those categories in subject level by
comparing the classification performance with other
possible categories. vi) For online process, train on
the first-half data set (update accordingly as time
passes) and test on the second-half data using LDA
classifier. vii) Calculate the accuracy for each subject
and its average. viii) Additionally, the dendrogram
function available in MatlabTM was used as a binary
cluster tree to see the hierarchy on the feature space
of each category. This allowed us to examine the
relationships and similarities in feature space between
the different categories of sounds. The binary
classification based on clusters was repeated 100
times for each subject to calculate standard
deviations.
3 RESULTS
3.1 Four-class Model (Previous Works)
As seen in Figures 4 and 5, the obtained t-values were
displayed as a map in order to illustrate the activation
in the covered brain region; the intermediate values
were interpolated with the Matlab function interp2
using 22 t-values from 22 channels. On these t-maps,
the numbers, the color in pixel, and the color bar in
the lower-right corner indicate the channel numbers,
signal intensity, and color scale of the t-value of that
pixel, respectively. Figure 5 shows the activation map
averaged over the 18 subjects, thus demonstrating the
overall trends.
ICHIMAT 2019 - International Conference on Health Informatics and Medical Application Technology
336
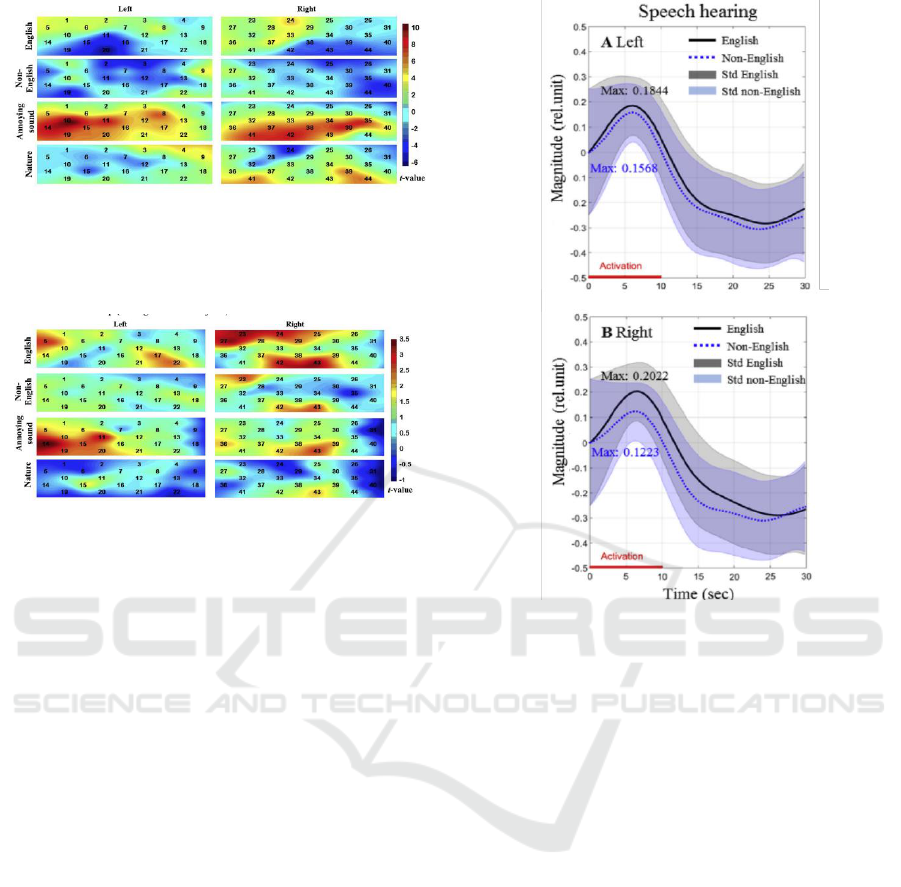
Figure 4: HbO in the left and right auditory cortices evoked
by four different sound-categories (Subject 11): Active
channels appear differently upon auditory stimuli (Hong
and Santosa, 2016).
Figure 5: The averaged HbO (over 18 subjects) in the left
and right auditory cortices evoked by four different sound-
categories (Subject 11) (Hong and Santosa, 2016).
Figure 6 compares the average HbO signals and
the standard deviations over 18 subjects for English
and non-English hearing in both hemispheres, while
Figure 7 compares those annoying and nature sounds.
The averaging was performed on 108 data points, that
is 18 subjects multiply by 6 trials, for each category.
The shaded areas along the mean values represent
their standard errors. The number inside the figures
indicate the peak values of the individual HbO
response. For example, 0.1890 and 0.0888 in Figure
7 are the peak values for nature and annoying sounds
in the left hemisphere, respectively.
Figure 6: The averaged HbOs (over 18 subjects) and their
standard deviations for English and non-English speech
(Hong and Santosa, 2016).
Next, to investigate language-related
classification capability, two-class classification
problems were performed. Figures 8A and 8B plot the
classification results for speech hearing (English vs.
Non- English) and sound hearing (annoying sounds
vs. natural sounds), respectively. In both cases, as can
be seen, the classification performance was
significantly above the chance (i.e., 50%) level. As
shown in Figures 8A (speech hearing), the average
classification accuracies using LDA were 71.03 ±
8.72% (left) and 70.03 ± 8.97% (right) and those by
SVM, 68.18 ± 8.30% (left) and 68.07 ± 7.59% (right).
As shown in Fig. 8B (sound hearing), the average
classification accuracies using LDA were 74.97 ±
11.74% (left) and 71.80 ± 9.89% (right), and those by
SVM, 72.34 ± 9.72% (left) and 72.15 ± 9.77% (right),
respectively. The overall-averaged classification
accuracies were 70.53 ± 8.79% (LDA) and 68.11 ±
7.90% (SVM) for speech hearing and 73.39 ± 10.82%
(LDA) and 72.24 ± 9.61% (SVM) for sound hearing.
Online Decoding in the Auditory Cortex using Functional Near-infrared Spectroscopy
337
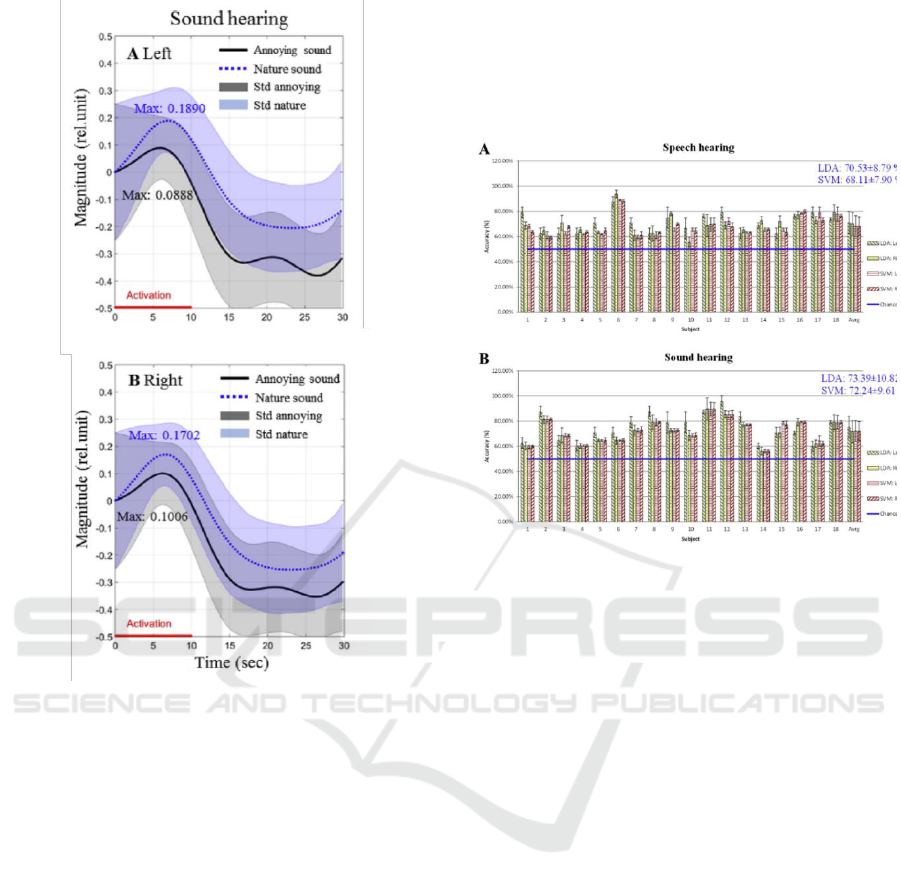
Figure 7: The averaged HbOs (over 18 subjects) and their
standard deviations for annoying and nature sounds (Hong
and Santosa, 2016).
3.2 Six-class Model
In the second experiment (6-class problem), a total of
7 subjects listened to six repetitions of each of six-
categories of sound stimulus (36 total trials). In
addition to the four categories from 6-class problem,
a gun-shot (GS) and music (M) were also presented.
However, the classification performance in 6-class
problem was not effective for BCI application.
Contrary to expectations, the result (speech and non-
speech classification) from 6-class problem did not
find a significant result for both offline and online
schemes (near the chance levels). For offline
processing, the average classification accuracies for
two- and six-class classification were 56.8 11.0%
and 20.6 3.9%, respectively. The two-class
classification was the same class with 4-class problem
(i.e., speech and non-speech sound categories).
Moreover, for online processing, the average
classification accuracy was 61.90 7.5% with
maximum accuracy 72.2% in one subject (range 50.0
- 66.7%) for the two-class problem. This finding was
unexpected and suggests that the subject heard too
many sound categories or class problem, and the
program had difficulty in distinguishing them.
Figure 8: Classification accuracies of two sound-categories:
(1) Speech hearing (English vs non-English), (b) sound
hearing (annoying vs natural sounds) (Hong and Santosa,
2016).
Next, to investigate the online classification
capability, we performed the classification in every
subject. Figure 12 shows the comparison between
offline (black, plus-sign) and online processing (blue,
cross-sign). The average classification accuracy was
73.2 14.7% for online processing. For online
processing, two cases showed the highest
classification accuracies of 91.7% (e.g., Subs. 1 and
10). It is noted that the classification in online
processing only tested in the second half data by using
trials 1-12 as initial training data. However, the online
performance showed a comparable accuracy to the
offline scheme. Notably, the computation time was
suitable for brain-computer interface (BCI)
applications. Specifically, the computation (or
running) times was 1.39 sec for each trial including
AR-IRLS as pre-processing and classification
processes.
ICHIMAT 2019 - International Conference on Health Informatics and Medical Application Technology
338
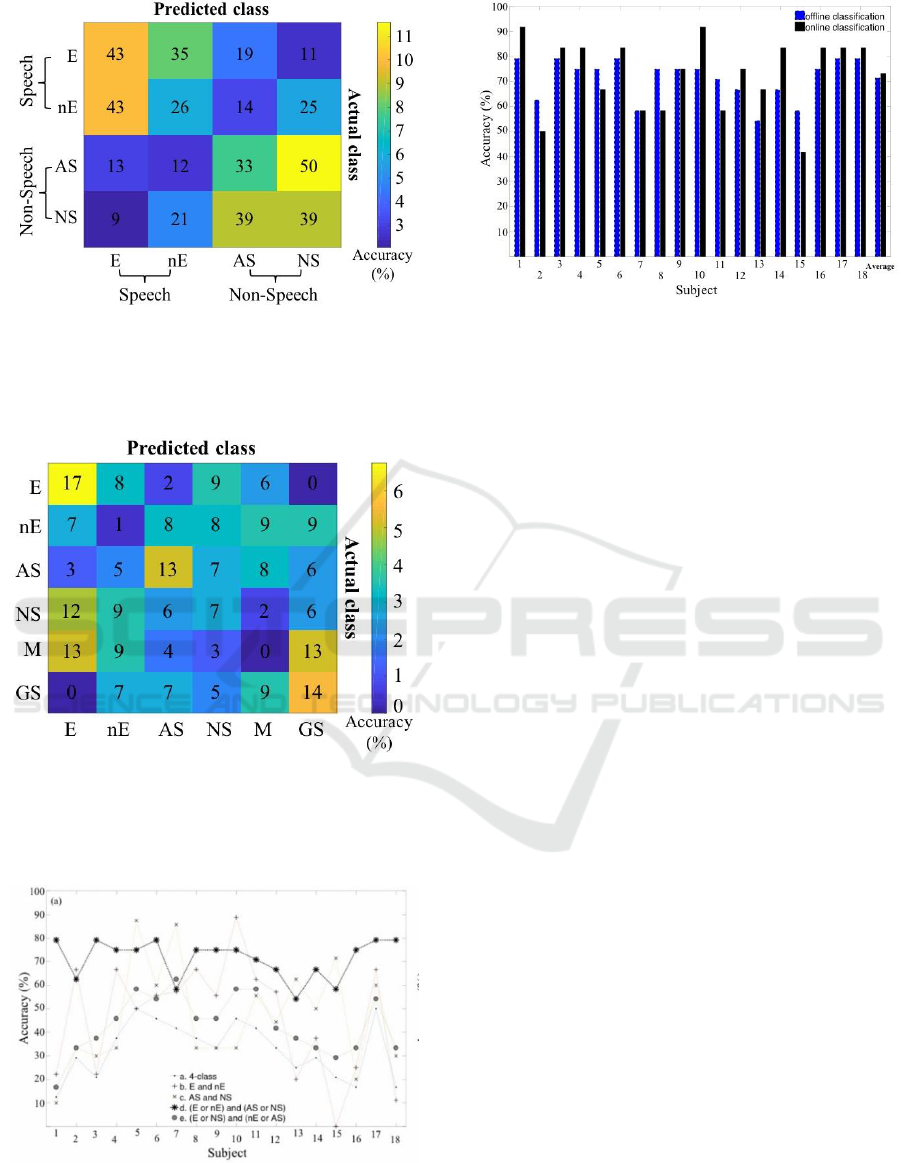
Figure 9: Confusion matrix (over 18 subjects): The
performance of the classification model for four class
problem. Numbers represent the counts of correct
estimates; color in a pixel and color bar in the right corner
indicate the percentage of those counts.
Figure 10: Confusion matrix (over 7 subjects): The
performance of the classification model for six class
problem. Numbers represent the counts of correct
estimates; color in a pixel and color bar in the right corner
indicate the percentage of those counts.
Figure 11: Classification accuracy: The comparison for
different combinations of classes in every subject. Legends
a and b-e show the performance for size- and four-class,
respectively.
Figure 12: Comparison of offline (plus0sign and solid-line)
and online (cross-sign and dotted-line) performances:
Individual accuracies for speech and non-speech categories
in six class problem. It is noted that only the second-half
data is tested for online processing.
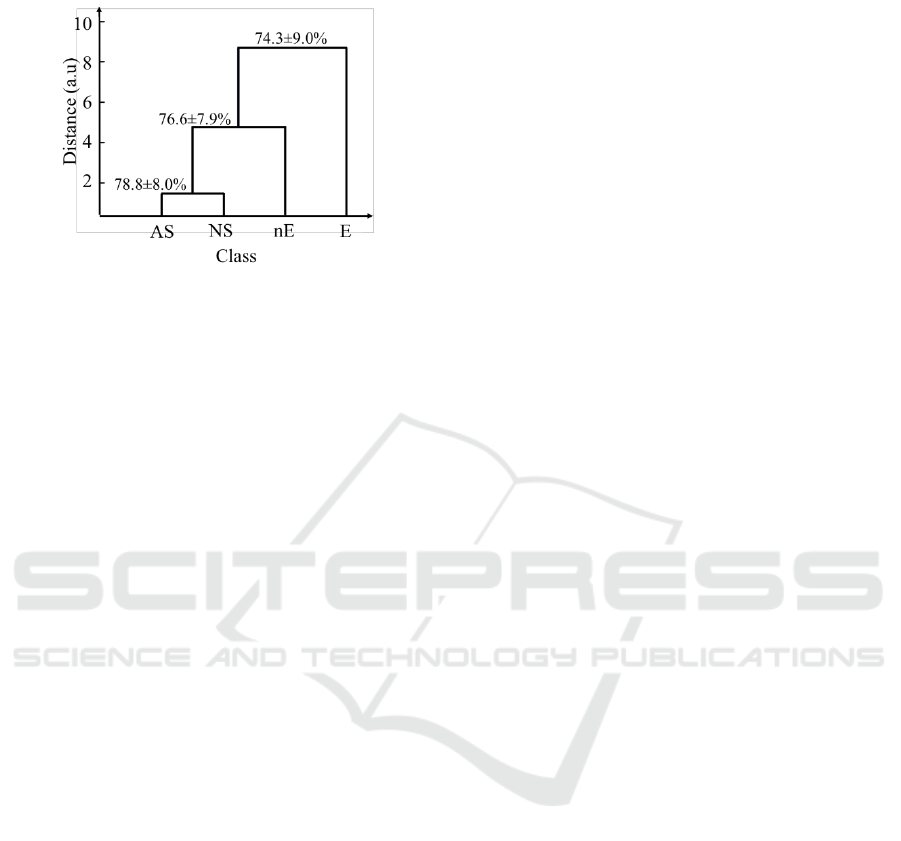
For the four-class models, we examined the
relationship of the categories using hierarchical
clustering based on the feature space of each category
as shown in Figure 13. In the dendrogam plots, the
relationship between each class is clustered based on
a series of binary (two-way) classification decisions.
The height of the branch/decision point on the y-axis
indicates the distance separating the feature space of
the two super-categories. The percentage shows the
accuracy between the two super-categories. For
example, English [E] can be separated from
everything else (non-English [nE], nature sounds
[NS], and annoying sounds [AS]) at 74.3 9.0%
accuracy. The English sound is most closely related
to the non-English sound as indicated by the higher
position of the branch point on the graph. Similarly,
we found that for the four-class problem, the
annoying and nature sounds were more similar to
each other than they were to the English and non-
English categories.
A further limitation of this study was the very
low of sample size in the experiment. Especially, this
limitation made the classifier performance was
getting worse in the 6-category model. In future
studies, a possible means of increasing classification
accuracy is to increase the number of trials.
Moreover, to make the HRs (HbO and HbR) return to
the baseline, a rest period of at least 20 sec is needed.
It should be noted that a longer experimental time
causes subject fatigue. This underscores the necessity
of good environmental conditions for long-duration
experimentation. Finally, use of an auditory paradigm
to further develop the system to improve accuracy
would enable valuable expansion of the proposed
Online Decoding in the Auditory Cortex using Functional Near-infrared Spectroscopy
339
online scheme for decoding what humans hear upon
a set of training data.
Figure 13: Hierarchical clustering: Dendogram for 4-class
problem. The height (y-xis) indicates the distance
separating the feature space of the two super-categories; the
percentage numbers show the accuracy between those
super-categories.
4 CONCLUSIONS
This paper demonstrated the feasibility of our
proposed online method and discussed its
potentialities for processing in decoding brain
activity. This study used fNIRS signals evoked by
audio-stimuli from multiple sound categories. To
account for data processing in our online scheme, the
AR-IRLS algorithm as pre-processing, feature-
selection, and classifier performance were discussed.
Interestingly, the performance of online classification
was higher than the chance levels in almost subjects.
Finally, the authors conclude that the fNIRS signals
evoked by audio-stimuli from multiple sound
categories can be effectively utilized in an online
decoding scheme.
ACKNOWLEDGEMENTS
This research was supported by the University of
Pittsburgh Department of Radiology, USA and
Department of Electical Engineering, Universitas
Padjajaran Indonesia.
REFERENCES
Barker, J. W., et al., Autoregressive model based algorithm
for correcting motion and serially correlated errors in
fNIRS, Biomedical Optic Express 4, 1366-1379, 2013.
Barker, J. W., et al., Correction of motion artifacts and
serial correlations for real-time functional near-infrared
spectroscopy Neurophotonics 3, 031410, 2016.
Cope, M. et al., Methods of quantitating cerebral near
infrared spectroscopy data, Adv. Exp. Med. Biol. 222,
183-189, 1988.
Hong, K.-S. and Santosa, H., Decoding four different
sound-categories in the auditory cortex using functional
near-infrared spectroscopy, Hearing Research 333,
157-166, 2016.
Huppert, T. J. et al., A temporal comparison of BOLD,
ASL, and NIRS hemodynamic responses to motor
stimuli in adult humans, Neuroimage 29(2), 368-382
(2006).
Lawler, C. A., et al., The use of functional near-infrared
spectroscopy for measuring cortical reorganization in
cochlear implant users: A possible predictor of variable
speech outcomes? Cochlear Implantts Int. 16, S30-S32,
2015.
Pollonini, L., et al., Auditory cortex activation to natural
speech and simulated cochlear implant speech
measured with functional near-infrared spectroscopy,
Hearing Research 309, 84-93, 2014.
Plichta, M. M., et al., Auditory cortex activation is
modulated by emotion: A functional near-infrared
spectroscopy (fNIRS) study, Neuroimage 55, 1200-
1207, 2011.
Santosa, H., Fishburn, F., Zhai, X., Huppert, T. J.,
Investigation of sensitivity-specificity of canonical- and
deconvolution-based linear models in evoked
functional near-infrared spectroscopy, Neurophotonics
6(2), 025009 (2019).
Santosa, H., et al., Lateralization of music processing
auditory cortex: An fNIRS study, Frontier Behavioural
Neuroscience 8, 00418, 2014.
Santosa, H., et al., The NITS brain AnalyzIR toolbox,
Algorithms 11(5), 73, 2018.
Simbolon, A. I. et al. (2016) ‘An experiment of lie detection
based EEG-P300 classified by SVM algorithm’,
Proceedings of the 2015 International Conference on
Automation, Cognitive Science, Optics, Micro Electro-
Mechanical System, and Information Technology,
ICACOMIT 2015, pp. 68–71. doi:
10.1109/ICACOMIT.2015.7440177.
Turnip, A. et al. (2016) ‘EEG-based brain-controlled
wheelchair with four different stimuli frequencies’,
Internetworking Indonesia Journal, 8(1), pp. 65–69.
Turnip, A. and Simbolon, A. I., “Online Brain Activity
Extraction from EEG-P300 Signals with Nonlinear
Autoregressive Model” Internetworking Indonesian
Journal, vol. 8, no. 1, 2016.
ICHIMAT 2019 - International Conference on Health Informatics and Medical Application Technology
340
