
Stress, Mean Arterial Pressure, and Roll over Tests as a Predictor of
Pregnancy Hypertension
Nikmah Jalilah Ritonga, Diah Evawanna Anuhgera, Damayanti, Wilda Wahyuni Siregar,
Riris Sitorus and Sri Wulan
Health Institute of Medistra, North Sumatra
Keywords: Stress, Mean Arterial Pressure, Roll over Test, Pregnancy Hypertension
Abstract: All three of causes from the high maternal mortality rate (MMR) in Indonesia are bleeding, hypertension and
infection. These three main causes have changed in proportion, where bleeding and infection tend to decrease
while hypertension increases. Seeing a lot of research on stress, MAP and ROT associated with pregnancy
hypertension, but there is no method to predict pregnancy hypertension, so done research on stress, MAP,
ROTS as predictors of pregnancy hypertension. This research used a cross sectional study method. The
research subjects consisted of 50 normal tension pregnant women and 50 hypertensions, according to
inclusion and exclusion criteria. Data on characteristics, obstetric history and stress were measured using a
standard questionnaire. MAP and ROT were measured 3 times (gestational age 27, 28 and 32 weeks. The
results of the research concluded that stress, MAP and ROT are associated with the incidence of hypertension
in pregnancy. Stress, MAP and ROT can be used as predictors of pregnancy hypertension (age of pregnancy
27 and 32 weeks).
1 INTRODUCTION
The main complications causing nearly 75% of
maternal deaths are heavy bleeding, puerperal
infections and high blood pressure during pregnancy.
Globally, almost 99% of maternal deaths occur in
developing countries. The ratio of maternal deaths in
developing countries in 2015 was 239 per 100,000
live births versus 12 per 100,000 live births in
developed countries, this is still far from the target of
2030 which is 70 per 100,000 live births (WHO,
2015)
Until now the maternal mortality rate (MMR) in
Indonesia is still relatively high, which was recorded
in 2012 of 359 per 100,000 live births. This figure is
still far from the SDG’s target in 2030 of 70 per
100,000 live births.
The 3 main causes of high MMR
in Indonesia are bleeding, hypertension and infection.
Indonesia Health Profile data in 2015 shows
hypertension is the second largest contributor to
MMR and has increased from year to year, namely in
2012 (26.9%) and in 2013 (27.1%). These three main
causes have changed in proportion, where bleeding
and infection tend to decrease while hypertension
increases (Kemenkes, 2016)
Hypertension is the most frequent medical
complication in pregnancy (5-10% of pregnancy).
About 30% of hypertension is caused by chronic
hypertension and 70% is caused by pre-eclampsia -
gertational hypertension. Understanding the disease
process and its impact on pregnancy are the most
important thing, because hypertension is still a major
cause of maternal and perinatal morbidity and
mortality worldwide. Complication that occur in the
mother can include placental abruption, Disseminated
Intravascular Coagulopathy (DIC), eclampsia, kidney
failure, bleeding or liver failure, intracerebral
hemorrhage, hypersensitive enceopathy, pulmonary
edema and death. Meanwhile, complications that
occur in the fetus and neonatal include retardation of
severe intra-uterine growth retardation,
oligohdroamnion, preterm labor, hypoxia-acidosis,
neurological disorders and death (sabaruddin dkk,
2015)
In pregnancy, there is an invasion of trophoblasts
into the muscle layer of the spiral arteries which
causes degeneration of the muscle layers so that
distention and vasodilation of the spiral arteries will
result in decreased blood pressure, decreased vascular
resistance and increased blood flow to the utero
placenta. As a result, blood flow to the fetus is quite
120
Ritonga, N., Anuhgera, D., Damayanti, ., Siregar, W., Sitorus, R. and Wulan, S.
Stress, Mean Arterial Pressure, and Roll over Tests as a Predictor of Pregnancy Hypertension.
DOI: 10.5220/0009467101200127
In Proceedings of the International Conference on Health Informatics and Medical Application Technology (ICHIMAT 2019), pages 120-127
ISBN: 978-989-758-460-2
Copyright
c
2020 by SCITEPRESS – Science and Technology Publications, Lda. All rights reserved

a lot and tissue perfusion also increases so as to ensure
proper growth of the fetus. This process is called
spiraling artery remodeling (Perry, H. et al, /2018)
In PE / E remodeling failure occurs which will
cause the spiral arteries to become stiff and hard so
that they do not experience distension and
vasodilation so that blood flow to the utero placenta
decreases and there is ischemia and placental
hypoxia. The impact of placental ischemia will cause
changes that can cause hypertension in pregnancy.
The mean diameter of the spiral arteries in normal
pregnancy is 500 microns while in preeclampsia 200
microns (Peres, G., et al, 2018)
High stress, anxiety or depression directly or
indirectly affect pregnancy and can cause
hypertension in pregnancy. Stress changes the
hypothalamus - pituitary-adrenal (HPA) caused an
increase in cortisol and associated cellular immune
changes (Vianna, P. et al, 2011)
Taslim’s research, et al (2016) explained that
stressed pregnant women will experience Grade 2
hypertension by 28.6% and there are no pregnant
women with stress respondent conditions in the
incidence of Grade 2 hypertension and no pregnant
women who experience stress have Grade 1
hypertension. Nasr et al (2016) also support the
previous findings, that there is a significant
correlation between depression and stress levels and
the level of education of women with hypertension in
pregnancy. These findings are in line with the theory
of anxiety / stress where stress can increase cortisol,
epinephrine & other steroids, so blood to the kidneys
decreases so renin production increases. Renin will
stimulate the formation of angiotensin I then turn into
angiotension II, then in turn stimulates aldosterone
secretion by the adrenal cortex. So that sodium and
water retention occurs in the kidney tubules, the intra-
vascular volume will increase, hypertension occurs.
Vianna et al (2011) in their medical hypothesis also
say the same thing that ongoing anxiety changes the
hypothalamus through the pituitary to govern adrenal
(HPA) secreting the hormone cortisol, the release of
this hormone causes a decrease in the sensitivity of
glucocorticoit dexamethasone (DEX) anxiety so that
cellular immunitybecomes changed so preeclampsia
occurs and can even have an effect until postpartum
(Vianna, P. et al, 2011)
Mean aerteril pressure (MAP) is the average
value of arterial pressure which is assessed by
measuring the pressure of diastole and systole and
then calculated using the MAP formula. MAP is said
to be positive if the result is> 90 mmHg and negative
if the result is <90 mmHg (Suprihatin, E. and
Norontoko, D. A, 2015)
Kenny et al (2014) in their research found a
method to predict the incidence of hypertension in
pregnant women using measurement of mean arterial
pressure (MAP), and the results showed that in
pregnant women with preeclampsia the MAP value
was higher compared to pregnant women with normal
tension (Kenny, L. C. et al, 2014)
Likewise with
Akoleker (2012) in his research explained that there
is a linear correlation between Mean Arterial Pressure
(MAP) with preeclampsia.
Taslim et al (2016) also
got the same research results where MAP was
significantly associated with hypertension in
pregnancy and abnormal MAP is 11.69 times the risk
of hypertension in pregnancy.
In general, pregnant mother will experience
physiological hematological change. Where there is a
profound effect between the mother's position on the
hemodynamic profile in the mother and fetus. In the
supine position the pressure from the inferior vena
cava (VCI) causes a decrease in venous return to the
heart and results in decreased stroke volume and
cardiac output. Turning from lateral to supine
position can result in a decrease in cardiac output by
25%, causing disruption of uteroplacental blood flow
(Sherwood, 2014). Disruption of uteroplacental flow
causes changes in the value of the hemodynamic
profile between mother and fetus as blood pressure
rises (Sherwood, L, 2014)
Roll Over Test (ROT in Figure 1 is a measurement
of blood pressure in two different positions, namely
in the left side sleeping position and the supine
sleeping position. ROT is said to be positive if there
is a change / increase in diastolic blood pressure
between the side and supine sleeping position ≥ 15
mmHg and negative when changes in diastole <15
mmHg (Suprihatin, E. and Norontoko, D. A, 2015)
Ghojazedeh et al (2013) in their research found a
new method using roll over test (ROT)
measurements, and the results showed that
significantly positive ROT values were higher in the
preeclampsia pregnant women group.
9
In accordance
with Walia’s findings et al (2015) where ROT values
of more than 15 mmHg in normal pregnant women
are 2.191 times more likely to develop preeclampsia
(Kaytri, S, 2016)
The high mortality and morbidity of mothers and
babies due to complications caused by hypertension
in pregnancy, was an indication of the importance of
finding a method that can be accurately to predict of
hypertension in pregnancy so that complications can
be prevented as early as possible. Until now, no
predictor has been found that matches the required
standard. Seeing the many studies on stress, MAP and
ROT associated with hypertension in pregnancy, but
Stress, Mean Arterial Pressure, and Roll over Tests as a Predictor of Pregnancy Hypertension
121

there have never been researchers who tried to
combine these three variables as predictors of
hypertension in pregnancy so it is important to
examine whether the combination of stress, MAP,
and ROT is able to be a predictor of hypertension in
pregnancy (Walia, M., D, A. S. and Gupta, G, 2015)
2 METHODS
This research was conducted at the Grandmed Lubuk
Pakam General Hospital. The Respondents in this
research were divided into 2 groups, namely the group
of normal tension pregnant women by 50 people and
hypertensive pregnant women by 50 people. The
sampling technique used accidental sampling where
patients who happened to come to do a pregnancy
examination at the time of the study at the study site
will be included in the study sample adjusted to the
inclusion and exclusion criteria.
This research is a hybrid type with a cross
sectional design and prospective cohort. Stress, MAP
and ROT assessments of normal pregnant mother with
tension and hypertension were measured at the same
time. MAP and ROT were measured 3 times, namely
27, 28 and 32 weeks gestational age in normal tension
and hypertensive mothers in pregnancy.
Instrument A is an instrument used to measure
anxiety of pregnant women using a standardized
questionnaire that is the Kessler Psychological Sitress
Scale (K10) by Kessler R. Professor of Health Care
Policy from Harvard Medical School Boston USA
which consists of 10 questions about anxiety and
depression symptoms experienced by a person in the
last 4 weeks of pregnancy to see a measure of stress.
Stress intensity is measured using ratio data.
Instrument B is a tension gauge which is a
spignomanometer to measure MAP and ROT. MAP
and ROT intensity was measured using millimeter
mercury (mmHg) ratio data.
MAP measurement work procedures is make sure
the pregnant mother is relaxed, backs leaned, feet
should be comfortable and step on the floor, Make
sure the sphygmomanometer number is visible, and
the examiner's position must also be comfortable,
Attach a cuff to the left arm of a pregnant mother with
a pipe parallel to the brachial artery. Ensure that the
pulse is in the brachial artery and start pumping until
the pulse is not palpable and mark the pressure
obtained. Put down the stethoscope bell above the
brachial artery. Turn the valve clockwise, until the
valve on the rubber pump is tightly closed. The cuff is
pumped to a pressure of 30 mmHg until the brachial
artery pulses are no longer palpated. Next slowly
rotate the rubber pumping balloon valve and listen for
systolic and diastolic pressure.
Record the results and calculate the MAP value
using the formula: MAP = [Pressure System + 2
(Diastole)]: 3ROT measurement work procedures.
Let the pregnant mother to get into bed and direct the
mother to sleep on her left side and relax for 15
minutes. Ensuring that sphygmomanometer numbers
are visible and the examiner's position must also be
comfortable. Attach a cuff to the left arm of a pregnant
woman with a pipe parallel to the brachial artery.
Ensure that the pulse is in the brachial artery and start
pumping until the pulse is not palpable and mark the
pressure obtained. Put down the stethoscope bell
above the brachial artery. Turn the valve clockwise,
until the valve on the rubber pump is tightly closed.
The cuff is pumped to a pressure of 30 mmHg until
the brachial artery pulses are no longer palpated. Next
slowly rotate the rubber pumping balloon valve and
listen for systolic and diastolic pressure.
Record the results of the left tilted blood pressure
measurement. Let pregnant women to change
sleeping position to the supine position and be relaxed
for 15 minutes. Ensure that the pulse is in the brachial
artery and start pumping until the pulse is not palpable
and mark the pressure obtained. Put down the
stethoscope bell above the brachial artery. Turn the
valve clockwise, until the valve on the rubber pump is
tightly closed. The cuff is pumped to a pressure of 30
mmHg until the brachial artery pulses are no longer
palpated. Next slowly rotate the rubber pumping
balloon valve and listen for systolic and diastolic
pressure. Invite and accompany the mother to get
down from the bed. Recording supine blood pressure
measurement results.. Calculate and record the
diastole blood pressure difference in the left tilt
position with supine position.
Data collection was carried out after obtaining
permission from the research location and the
Research Ethics Commission.
The researcher met with related parties at the
research location through the following procedure.
Determine the subject based on inclusion and
exclusion criteria. Introduce yourself and explain
research covering the objectives, rights and
obligations of the subject as well as the benefits of
research to the subject. Provide an informed consent
sheet to be signed by the subject, if the subject is
willing to participate in the study. Explained the
procedure of the series of checks to be carried out.
Measuring the blood pressure of the subject by using
the spigmomanometer 3 times, ie when in a sitting
position, sleep on your left side after that 15 minutes
later when the supine sleep position. Conduct direct
ICHIMAT 2019 - International Conference on Health Informatics and Medical Application Technology
122
interviews related to stress experienced by the subject.
Enter into a repeat examination meeting contract and
conduct MAP and ROT examinations at 28 and 32
weeks' gestation. Record all data on the observation
sheets. Data processing is carried out with the SPSS
(Statistical Product and Service) program through the
stages of editing, coding, data entry, data cleaning.
This analysis described the data in the form of a
categorical table. The data which have processed will
be presented in tabular and narrative form. The Data
that have been got by cross sectional and prospective
cohort used Chi-Square test analysis to see the
relationship of stress, MAP and ROT with pregnancy
hypertension. The strength of the data relationship
obtained by cross sectional is known based on the
calculation of the association size of the Odds Ratio
(OR) and the strength of the data relationship obtained
through the prospective cohort approach is known
based on the calculation of Relative Risk (RR). If OR
/ RR is equal to 1 it means that there is no relationship
between the independent variable and the dependent
variable. If OR / RR is more than 1, it means that there
is a relationship between the independent variable and
the dependent risk factor. If OR / RR is smaller than
1, it means that there is a relationship between the
independent variable and the dependent dependent
which is protective for the effect. In addition to the
OR / RR value, we also pay attention to the value of
the confidence interval (CI) and the p-value. If CI
accross number 1, the OR / RR value is not
significant.
3 RESULT AND DISCUSSIONS
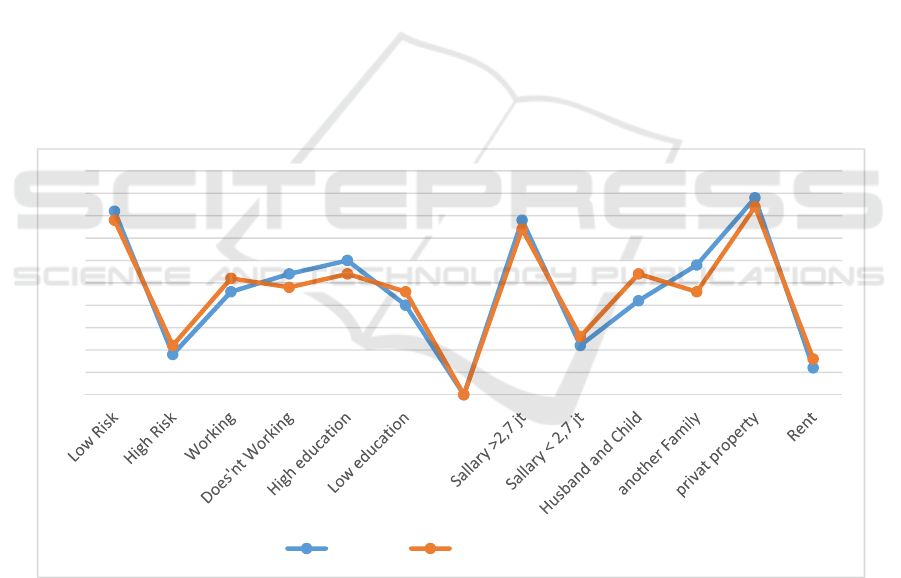
Figure 1 showed that based on work status, education,
age, household income, wife's salary, husband's
salary, household members, home ownership status,
history of abortion, parity of pregnancy plans and
pregnancy spacing there were no significant
differences between groups of normal pregnant
women with the hypertension group in pregnancy as
seen from the frequency distribution graph based on
the characteristics of the respondents. So it can be
concluded that the study sample was normally
distributed and was homogeneous.
Figure 1: Frequency distribution based on respondent Characteristics.
Table 1 showed a significant difference in the history
of preeclampsia and eclampsia with a value of p =
0.001; OR = 10,286; 95% CI 2,209-47,9. That is,
pregnant women who have a history of PE / E have a
tendency to experience hypertension at 27 weeks
gestation by 10 times compared to pregnant women
who have no history of PE / E.
0
5
10
15
20
25
30
35
40
45
50
Normal Pregancyhypertension
Stress, Mean Arterial Pressure, and Roll over Tests as a Predictor of Pregnancy Hypertension
123

Table 1: The relationship of obstetric history with hypertension at 27 weeks gestation.
Variable
Normal Hypertension
P
OR
(95% CI)
N (%) N (%)
PE History
Doesn’t exist 47 56,6 36 43,4
0,001
10,286
(2,209–47,901)
There’s
3
17,6 14 82,4
Abortion History
No 44 51,8 41 48,2
0,575
1,61
(0,527 – 4,920) There’s
6
40
9
60
Paritas
Primi 17 47,2 19 52,8
0,835
0,841
(0,371 – 1,904)
Multi 33 51,6 31 48,4
Planning of
pregnant
Yes 44 48,9 46 51,1
0,739
0,638
(0,168 – 2,413)
No
6
60
4
40
Pregnancy
Distance
≥ 24 Months 40 47,6 44 52,4
0,413
0,545
(0,182 – 1,637)
< 24 Months 10 62,5
6
37,5
Based on the analysis of the data, the researchers
concluded that although a history of abortion, parity,
pregnancy planning and pregnancy spacing does not
have an influence or relationship to the incidence of
hypertension in pregnancy, but if the pregnant woman
has a history of preeclampsia / eclampsia, it is likely
that the mother will fall into a condition of
hypertension in her pregnancy. Table 2 showed a
significant difference in the history of preeclampsia
and eclampsia with a value of p = 0.026; RR = 1,667;
95% CI 1,223-2,272. That is, pregnant women who
have a history of PE / E have a tendency to experience
hypertension at 32 weeks gestation by 2 times
compared to pregnant women who have no history of
PE / E.
Table 2. Analysis of the relationship of obstetric history with the incidence of hypertension at 32 weeks gestation.
Variabel
Normal Hypertension
P
OR
(95% CI)
N (%) N (%)
0,026
1,667
(1,223 – 2,272)
No History PE 42 50,6 41 49,4
Exist 3 17,6 14 82,4
History of
Abortion
No
34
43 45 57
0,604
0,836
(0,513 – 1,362)
Exist
11
52,4 10 47,6
Parity
Primi
17
47,2
19
52,8
0,900
1,066
(0,731 – 1,554)
Multi
28
43,8 36 56,3
Pregnancy plan
Yes 39 43,3 51 56,7
0,503
0,706
(0,323 – 1,54)
No 6 60 4 40
Pregnancy
Distance
≥ 24 Months 34 40,5 50 59,5
0,503
0,525
(0,249–1,109)
< 24Months 11 68,8 5 31,3
ICHIMAT 2019 - International Conference on Health Informatics and Medical Application Technology
124

Table 3 showed that minor stress has a statistically
significant relationship between the normal tension
group and the hypertension group at 27 weeks'
gestation. Pregnant women who got experience minor
stress have a tendency to experience hypertension by
4 times compared to pregnant women who are not
stressed. This is because psychological stress can
activate the hypothalamic-pituitary adrenal (HPA)
axis, which in turn will increase corticosteroid and
ketocolamin levels in the blood, this hormone will
suppress the production of the adrenal glands and
cause vasoconstriction of blood vessels. In this
analysis just normal and minor stress categories which
tested, because there were no samples that
experienced moderate or severe stress (scores above
25).
Table 3: Relationship between stress and the incidence of hypertension at 27 weeks gestation.
Category
Normal Tension Hypertension
P
OR
(95% CI)
N (%) N (%)
Normal
39
62,9 23 37,1
0,000
4,162
(1,744-9,935)
Minor Stress
11
28,9 27 71,1
Table 4 showed that mild stress has a statistically
significant relationship between the normal tension
group and the hypertension group at 32 weeks'
gestation. Pregnant women who got experience minor
stress have a tendency to experience hypertension at
32 weeks gestation by 2 times compared to pregnant
women who are not stressed.
Table 4: Relationship of Stress with the incidence of hypertension at 32 weeks gestation.
Category Normal Tension Hypertension P
OR
(95% CI)
N (%) N (%)
Normal 37
59,7
25 40,3 0,001
1,958
(1,387 – 2,763)
Minor Stress
8
21,1
30 78,9
Table 5 showed that mean arterial pressure
statistically has a significant relationship between the
normal tension group and the hypertension group at
27 weeks gestation.
Pregnant women with positive MAP have a
tendency to experience hypertension by 3 times
compared to pregnant women with negative MAP.
Similar with the research of Chan et al (2017) in his
study involving 12,915 women (326 of gestational
hypertension and 82 preeclampsia) found the results
that MAP trimester 1 and characteristics of pregnant
women were able to be predictors of gestational
hypertension and preeclampsia with a detection rate
of 76%.
Table 5: Relationship of MAP with the incidence of hypertension at 27 weeks gestation.
Category
Normal Tension Hypertension
P
OR
(95% CI)
N (%) N (%)
Negative
29
100
0
0
0,001
3,381
(2,361-4,841)
Positive
21
29,6 50 70,4
Table 6 showed that MAP as statistically has a
significant relationship between the normal tension
group and the hypertension group at 32 weeks'
gestation. Pregnant women with a positive at 27
weeks gestation with MAP and a positive at 28 weeks
gestation are more likely to have hypertension at 32
weeks gestation by 2 times and 3 times compared to
pregnant women with a negative at 27 weeks
gestation with MAP and a negative at 28 weeks
gestation with MAP. Pregnant women with MAP at
32 weeks of gestation are positive also have a
tendency to experience hypertension as much as
compared to pregnant women. Kuc et al (2013) also
found the results of a study that MAP is effective in
predicting preeclampsia in the early trimester of
pregnancy and resulting in a high rate of detection
(72%). Similar with the findings of Nokele et al
(2014) that MAP values were higher in preeclampsia
women than those who did not.
Stress, Mean Arterial Pressure, and Roll over Tests as a Predictor of Pregnancy Hypertension
125

Table 6: Relationship of MAP with the incident of hypertension at 32 weeks gestation.
Variabel Normal Tension Hypertension
P
OR
(95% CI)
N (%) N (%)
MAP 27 Week
0,004
2,088
(1,182 – 3,688)
Negative
20
69
9
31
Positive
25
35,2
46 64,8
MAP 28 week
Negative
16
76,2
5
23,8
0,003
2,658
(1,215 – 5,818)
Positive
29
36,7
50 63,3
MAP 32 week
Negative
14
100
0
0
0,001
0,360
(0,272– 0,478)
Positive
31
36
55 64
Table 7 showed that the roll over test statistically has
a significant relationship between the normal tension
group and the hypertension group at 27 weeks'
gestation. Pregnant women with positive ROT have
a tendency to experience hypertension in pregnancy
by 20 times compared to pregnant women with
negative ROT.
T
able 7: Relationship of ROT with the incident of hypertension at 27 weeks gestation.
Category
Normal Tension Hypertension
P
OR
(95% CI)
N (%) N (%)
Negative 47 68,1 22 31,9
0,001
19,939
(5,468-72,714)
Positive 3 9,7 28 90,3
Table 8 showed that the roll over test statistically has
a significant relationship between the normal tension
group and the hypertension group at 32 weeks'
gestation. Pregnant women with a positive ROT at 27
weeks gestation and a positive ROT at 28 weeks
gestation are at risk of having hypertension in
pregnancy by 2 times and 3 times compared to
pregnant women with a negative ROT at 27 and 28
weeks gestation. Seen from pregnant women who
have a positive ROT at 32 weeks gestational age tend
to experience hypertension 98 times compared to
pregnant women who have a negative ROT.
Table 8: Relationship of ROT with the incident of hypertension at 32 weeks gestation.
Variabel
Normal Tension Hypertension
P
OR
(95% CI)
N (%) N (%)
ROT 27 week
0,001
1,996
(1,453 – 2,740)
Negative 40 58 29 42
Positive 5 16,1 26 83,9
ROT 28 week
Negative 39 72,2 15 27,8
0,001
3,13
(2,007 – 4,882)
Positive 6 13 40 87
ROT 32 week
Negative 44 72,1
17
27,9
0,001
98,353
(12,498 – 773,965)
Positive
1
2,6
38
97,4
There is a profound effect between maternal
position on the hemodynamic profile in the mother
and fetus. In the supine position the pressure from
the Vena Cava Inferior (VCI) causes a decrease in
venous return to the heart and results in decreased
stroke volume and cardiac output. Turned around
from lateral to supine position can result in a
decrease in cardiac output by 25%, causing
disruption of uteroplacental blood flow (Sherwood,
2014)
ICHIMAT 2019 - International Conference on Health Informatics and Medical Application Technology
126

4 CONCLUSION
The results of the research concluded that stress, MAP
and ROT are associated with the incidence of
hypertension in pregnancy. Stress, MAP and ROT can
be used as predictors of pregnancy hypertension
(gestational ages 27 and 32 weeks).
ACKNOWLEDGEMENT
The researcher would like to thank all those who
helped during the research process and all the staff of
the Health Institute of Medistra Lubuk Pakam and
GrandMed Hospital.
REFERENCES
ACOG. 2017. Execise During Pregnancy. The American
College of Obtetricians and Gynecologists. pp. 3–5
Brown, C. M. and Garovic, V. D. 2011. Mechanisms And
Management Of Hypertension In Pregnant Women.
Current Hypertension Reports. 13(5). pp. 338–346. doi:
10.1007/s11906-011-0214-y
Ghojazadeh, M. et al. 2013. Prognostic Risk Factors For
Early Diagnosing Of Preeclampsia In Nulliparas.
Nigerian medical journal : journal of the Nigeria
Medical Association. 54(5). pp. 344–8. doi:
10.4103/0300-1652.122368
Kaytri, S. 2016. Role Of Uterine Artery Doppler And Roll
Over Test In Prediction Of Pregnancy Induced
Hypertension. International Journal of Reproduction,
Contraception, Obstetrics and Gynecology. 5(10). pp.
3556–3559
Kemenkes, R.I. 2016. Rencana Strategis Kementrian
Kesehatan Tahun 2015 - 2019. Kepmenkes No.
HK.02.02/MENKES/52/2015. 7(April). 1 doi: 351.077
Ind r
Kenny, L. C. et al. 2014. Early Pregnancy Prediction Of
Preeclampsia In Nulliparous Women, Combining
Clinical Risk And Biomarkers: The Screening for
Pregnancy Endpoints (SCOPE) International Cohort
Study. Hypertension. 64(3), pp. 644–652. doi:
10.1161/HYPERTENSIONAHA.114.03578
Kuc, S. et al. 2013. Maternal Characteristics, Mean Arterial
Pressure and Serum Markers in Early Prediction of
Preeclampsia. PLoS ONE. 8(5). pp. 1–8. doi:
10.1371/journal.pone.0063546
Li, X. et al. 2016. Association Between Serum Cortisol And
Chronic Kidney Disease In Patients With Essential
Hypertension. Kidney and Blood Pressure Research.
41(4). pp. 384–391. doi: 10.1159/000443435
Nasr, E. H. 2016. Psychological Consequences Of
Hypertensive Disorders Among Pregnant Women.
Scientific Research Journal (SCIRJ). IV(Ix). pp. 1–8
Nokele, L. A., et al. 2014. Anthropometric Characteristics
and Mean Arterial Pressure in Preeclamptic and
Normotensive Pregnant Women Visiting Antenatal
Clinics: A Case Study in South Africa’s Mthatha Area.
Mediterranean Journal of Social Sciences. 5(20). pp.
2075–2083. doi: 10.5901/mjss.2014.v5n20p2075
Peres, G., et al. 2018. Pre-Eclampsia and Eclampsia: An
Update on the Pharmacological Treatment Applied in
Portugal. Journal of Cardiovascular Development and
Disease. 5(1). p. 3. doi: 10.3390/jcdd5010003
Perry, H. et al. 2018. Home Blood-Pressure Monitoring In
A Hypertensive Pregnant Population. Ultrasound in
Obstetrics & Gynecology. (January). doi:
10.1002/uog.19023
Quan, L. M. et al. 2018. An Analysis Of The Risk Factors
Of Preeclampsia And Prediction Based On Combined
Biochemical Indexes. Kaohsiung Journal of Medical
Sciences. Published by Elsevier Taiwan LLC. 34(2). pp.
109–112. doi: 10.1016/j.kjms.2017.10.001
Reslan, O. M. and Khalil, R. A. 2010. Molecular And
Vascular Targets In The Pathogenesis And
Management Of The Hypertension Associated With
Preeclampsia. Cardiovascular & hematological agents
in medicinal chemistry. 8(4), pp. 204–26. doi:
10.2174/187152510792481234
Roberts, J. M. et al. 2012. ACOG Guidelines: Hypertension
In Pregnancy. American College of Obstetricians and
Gynecologists. doi: doi:
10.1097/01.AOG.0000437382.03963.88
Sabarudin, Dr. dkk. 2015. Penatalaksanaan Intensif
Obstetri. Jakarta : Sagung Seto
Sherwood, L. 2014. Fisiologi Manusia Dari Sel ke Sistem.
Edisi 8. Edited by B. U. Pendit et al. Jakarta: EGC
Suprihatin, E. and Norontoko, D. A. 2015. Prediction of
Preeclampsia by a Combination of Body Mass Index
(BMI), Mean Arterial Pressure (MAP), and Roll Over
Test (ROT). (November)
Vianna, P. et al. 2011. Distress Conditions During
Pregnancy May Lead To Pre-Eclampsia By Increasing
Cortisol Levels And Altering Lymphocyte Sensitivity
To Glucocorticoids. Medical Hypotheses. Elsevier Ltd.
77(2). pp. 188–191. doi: 10.1016/j.mehy.2011.04.007
Walia, M., D, A. S. and Gupta, G. 2015. Comparison
Between Roll-Over Test And Placental Localization
For Early Prediction Of Preeclampsia. International
Journal of Reproduction, Contraception Obstetrics and
Gynecology. 4(December). pp. 1710–1713
WHO, et al. 2015. Trends In Maternal Mortality: 1990 to
2015. Executive Summary. WHO Library Cataloguing.
p. 14. doi: 10
Zitouni, H. et al. 2018. Contribution Of Angiotensinogen
M235T And T174M Gene Variants And Haplotypes To
Preeclampsia And Its Severity In (North African)
Tunisians. Journal of the Renin- Angiotensin-
Aldosterone System. 19(1), p. 147032031775392. doi:
10.1177/1470320317753924
Stress, Mean Arterial Pressure, and Roll over Tests as a Predictor of Pregnancy Hypertension
127
