
Simulation of a Proportional-Integral-Derivative Control for
Continuous Bioreactor
Rudy Agustriyanto, Puguh Setyopratomo, Akbarningrum Fatmawati
Faculty of Engineering, The University of Surabaya, Jl. Raya Kalirungkut, Surabaya, Indonesia
Keywords: Bioprocess control, simulation, PID controller, bioreactor.
Abstract: In a continuous bioreactor, feed is added, and the product flow is removed at a constant rate. The objective is
to maintain the system at a steady state with high product formation. This can produce a very productive
process, with a low operating cost. However, there are operational challenges, especially on an industrial
scale, because they require tightly controlled conditions and strong monitoring methods. For long operation,
the system suffers a higher risk of contamination. This paper investigated the PID (Proportional integral
Derivative) control strategy of a continuous bioreactor. Several tuning methods of PID controller were used
for controller parameters determination (i.e., Direct Synthesis, Ziegler-Nichols (Z-N), and Tyreus-Luyben
(TLC)). The results of the closed-loop simulation for servo (setpoint tracking) problems are presented in this
paper for each method and compared. The results showed that the three method works well qualitatively.
However, the process model of the system needs to be modified by introducing 5 hrs time delay, which is
useful in obtaining cross over frequency and to make PID possible in the Direct Synthesis method.
1 INTRODUCTION
An important aspect of bioprocess control is to lay
down real-time operations that are stable, less
susceptible to various disturbances, close to certain
circumstances, or desired profiles compatible with an
optimal operating condition (Dochain, 2008).
Bioprocess control itself can be defined as providing
an environment that is close to optimal so that
microorganisms can grow to reproduce and produce
the desired product. This includes providing the right
concentration of nutrients (e.g., carbon, nitrogen,
oxygen, phosphorus, sulfur, minerals), eliminating
toxic metabolic products (e.g., CO2), and controlling
important parameters (e.g., pH, temperature).
The dynamics model for a bioreactor system has
been available (Riggs and Karim, 2006). Based on
this model, Agustriyanto (2015) obtained the first-
order transfer function in the Laplace domain, which
then successfully controlled by the Proportional
Integral (PI) controller (2016). Simulation results of a
closed-loop system with PI controller tuned by direct
synthesis method have been presented (Agustriyanto,
2016).
The objective of this paper is to investigate the
Proportional Integral Derivative (PID) control
strategy of the above continuous bioreactor.
In the next section (Method), the system being
studied (continuous bioreactor) will be explained
first, followed by its open-loop transfer function in
the Laplace domain. PID control of the bioreactor
system will also be discussed and followed by several
tuning methods (Direct Synthesis, Ziegler Nichol,
and Tyreus Luyben).
Section 3 (Results and Discussion) mainly
presenting controller parameters and their closed-
loop simulation results.
2 METHOD
2.1 Continuous Bioreactor
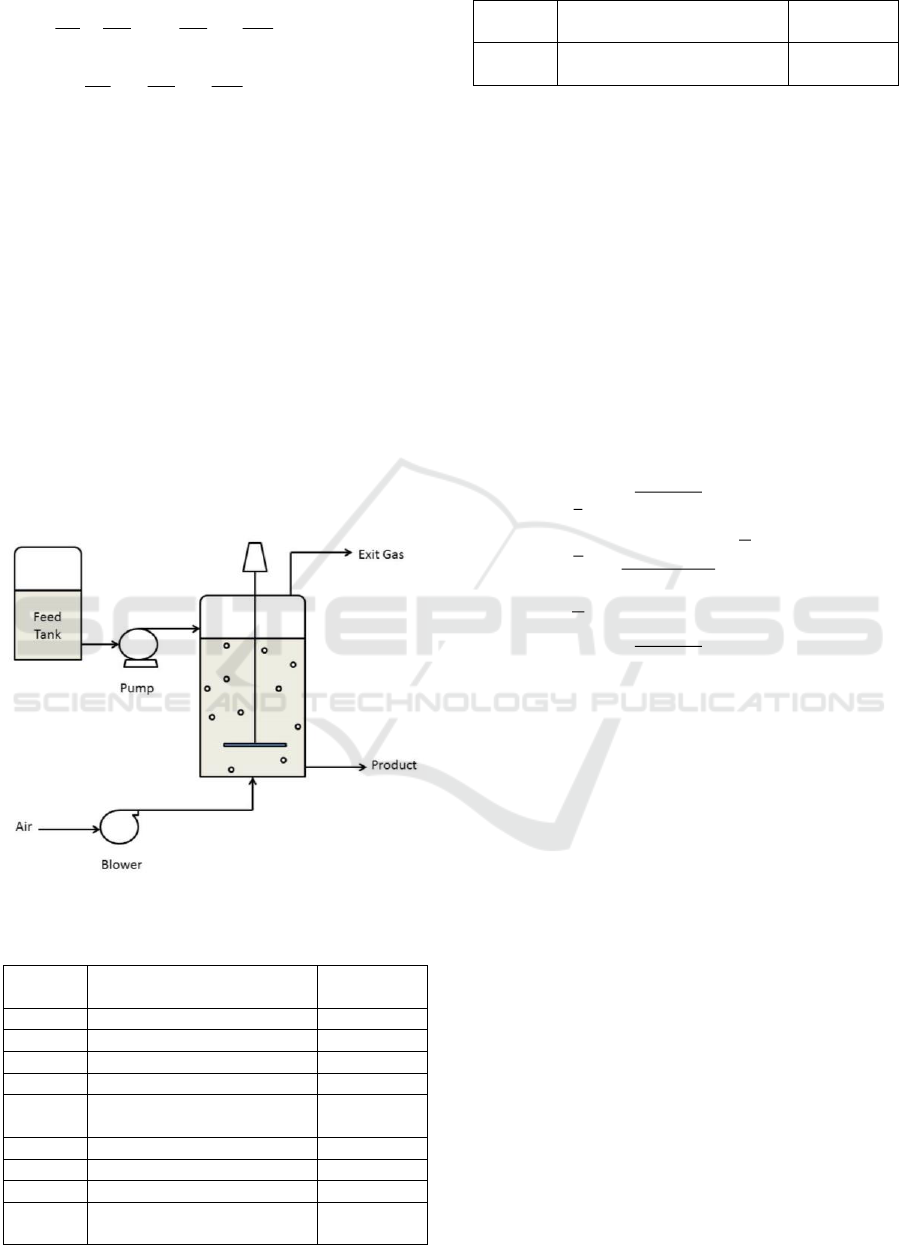
The continuous bioreactor being studied is presented
in Figure 1 (Riggs and Karim, 2006). The model
based on first principle (mass conservation) for this
system is presented as follows:
xx
V
F
dt
dx
V
max
+−=
(1)
Agustriyanto, R., Setyopratomo, P. and Fatmawati, A.
Simulation of a Proportional-Integral-Derivative Control for Continuous Bioreactor.
DOI: 10.5220/0009423201190123
In Proceedings of the 1st International Conference on Industrial Technology (ICONIT 2019), pages 119-123
ISBN: 978-989-758-434-3
Copyright
c
2020 by SCITEPRESS – Science and Technology Publications, Lda. All rights reserved
119
x
Y
S
V
F
S
V
F
dt
dS
xS
V
F
V
max
1
−−=
(2)
x
Y
P
V
F
dt
dP
xP
V
max
1
+−=
(3)
The cells consumed most of the substrate, and it
was assumed that the cell growth followed Monod
kinetics. The process variables and parameters for
this bioreactor model were given in Table 1.
The feed contains sugar as a substrate (S) from
grains (such as wheat, barley, corn, rice, etc.) and
nutritional salts to support cell growth (x). Cells (x)
consume substrate (S) and produce product (P) and
CO2. The air blower provides oxygen to cells. The
exit gas consists mainly of nitrogen from the air,
oxygen that is not consumed, and carbon dioxide
produced by cells from sugar consumption. Cell
concentration was measured with a turbidity meter,
and substrate concentration was measured by an
online HPLC analyzer. In industrial bio-processes,
filters are normally used for all inlet and outlet flow
to keep sterile conditions even though it is not shown
in Figure 1.
Figure 1. Continuous bioreactor system
Table 1: Process variables and parameters
Symbol
Variables & Parameters
Values &
Units
Fv
Feed rate
1 m3/h
Ks
Monod’s constant
0.1 g/L
P
Concentration of product
1.25 g/L
S
Concentration of substrate
25 g/L
SF
Substrate concentration in
the feed
50 g/L
t
Time
h
V
Bioreactor volume
5 m3
x
Concentration of cell
0.25 g/L
YxP
Yield factor
0.2 g-cells/
g-product
YxS
Yield coefficient
0.01 g-cells/
g-substrate
μmax
The maximum specific
growth rate
0.2/h
2.2 Process Transfer Function
First-order transfer function in Laplace domain for
this bioreactor system has been published before
(Agustriyanto, 2015) by solving the model equation
(i.e Equation (1) to (3)) subject to the steady-state
parameters and values are given in Table 1 using DEE
(Differential Equation Editor) in Matlab. The results
were re-identified using the System Identification
Toolbox. This method was previously explained in
Agustriyanto and Fatmawati (2013) and Agustriyanto
(2014). The results are as follows (where the mark bar
indicates that the variables are in the form of
deviation):
P
S
x
=
+
−
+
+
−
1100
025.0
1663.96
54813.0
1100
005.0
s
s
s
v
F
(4)
2.3 PID Control of Continuous
Bioreactor
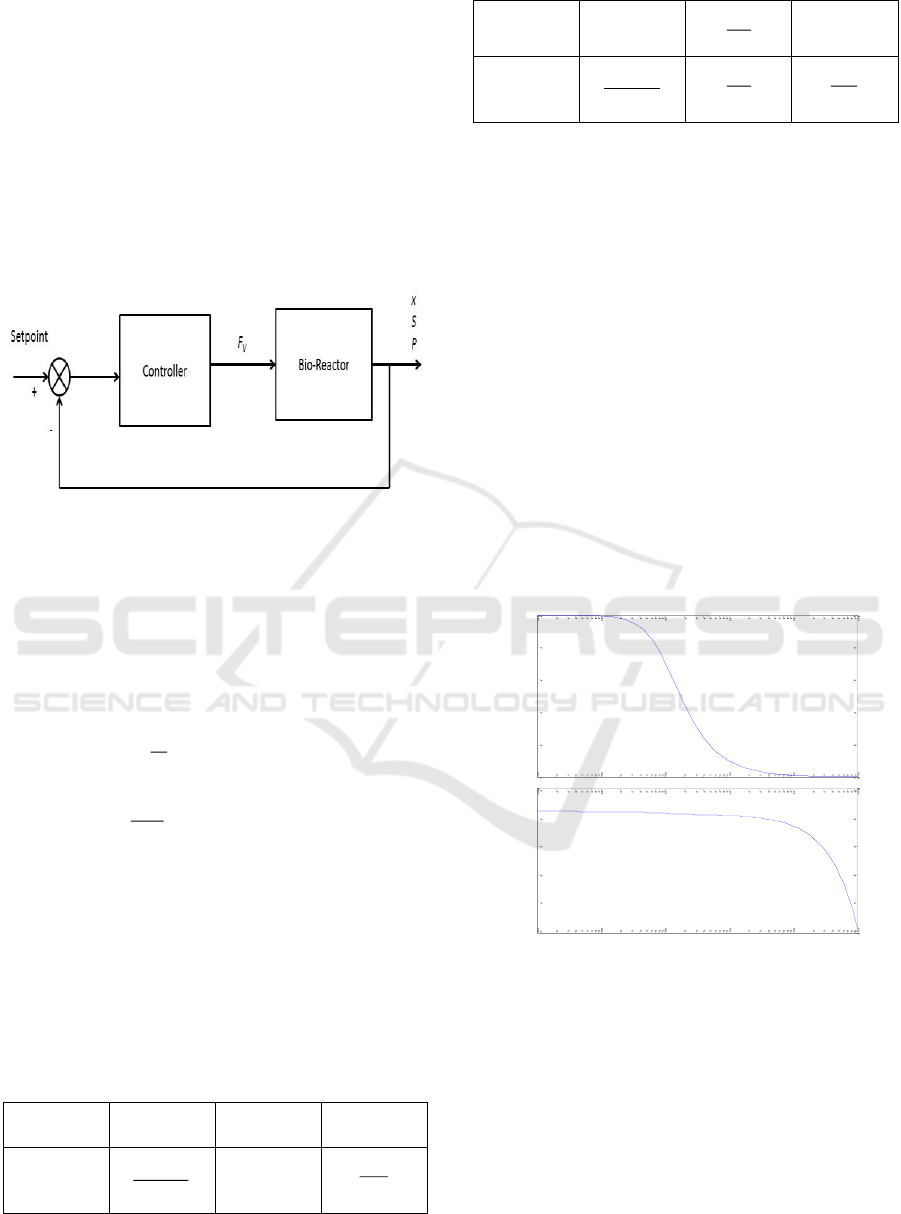
Product (P) was chosen as the variable being
controlled, and the flow rate to the reactor (FV) as the
manipulating variable. Figure 2 shows the closed-
loop system for the continuous bioreactor. It was
assumed that the transfer function for the
measurement equipment and control valve are one, so
they were ignored in the figure.
PID mode was chosen for the controller, and as
the system transfer function is first order, the Direct
Synthesis tuning method (Seborg, 2010) or Ziegler-
Nichol and Tyreus-Luyben method can be applied. It
was assumed that there were 5 hrs time delay, and it
was used for tuning purposes only.
The reason for using the Direct Synthesis is that
we can specify the desired closed-loop transfer
function, which is in this case: servo problem (Chen
and Seborg, 2002). While Ziegler Nichol is a classical
method that is still widely used due to its simplicity
(Zalm, 2004).The Tyreus Luyben procedure is quite
similar to the Ziegler Nichol, but the final controller
setting is different.
ICONIT 2019 - International Conference on Industrial Technology
120
2.4 Direct Synthesis (DS) Controller
Tuning
Direct synthesis for a first-order process will lead to
a PI controller (Agustriyanto, 2016); therefore, for
this system, another approach will be used. Here,
FOPTD (First Order Process with Time Delay) is
used since it will give PID. The derivation to obtain a
PID setting can be found elsewhere, and the resulting
PID is shown in Table 2. (http://inside.mines.edu/
~jjechura/ProcessDynamics/14_DirectSynthesis.pdf)
. It was also assumed that the value of λ = 5 hrs.
Figure 2. Close loop of the bioreactor system
2.5 Ziegler Nichols (Z-N) Controller
Tuning
To use the Ziegler-Nichols method, first, we need to
plot the Bode diagram (Coughanowr, 2009). Table 2
shows that controller parameters are the function of
Ku and Pu.
A
K
u
1
=
= ultimate gain
(5)
co
u
P
2
=
= ultimate period
(6)
=A
amplitude ratio at the cross over
frequency
(7)
=A
amplitude ratio at the cross over
frequency
(7)
Table 2: Controller tuning formula
Direct
Synthesis
Ziegler
Nichols
Tyreus
Luyben
c
K
p
p
K
+
u
K6.0
2.2
u
K
I
+
p
2
u
P
u
P2.2
D
+
p
p
8
u
P
3.6
u
P
2.6 Tyreus Luyben (TLC) Controller
Tuning
Similar to the Ziegler-Nichols method, Tyreus-
Luyben controller parameters are also the functions
of Ku and Pu
(http://pages.mtu.edu/~tbco/cm416/zn.html). These
functions are shown in Table 2.
3 RESULTS AND DISCUSSION
Figure 3 shows the Bode Plot for the system being
studied. It was found the value of cross-over
frequency = 0.944 with the amplitude of 0.000266 at
cross-over. Therefore, by using Eq.(5) and (6):
3759=
u
K
(8)
6599,6=
u
P
(9)
Figure 3. Bode plot
Table 3 shows controller parameter values, which
are calculated according to the formula shown in
Table 2.
The product concentration was successfully
controlled using PID controller (Figure 4). This figure
shows the performance of the PID controller tuned by
three different methods (Direct Synthesis (DS),
Ziegler-Nichols (Z-N), and Tyreus Luybean (TLC)).
Here, the setpoint for product concentration was
changed from initial (i.e., 1.25 g/L) to 1.2 g/L at t=100
Bode Diagram
Frequency (rad/s)
10
-4
10
-3
10
-2
10
-1
10
0
10
1
-2880
-2160
-1440
-720
0
720
Phase (deg)
0
0.005
0.01
0.015
0.02
0.025
Magnitude (abs)
Simulation of a Proportional-Integral-Derivative Control for Continuous Bioreactor
121
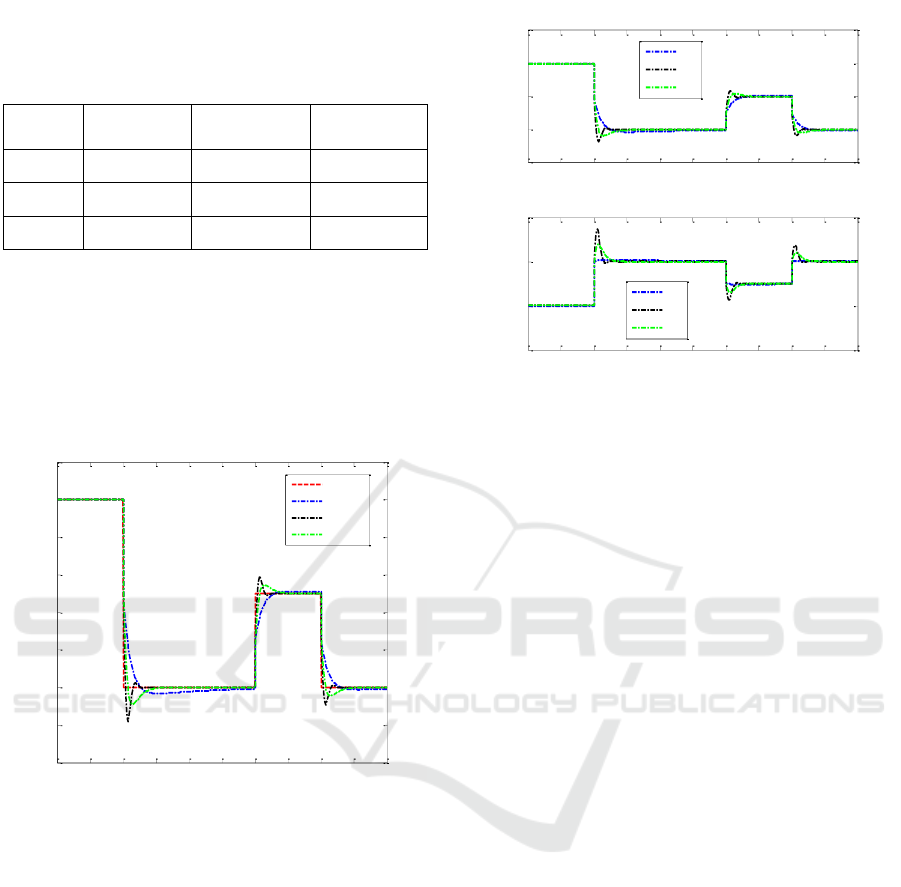
hr, followed by a step up and down at t=300 hr and
400 hr to the value of 1.225 g/L and back to 1.2 g/L
Table 3: Controller tuning
Direct
Synthesis
Ziegler
Nichols
Tyreus
Luyben
c
K
-840
-2255.4
-1708.6
I
105
3.33
14.6518
D
4.7619
0.8325
1.0571
From simulation results shown in Figure 4, it can
be concluded that the Ziegler-Nichols (Z-N) method
of tuning will give the highest overshoot for step
changes in setpoint, followed by Tyreus Luyben
(TLC) and Direct Synthesis (DS). Therefore, Ziegler-
Nichols also fast in reaching its new steady-state
value as expected by the set point.
Figure 4. The plot of Product Concentration (P) vs. Time
for PID Controller
Figure 5 shows the performance of uncontrolled
variables (i.e., x and S) vs. time. When the product set
point reduced to 1.2 g/L at t=100 hr, it can be seen
that cell concentration also reduced while the
substrate was increased. This is caused by different
signs in-process model gain for cell and substrate, as
indicated in Eq.(4).
Comparing to other published research (Husain et
al., 2014), these results agree that Tyreus Luyben
gave lower overshoot than Ziegler Nichols. While for
Direct Synthesis, we specify the output as desired
(i.e., no overshoot).
Figure 5. The plot of Cell and Substrate Concentration for
PID Controller
4 CONCLUSIONS
Simulation of a PID control strategy for a continuous
bioreactor system has been performed. Three
different tuning methods have been applied and work
well.
In implementing the method, the process model of
the system needs to be modified by introducing a 5
hrs time delay. This time delay should be small
enough compared to its time constant. Here we
choose about 5% of the time constant. This will help
in obtaining cross over frequency in Bode plot, as for
the first-order process without time delay will result
of none. This time delay also useful in obtaining the
PID parameter in the Direct Synthesis method as the
original process model will lead to the PI (not PID)
controller.
REFERENCES
Dochain, D. (2008). Bioprocess Control, John Wiley and
Sons, Inc.
Riggs, J.B., Karim, M.N. (2006). Chemical and Bioprocess
Control, Pearson Prentice Hall.
Agustriyanto, R. (2015). Simulation of Continuous Bio-
Reactor. In Proceedings of the Eight International
Conference of Chemical Engineering on Science and
Applications (ChESA), Banda Aceh, Indonesia.
Agustriyanto, R., Fatmawati, A. (2013). Bioprocess System
Identification of Continuous Fermentation, In
Proceedings of the 2nd International Conference of the
Indonesian Chemical Society, Yogyakarta, Indonesia
0 50 100 150 200 250 300 350 400 450 500
1.18
1.19
1.2
1.21
1.22
1.23
1.24
1.25
1.26
Time, [hrs]
Product Concentration, P, [g/L]
Set point
DS
Z-N
TLC
0 50 100 150 200 250 300 350 400 450 500
0.235
0.24
0.245
0.25
0.255
Time, [hrs]
Cell Concentration, x, [g/L]
DS
Z-N
TLC
0 50 100 150 200 250 300 350 400 450 500
24
25
26
27
Time [hrs]
Substrate Concentration, S, [g/L]
DS
Z-N
TLC
ICONIT 2019 - International Conference on Industrial Technology
122

Agustriyanto, R. (2014). Model Identification of
Continuous Fermentation under Noisy Measurements,
In Proceedings of the 3rd International Conference on
Computation for Science and Technology (ICCST-3),
Denpasar, Bali.
Agustriyanto, R. (2016). PI Control of a Continuous Bio-
reactor, In Proceedings of the 6th Annual International
Conference (AIC) of Syiah Kuala University, Banda
Aceh, Indonesia.
Seborg, D.E., Mellichamp, D.A., Edgar, T.F. (2010).
Process Dynamics and Control, John Wiley and Sons,
Inc.
Chen, D., Seborg, D.E. (2002). PI/PID Controller Design
Based on Direct Synthesis and Disturbance Rejection.
Ind. Eng. Chem. Res., 41, 4807-4822.
Zalm, G.M. (2004). Tuning of PI/PID Controllers:
Literature Overview.
https://pdfs.semanticscholar.org/b1a8/a78f2e8b0f64b2953
8b83e2859d8b6365b43.pdf
http://inside.mines.edu/~jjechura/ProcessDynamics/14_Di
rectSynthesis.pdf
Coughanowr, D.R., LeBlanc, S.E. (2009). Process Systems
Analysis and Control, McGraw-Hill’s.
http://pages.mtu.edu/~tbco/cm416/zn.html.
Hussain, K.M., Zepherin, R.A.R., Kumar, M.S. (2014).
Comparison of Tuning Methods of PID Controllers for
FOPTD System. International Journal of Innovative
Research in Electrical, Electronics, Instumentation and
Control Engineering, 2/3.
Simulation of a Proportional-Integral-Derivative Control for Continuous Bioreactor
123
