
Structural and Behavioral Validity using a System Dynamic
Simulation Approach: The Indonesian National Health Insurance
System Problem
Diva Kurnianingtyas, Budi Santosa and Nurhadi Siswanto
Institut Teknologi Sepuluh Nopember
Keywords: structural Validity, behavior Validity, Indonesia, Health insurance, System dynamics
Abstract: The dynamic system simulation model (SD) is increasingly favored by researchers in analyzing problems to
find policy solutions, particularly in the health sector. The advantage of this approach is that it can predict
the system in the long term at the macro level by looking at the interrelationship of behavior between
subsystems in the observed system. The purpose of this study is to provide an overview of structural and
behavioral validation testing in order to build reliability in the model being built. In this paper, the model
developed is the Indonesian National Health Insurance System Problem (INHIS). Here we use structural
validation test boundary adequacy and structure verification. Meanwhile, testing the validation of behavior
used an average comparison of actual data and data from simulation results. The results obtained are the
variables in the INHIS model and are declared valid and accurate because the value of the error ratio
obtained (E) <0.1. The importance of conducting validation has been proven in this study, which produces a
valid INHIS model. This causes an increase in the reliability and attractiveness of the INHIS model.
1 INTRODUCTION
System Dynamic simulation (SD) models have been
developed and implemented for policy and
operational issues in the health sector. For example,
researchers (Brailsfor, 2001; Mehrjerdi, 2012;
Faezipour, 2013; Rust, 2013) assign the value of a
model built into a precondition for the model to have
a high level of reliability. The assessment model for
each problem has a difference in terms of needs and
evaluation criteria in the validation process. Gass
(1983) explains that a model that has credible results
is one reason that can help to make a decision about
whether the simulation model can be applied in
practice.
The dynamic system model (SD) is an approach
used to analyze policies and explore various possible
improvement scenarios (Oliva, 2003; Sterman,
1984). Many researchers have found solutions to
various problems, especially health policy, using the
SD approach. For example, SD can analyze how
undesired effects can cause increased waiting lists to
obtain health services. Brailsford (2001) discovered
the interrelationship of the habits of insurance
participants who greatly influenced the costs borne
by the insurance management (Mehrjerdi, 2012),
analyzed the variables that affected patient
satisfaction in health care (Faezipour, 2013), and
described the interrelationships of each clinic that
has sole responsibility for service capacity (Rust,
2013).
However, the use of the SD approach in setting
health policy is very limited. Therefore, the purpose
of this study is to explore how to conduct structural
validation and behavioral validation tests that will
help increase the level of reliability of the SD model
that has been built.
Performing validation will build a belief that the
model built is in accordance with the real system.
Next, the other aim is to provide a detailed
description of how to validate the structure and
behavior presented in the application of the INHIS
case. The results of the illustrations given in this
study are expected to provide knowledge of the
validity test. Although this test has been done a lot,
in the health policy model, especially the INHIS, no
one has done it yet.
The rest of this paper is as follows: Section 2
explains the basic theory of dynamic systems and
validation. Then, Section 3 shows an illustration of
36
Kurnianingtyas, D., Santosa, B. and Siswanto, N.
Structural and Behavioral Validity using a System Dynamic Simulation Approach: The Indonesian National Health Insurance System Problem.
DOI: 10.5220/0009404300360045
In Proceedings of the 1st International Conference on Industrial Technology (ICONIT 2019), pages 36-45
ISBN: 978-989-758-434-3
Copyright
c
2020 by SCITEPRESS – Science and Technology Publications, Lda. All rights reserved

the validation process on the problem. Furthermore,
Section 4 presents a conclusion of the paper.
2 SYSTEM DYNAMICS
SD is usually used to estimate or predict long-term
systems at the macro level. The SD model is not
used to optimize or predict points but is used to
understand, recognize, and study how structure,
delay, and policy in taking actions and decisions that
can affect the system.
There are several researchers who have found
solutions by modeling SD for various problems, one
of which is health policy. However, the main
problem when building the SD policy model occurs
in the validation process.
Validation is the process of proving whether the
applied model has a satisfactory level of accuracy
that is consistent with testing the model (Sargent,
2013). At this stage, researchers are encouraged to
decide whether the model is in accordance with its
objectives. That is, the model has imitated the real
system well enough so that the model built can be
accepted according to its objectives (Barlas, 1989;
Barlas and Carpenter, 1990; Goodall, 1972). In
addition, researchers must determine how accurately
and reliably the model matches the real system
(Barlas, 1989; Curry et al., 1989). However, all of
that must see the process of modeling SD that has
been built by examining the flow of thought in SD.
This is called verification. Verification is for
ascertaining whether the model built with the help of
computer software runs smoothly and correctly
(Sargent, 2013). The verification phase is a subunit
of the structure validation test. This stage is done
before validating the behavior.
The ability of the SD model lies in linking
observable patterns of system behavior to find
suitable policy solutions. The SD model is usually
called the causal model (Barlas, 1989). Therefore,
the most important step is verification and validation
because it can influence the goodness of the model.
2.1 Stages of Structural Validity
Problem formulation is the first step in all modeling.
Simulation models have the ability to accurately
identify causal relationships in real systems (Law
and Kelton, 2000; Pidd, 2010). In constructing a
credible conceptual model, prerequisites are required
for validation. If the causal relationship on the
conceptual model does not correspond to reality,
then the simulation model will produce misleading
recommendations (Barlas, 1989; Barlas, 1990;
Quadrat-Ullah and BaekSeo, 2010).
There are several types of structure validation
tests on SD (Forrester and Senge, 1980):
(i) boundary adequacy,
(ii) structure verification,
(iii) verification parameters,
(iv) dimensional consistency, and
(v) extreme conditions.
Boundary adequacy tests on concepts and
structures to overcome policy problems that are
endogenous to the model. Structure verification to
test the consistency and relevance of the model
structure based on system knowledge. Then the
verification parameter is used to detect consistency
and relevance to the parameters in the model.
Dimensional consistency is used to test the
compatibility between the real system and the model
built. Then, extreme conditions are used to detect
whether the model has logical behavior when the
selected parameter is inputted with extreme value.
The structure validation test does not have to be the
whole type of test, but this test must be carried out
because it is one of the important stages that should
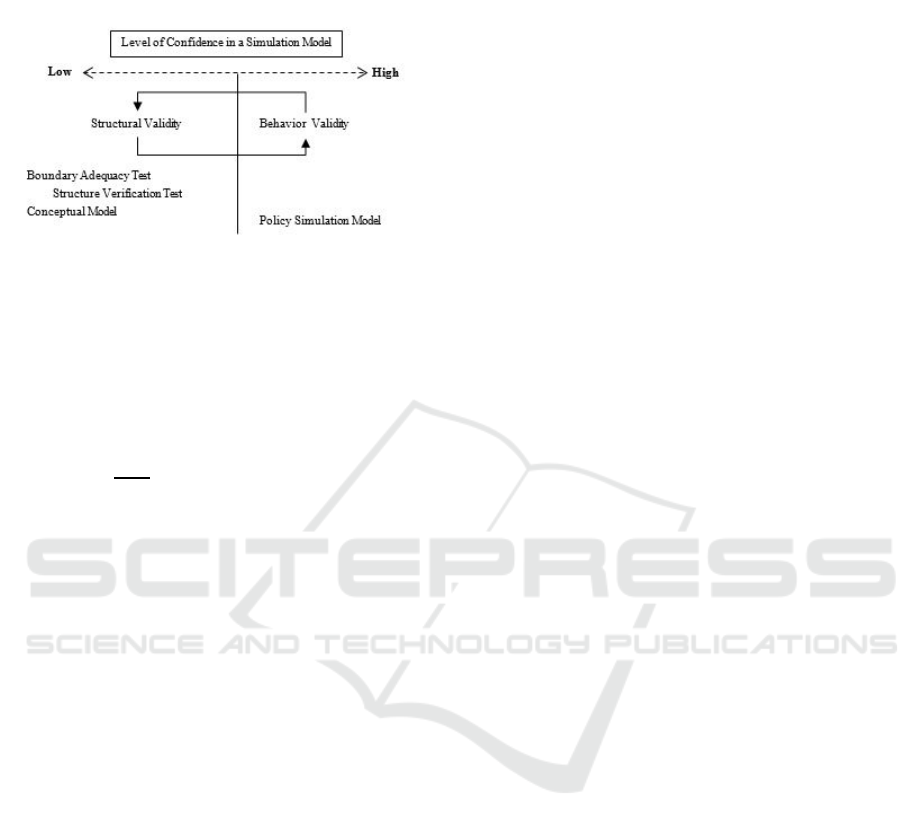
not be missed. The stage of structural validation is
shown in Figure 1 (Quadrat-Ullah and BaekSeo,
2010). The process starts from the stage of
developing the model concept in a policy problem,
and this stage must ensure the specific problem of
data, boundaries, and structure validation. In this
study, applying three structural validation tests,
boundary adequacy, and structure verification, the
structure validation test is used to improve the
structure of the model that has been built. At this
stage, the level of confidence also increases from
low to high.
2.2 Stages of Behavior Validity
BehaviorValidity tests examine how well the
solution is obtained from the comparison of
simulation models and real systems. This is done by
comparing the simulation data from the model and
the actual data (Barlas, 1989; Zebda, 2002). There
are several suggestions for a series of behavioral
validation tests on a dynamic system model (SD),
namely (i) trend comparison and removal, (ii)
autocorrelation function test for period comparison,
(iii) cross-correlation function test for phase lag
detection, (iv) comparison the means, and (v)
comparing the amplitude variations. Trend
comparison and removal tests are used to check data
compatibility by estimating trends from both
models. Then, the autocorrelation function test for
Structural and Behavioral Validity using a System Dynamic Simulation Approach: The Indonesian National Health Insurance System
Problem
37
period comparison is used to check for significant
errors in a period.
Figure 1: Structural Validation Stages
Next, the cross-correlation function test for phase
lag detection tests to show patterns of behavior at
different time intervals. Then, comparing the means
is used to detect the difference in average errors
shown in Equation 1 below.
|
|
(1)
Where E is the error variance between the actual
data A and the simulation data, S. Next, there is a
comparison of the amplitude variations test to get
the comparison value of the simulation results
variation. The behavior validation test does not have
to be done on all types of tests, but this test must be
done because it is one of the important steps that
should not be missed.
3 MODEL VALIDATION: AN
EXAMPLE
3.1 Problem
In the framework of Universal Health Coverage
(UHC), the government launched the INHIS
program called the National Health Insurance (JKN)
to provide public health insurance in Indonesia. This
program is required for all residents written in Law
Number 40 of 2004.
INHIS was organized to provide health insurance
in the form of a health care package. Participation in
INHIS includes Dues Assistance Recipients
participants (PBI), Individual participants, Paid
Workers participants-government employees (PPU-
PN), and Paid Workers participants-company
employees (PPU-BU). In addition, there is a health
insurance mechanism that is different from before,
as, in the previous program, a tiered referral system
was not implemented.
A tiered referral system is a system that regulates
the transfer of responsibilities in health efforts both
vertically and horizontally in more professional
health facilities in stages, except in emergency
situations. The system starts with the patient wanting
to obtain health services at a primary health facility
(FKTP). There are five types of FKTP at INHIS,
namely General Practitioner (GP), Community
Health Centre (CHC), Inpatient Community Health
Center (ICHC), Pratama Clinic (PC), and Type D
Primary Hospital (RSD). However, only GP and
CHC do not have room for inpatient services.
Conducting a disease diagnosis in a patient is the
initial stage carried out at FKTP. Patients who have
been examined have three possibilities, among
others, undergoing outpatient treatment with
medication as directed by the doctor, undergoing
inpatient care at FKTP who has an inpatient room,
and patients can be referred for more detailed
examinations at advanced health facilities (FKRTL)
because of facilities or inadequate capacity. FKRTL
has several types of health facilities, including
Primary Clinic (PClinic), Hospital Type D (HD),
Hospital Type C (HC), Hospital Type B (HB), and
Hospital Type A (HA).
3.2 Model
The purpose of building the SD model in this study
was to determine the impact of the patient's tiered
referral mechanism on INHIS because of the
importance of the definition of sustainability in the
INHIS program. That is, the sustainability of INHIS
requires an equilibrium approach due to increasing
demand and limited resources. INHIS is a
government program, such as in Indonesia, that can
achieve Universal Health Coverage (UHC) (Report,
2010). The SD model at INHIS consists of 12
sectors, including:
1. The Community Health Centre (CHC) Sector:
The CHC sector is the first level health facility
sector that does not provide inpatient care, so
patients who need to be admitted will be referred to
the first level health facility. This sector illustrates
the flow starting from requesting health services,
and then the patient is examined by a doctor
regarding symptoms of the disease that has been
experienced. Next, the doctor gives the decision to
the patient about whether they will be an outpatient
or inpatient or should be referred to Hospital Type D
(HD) or a Primary Clinic (PClinic). If the result of
ICONIT 2019 - International Conference on Industrial Technology
38

the decision is that the patient is referred, then the
doctor will provide a referral letter of which a health
facility is being addressed.
2. General Practitioner (GP) Sector: The GP
Sector has the same mechanism as the Community
Health Centre (CHC) sector. However, the data is
entered differently so as to obtain a different output
value with the CHC sector.
3. Pratama Clinic (PC) Sector: The PC sector is
the first level health facility sector that has inpatient
care. The flow of patients on the PC starts from
asking for health services, and then the patient is
examined by a doctor related to the symptoms of the
disease that has been experienced. Next, the doctor
gives the decision to the patient about whether the
patient will be an outpatient or inpatient, or should
be referred to Hospital Type D (HD) or Primary
Clinic (PClinic). If the result of the decision is that
the patient is referred, then the doctor will provide a
referral letter in which the health facility should be
addressed. Then, if the patient is required to undergo
inpatient services, the patient must register for
inpatient services. If the patient has undergone
inpatient services but has not recovered, then the
patient must be referred to as HD or PClinic. The
process of referral of patients in obtaining inpatient
services at advanced health facilities is the same as
before, to obtain more complete services.
4. Inpatient Community Health Center (ICHC)
Sector: The ICHC Sector has the same mechanism
as the Pratama Clinic (PC) sector. However, the data
entered in each variable is different so that it gets
different outputs.
5. Hospital Type D Pratama (HDP) Sector: The
HDP sector also has the same mechanism as the PC
sector and ICHC. The difference is in the different
variable input data so that the results obtained are
different.
6. Hospital Type D (HD) Sector: The HD sector
is an advanced health care sector that only has
general practitioners, general dentists, and basic
specialists. In the HD sector, patients register to
receive health services, and then the patient is
examined by a doctor regarding the symptoms
experienced. Then, the doctor gives a decision to the
patient about whether the patient will be outpatient
or inpatient or should be referred to Hospital Type C
(HC). If the patient is referred, the doctor will
provide a referral letter about which health facility to
attend. Furthermore, if the patient must undergo
inpatient services, the patient must register for
inpatient services. If the patient has already been
hospitalized but has not recovered, then the patient
must be referred to as HC. In this sector, there is a
process of calculating claim costs consisting of two
types, namely the cost of claims from a medical
check-up (MCU) and the cost of claims from
hospitalization. This calculation will affect the
amount of burden that must be borne by INHIS.
7. Primary Clinic Sector (PClinic): The PClinic
sector has the same mechanism as the Hospital Type
C (HC) sector. However, the data entered on each
variable has a difference. Therefore, the output
obtained is different.
8. Hospital Type C (HC) Sector: The HC sector
is an advanced health facilities sector that has
general practitioners, general dentists, basic
specialists, supporting specialists, and oral dentists.
In this sector, after patients receive services, doctors
will provide further decisions. The decision, among
others, is that patients are allowed to be an
outpatient, patients are required to be hospitalized,
or patients will be referred to HB. Furthermore, the
process of inpatient and referral services is the same
as that of the HD and PClinic sectors. The
calculation of claim costs in the HC sector is also the
same as in the HD and PClinic sectors.
9. Hospital Type B (HB) Sector: The HB sector
is an advanced health care sector that has general
practitioners, general dentists, basic specialists,
supporting specialists, oral dentists, and
subspecialists. In this sector, the flow of patients
starts from registering health services, and then the
patient is examined by a doctor related to the
symptoms of the disease that has been experienced.
Next, the doctor gives the decision to the patient
about whether the patient will be an outpatient or
inpatient or should be referred to as Type A Hospital
(HA). Then, the patient process for receiving
inpatient and referral services is the same as the HD
and PClinic sectors. The calculation of claim costs in
the HB sector is the same as HD and PClinic and HC
sectors.
10. Hospital Type A (HA) Sector: The HA sector
is an advanced health care sector that has general
practitioners, general dentists, basic specialists,
supporting specialists, oral dentists, and
subspecialists. In this sector, the flow of patients
begins to be examined by doctors regarding
symptoms of the disease that have been experienced.
Next, the doctor gives the decision to the patient
about whether the patient will be an outpatient or
inpatient. Then, the process for obtaining inpatient
services at HA is the same as in the PClinic, HD,
HC, and HB. In the HA sector, patients are no longer
referred, so HA will try their best to provide healing.
In addition, the calculation of claims costs in the HA
Structural and Behavioral Validity using a System Dynamic Simulation Approach: The Indonesian National Health Insurance System
Problem
39
sector is the same as in the PClinic, HD, HC, and
HB sectors.
11. Premium Incomes Sector: The premium
income sector is a sector to calculate the total
income derived from the number of participants who
took INHIS multiplied by the premium amount of
participants at each service level chosen by
participants. This sector has an influence on INHIS's
financial budget.
12. Financial Budget Sector: The financial
budget sector is a sector for calculating the total
inventory of funds held by INHIS.
3.3 Structural Validity Based Problem
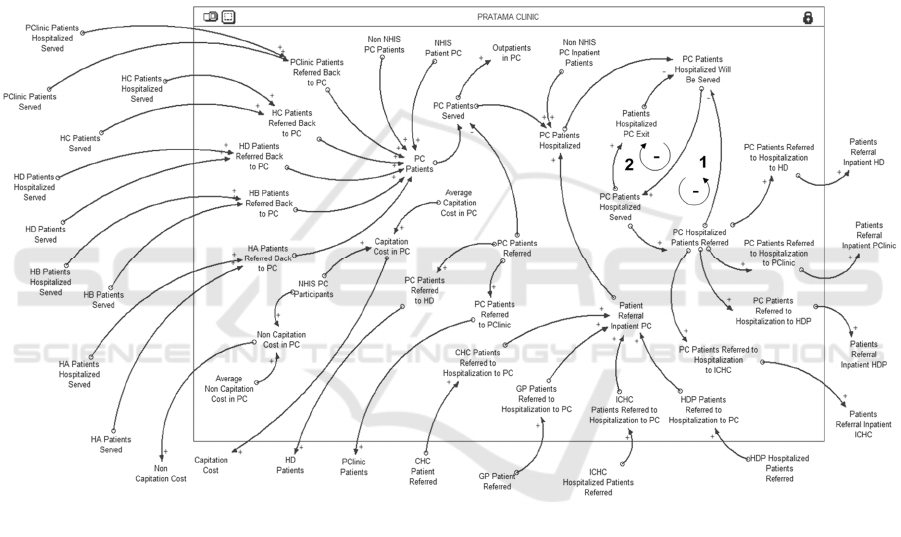
In the conceptual model, a structural verification test
will be carried out to determine whether there is an
error in the model. The model will be compared with
actual knowledge according to the real system. For
example, the interrelationships of variables in the
INHIS model are represented in the Causal Loop
Diagram (CLD) regarding the "Pratama Clinic,"
"Hospital Type D" and "Financial Budget" sectors
presented by Figures 2, 3, and 4.
Figure 2: Causal Loop Diagram for Pratama Clinic
ICONIT 2019 - International Conference on Industrial Technology
40

Figure 3: Causal Loop Diagram for Hospital Type D
Figure 4: Causal Loop Diagram for Financial Budget
Structural and Behavioral Validity using a System Dynamic Simulation Approach: The Indonesian National Health Insurance System
Problem
41

3.3.1 Boundary Adequacy
A summary of endogenous and exogenous variables
in INHIS is shown in Figure. 5. Exogenous variables
in INHIS include population growth rate. Then, the
endogenous variable is fund inventory, INHIS
premium, INHIS cost, and patient satisfaction level
Figure 5: Summary of INHIS boundary
3.3.2 Structure Verification
Structural verification is a verification that is very
important in the whole validation process. Based on
Figure 2, there are two causal loops. The first loop is
negative because an increase in the number of
inpatients treated at Pratama Clinic (PC) has resulted
in a reduction in the number of inpatients on PC.
Furthermore, the number of inpatients on a PC
decreases, causing a decrease in the number of
inpatients on a referred PC. Then, the second loop is
also negative because an increase in the number of
inpatients on PC goes away, resulting in a reduction
in the number of inpatients on PC. This will have an
impact on reducing the number of inpatients in the
PC that are served. Then, a decrease in the number
of inpatients on PC resulted in a decrease in the
number of inpatients on PC who left.
Furthermore, there are two causal loops shown in
Figure 3. The first loop is negative because if the
number of inpatients referred to HC increases, it will
cause the number of inpatients in HC to decrease.
Then, a decrease in the number of inpatients in HC
who were served caused the number of inpatients in
HC to be referred. Then, the second loop is also
negative because if the number of inpatients in HC
who attends increases, then it has an impact on
reducing the number of inpatients in HC.
Furthermore, the number of inpatients served in HC
has decreased, which has an impact on the decline in
the number of inpatients in HC who have left.
The financial budget sector has five cause and
effect loops shown in Figure 4. The first loop is
negative because of the causal relationship because
of an increase in the burden that must be paid results
in a decrease in the supply of funds. This results in
an increase in the number of premium participants.
An increase in the number of premiums causes the
number of Dues Assistance Recipients participants
(PBI), and non-PBI participants decreased. The
decline in the total number of PBI participants and
non-PBI participants resulted in the number of
INHIS participants to also decrease. This results in a
decrease in the number of claim costs.
A decrease in the number of claim costs,
capitation costs, and non-capitation costs affected
the decrease in the number of costs to be paid. All
costs are borne by INHIS. The second loop is
negative because the causal relationship of the total
stock of funds has decreased, resulting in an increase
in the number of premium participants. This resulted
in the amount of premium income obtained also
increasing.
Then, an increase in the amount of premium
income earned results in the amount of income
earned also increasing. After that, the income gained
increases in the number of funds available. Then, the
third loop is positive because the causal relationship
of the amount of the stock of funds decreases,
resulting in an increase in the number of premium
participants. Furthermore, an increase in the amount
of premium resulted in PBI participants and non-PBI
participants declining. This decrease in the number
of PBI participants and non-PBI participants resulted
in the number of INHIS participants also decreasing.
After that, the decreased number of participants
results in a decrease in the amount of premium
income earned. Then, a decrease in the amount of
premium income earned results in the amount of
income earned also decreasing. After that, the
income derived a decreased effect on the decrease in
the number of funds.
Thus, the structural relationship between the
causal feedback loops applied in the INHIS model is
based on problem data. The data is obtained from
knowledge of the existing system.
E
N
D
O
G
E
N
O
U
S
E
X
S
O
G
E
N
O
U
S
Fund
Inventory
INHIS
Premium
INHIS
Cost
Patient
Satisfaction Level
Population
Growth Rate
ICONIT 2019 - International Conference on Industrial Technology
42
0.00
20.00
40.00
60.00
80.00
100.00
120.00
140.00
160.00
2016 2017
Total of Premium Income (trillion)
Year
Result of Premium Income Total
Actual
Simulation
3.4 Behavioral Validity Based Problem
Behavior validation is used to test whether the
model built can describe the actual problem. This
stage is the proof stage that the model has a level of
accuracy that is implemented at the time of
application (Sargent, 2013). Some tests using a
statistical approach are suggested for comparing
dynamic system simulation data with actual data
(see, Barlas (1989)).
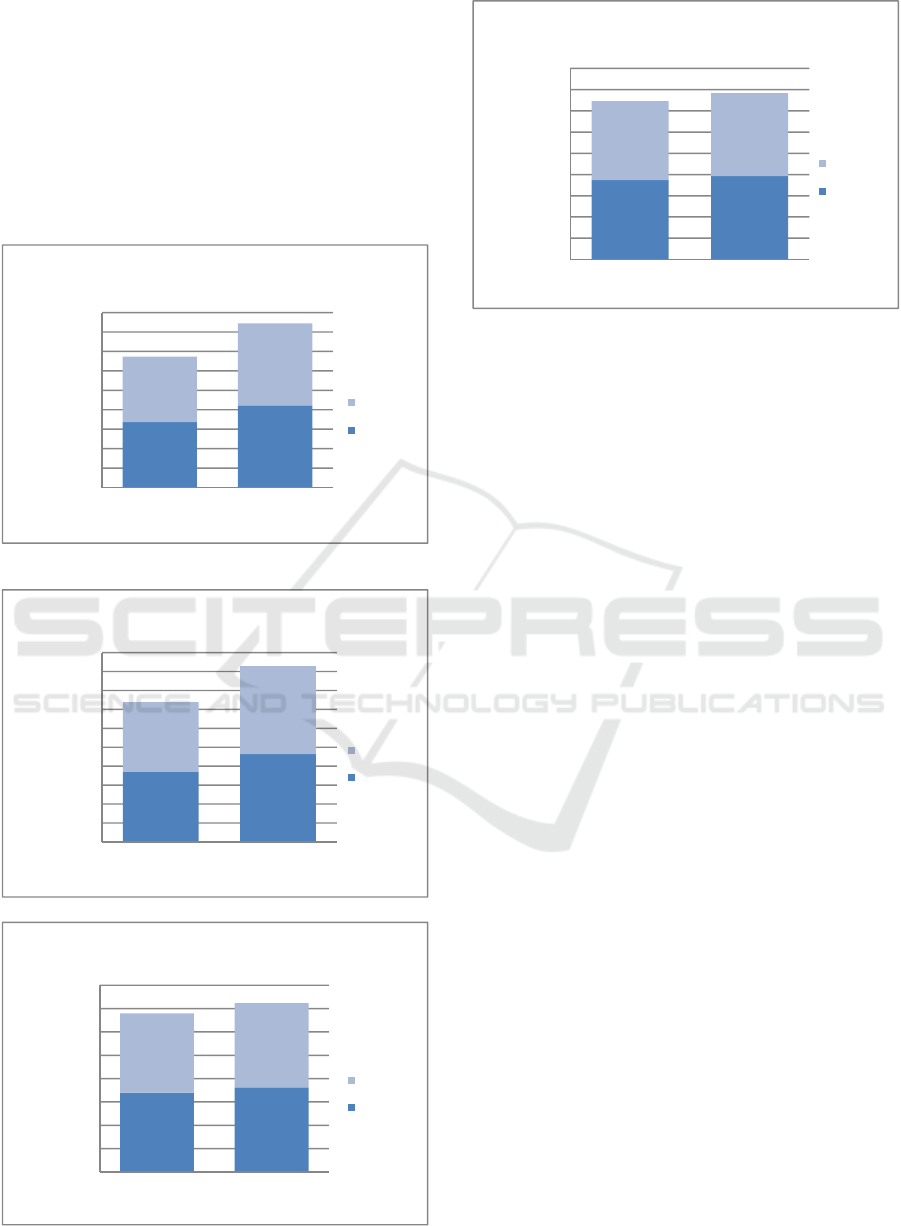
Figure 6: Result of Health Cost Total
Figure 7: Result of Expenses Total
Figure 8: Result of Premium Incomes Total
Figure 9: Result of Incomes Total
SD simulation at INHIS uses data for 2016 and
2017 (Report, 2010). Comparison of simulation
results and actual data from (i) health costs, (ii)
premium income, (iii) expenses, and (iv) INHIS
income is shown by Figures 6, 7, 8, and 9 and can be
said to be accurate. The variables obtained
endogenously at INHIS have a good enough effect
to evaluate the effect of health cost, premium
income, expenditure, and income on the fund
inventory in the run. Premium income will have a
large influence on the income received by INHIS,
which will also have an impact on the fund's
inventory. In addition, the fund inventory is also
influenced by expenses that must be borne by
INHIS. This expenditure is mostly obtained from
health cost dependents that must be paid. The results
of the error analysis are presented in Table 1.
The resulting variable error affects the level of
confidence of the model that has been built. The
maximum number of errors will cause
inconsistencies in the model because it is
incompatible with the real system. Models that have
errors have a great opportunity and are not
acceptable to be applied in real-world practice. To
anticipate this, validation tests are needed on the
structure and behavior of dynamic system simulation
models. Based on Table 1, the error value (E)
calculated using Equation 1 on the 2016 variable
expenses is 0,0009120371 and 2017 is
0,0001520576. The mean error of variable expenses
is 0.000532047. The results obtained from the
calculation of the mean error in the variables "Health
Cost," "Expenses," "Premium Income," and
"Incomes" are respectively 0.00058632,
0.000532047, 0.001811691, and 0.002845 That is,
these variables can replicate the behavior that is
quite accurate. Therefore, the INHIS model that has
been built is declared valid and can be used as a
model reference to perform improvement scenarios.
0.00
20.00
40.00
60.00
80.00
100.00
120.00
140.00
160.00
180.00
2016 2017
Total of Health Cost (trillion)
Year
Result of Health Cost Total
Actual
Simulation
0.00
20.00
40.00
60.00
80.00
100.00
120.00
140.00
160.00
180.00
200.00
2016 2017
Total of Expense (trillion)
Year
Result of Expense Total
Actual
Simulation
0.00
20.00
40.00
60.00
80.00
100.00
120.00
140.00
160.00
180.00
2016 2017
Total of Income (trillion)
Year
Result of Income Total
Actual
Simulation
Structural and Behavioral Validity using a System Dynamic Simulation Approach: The Indonesian National Health Insurance System
Problem
43

Table 1: Error analysis of INHIS
Expenses Incomes Health Cost Premium Incomes
2016
Simulation (S)
IDR
73,967,361,510,162
IDR
74,798,829,930,561
IDR
67,315,283,510,162
IDR
67,994,342,830,560
Actual (A)
IDR
73,899,962,000,000
IDR
74,408,396,000,000
IDR
67,247,884,000,000
IDR
67,995,322,121,186
Error (E) 0.0009120371 0.005247176 0.0010022547 0.0000144023
2017
Simulation (S)
IDR
92,803,446,382,775
IDR
78,387,814,817,242
IDR
84,430,475,804,175
IDR
72,459,589,378,742
Actual (A)
IDR
92,817,560,000,000
IDR
78,353,090,000,000
IDR
84,444,864,000,000
IDR
72,199,024,523,689
Error (E) 0.0001520576 0.000443184 0.0001703856 0.0036089802
Mean Comparison
0.000532047 0.002845 0.00058632 0.001811691
4 DISCUSSION AND
CONCLUSIONS
This research investigates the problems of the
Indonesian National Health Insurance System
(INHIS). The aim is to evaluate government
program policies that want to guarantee the overall
health of the Indonesian people. This program gives
new problems to INHIS, especially the financial
sector. The supply of funds owned by INHIS
continues to experience a deficit due to the
imbalance of the amount of income and expenditure
in INHIS financial flows. Based on a validated
model, the biggest effect of this problem is caused
by health costs and premium income. The SD model
can be used to solve complex problems in the INHIS
system.
ACKNOWLEDGMENTS
This research is funded by the Ministry of Research
Technology and the Higher Education of Republic
Indonesia through the PMDSU program.
REFERENCES
Barlas, Y. (1989). Multiple tests for validations of system
dynamics type of simulation models. European Journal
of Operational Research, 42(1), 59–87.
Barlas, Y., & Carpenter, S. (1990). Philosophical roots of
model validation: Two paradigms. System Dynamics
Review, 6(2), 148–166.
Brailsford, S. & Hilton, N. 2001. A comparison of discrete
event simulation and system dynamics for modelling
health care systems.
Curry, G. L., Deuermeyer, B. L., & Feldman, R. M.
(1989). Discrete simulation. Oakland: Holden-Day.
Faezipour, M. & Ferreira, S. 2013. A system dynamics
perspective of patient satisfaction in healthcare.
Procedia Computer Science, 16, 148-156.
Forrester, J. W. (1961). The model versus modeling
process. System Dynamics Review, 1(2), 133–134.
Forrester, J. W., & Senge, P. M. (1980). Tests for building
confidence in system dynamics models. TIME Studies
in the Management Science, 14, 209–228.
Gass, S. I. (1983). Decision-aiding models: validation,
assessment, and related issues for policy analysis.
Operations Research, 31(4), 603–631.
Goodall, D.W. (1972). Building and testing ecosystem
models. In J. N. J. Jeffers (Ed.), Mathematical models
in ecology (pp. 173–194). Oxford: Blackwell.
Kesehatan, B.P.J.S., 2017. Laporan Pengelolaan Program
Tahun 2016 dan Laporan Keuangan Tahun 2016
(Auditan).
Law, A. M., & Kelton, W. D. (2000). Simulation
modeling and analysis (3rd ed., p. 265). Fairfield:
McGraw-Hill.
Mehrjerdi, Y. Z. 2012. A system dynamics approach to
healthcare cost control. International Journal of
Industrial Engineering, 23, 175-185.
Oliva, R. (2003). Model calibration as a testing strategy
for systemmdynamics models. European Journal of
Operational Research, 151, 552–568.
Pidd, M. (2010). Why modeling and model use matter.
The Journal of the Operational Research Society, 1,
14–24.
Qudrat-Ullah, H., & BaekSeo, S. (2010). How to do
structural validity of a system dynamics type
simulation model: The case of an energy policy model.
Energy Policy.
ICONIT 2019 - International Conference on Industrial Technology
44

Report, T. W. 2010. Health System Financing. The Path to
Universal Coverage. en ligne: http://www. who.
int/whr/2010/whr10_en. pdf.
Rust, T. 2013. Dynamic analysis of healthcare service
delivery: application of lean and agile concepts.
Sargent, R. G. 2013. Verification and validation of
simulation models. Journal of simulation, 7, 12-24
Scholl, J., 2001. Agen based and system dynamics
modelling: a call for cross study and joint research. In:
proceedings of 34 th Annual Hawai International
Conference on System Sciences (HICSS- 34), vol. 3,
Maui, Hawaii, pp. 3002.
Zebda, A. (2002). Using cost-benefit analysis for
evaluating decision models in operational research.
Journal of American Academy of Business,
September, 106–114.
Structural and Behavioral Validity using a System Dynamic Simulation Approach: The Indonesian National Health Insurance System
Problem
45
