
Local Food Innovation: Taro Dawet Ice
Suci Sandi Wachyuni
Hotel Department of Sahid Polytechnic
Keyword: Indonesia, Local Food, Food Innovation, Dawet Ice, Taro, Tourist Experiences
Abstract: Indonesia is rich with natural resources and has many local food. Local food refers to food and other
agricultural products which are grown or produced, processed and then sold within local area. Local food
has many potential for culinary product, such as modern and traditional product. One of local food grown in
Indonesia is tuber, such as taro, sweet potato, cassava, and etc. But, local food innovation with local
ingredients still need to be reproduced for attracting people or tourists to consume local food. Taro is a tuber
which contains carbohydrates, fats, protein, some minerals as well as vitamins. Taro flour can be mixed and
used as base ingredients of cakes, bakery, and others. In this study, researcher make an experimental study
of making Dawet Ice with Taro flour based. As we know Dawet Ice is one of traditional beverages from
Java. Dawet Ice commonly made from rice flour. The following methods is about to make a sample of
Dawet Ice with subtituting rice flour with taro flour in various percentages such as 20%, 40%, 60%, 80%,
and 100%. This research aims to find out the best sample based on the test of sensory analysis (hedonic and
hedonic quality test) were judged by the panelists and knowing the content of nutrition fact of Taro Dawet
Ice. There were 30 panelists who tested this product. The researcher used ANOVA (Analysis of
Multivariance) and Post Hoc Test-Duncan for identifying the differences between various products. The
result showed that Taro Flour can be subtituted of rice flour until 100% in the making of Dawet Ice. Based
on ANOVA test, all various percentages showed differences in sensory parametric in colour, texture, aroma,
and taste of the products. The best product that has been tested is Taro Dawet Ice with 20% Taro flour and
the proximat test showed that in 100gr Taro Dawet Ice contains 2,16 kkal energy for fat, 28.08 kkal total
energy, 93,26% water content, 0,02% ash, 0,24% total fat, and 6,02% total carbohydrate. The information
can be useful as a reference to make another product made from taro or another local food. Hope with
innovation of local food can attract local people or tourists to consume local food as their experiences
1 INTRODUCTION
Local culinary is a part of Indonesian culture. Each
region has a different and unique local cuisine. To
ensure the preservation of local culinary,this needs
improvement and development in order to attract the
interest of the public to consume it. Local cuisine or
so-called traditional Indonesian food is all kind of
food that are made by using local ingredients and
various processing methods, and has special types of
regions, ranging from main foods, snack, and drinks
commonly consumed by the community the area.
One of the local raw materials owned by
Indonesia is tubers, but the development is still not
getting much attention, even though the potential of
the tubers is high enough to be used as food and
manufacture of processed products. Tuber flour can
be used as raw material, both in the form of flour
and tuber starch or mixed flour (Suismono, 2011).
One of the taro-producing cities is Bogor, West
Java. Taro is usually consumed as staple food and
side dish. In addition, taro has a high economic
value because almost all parts of taro plants can be
used for daily consumption and taro plants also have
sufficient nutritional content (Widiyanti, 2008). Taro
tuber processing as food in Indonesia is still
relatively simple. Generally taro is only used limited
to fresh tubers which are processed by boiling,
frying, and making into chips. Taro has a high starch
content so that it has the potential to be used as a
flour-raw material (Richana, et al., 2004).
Based on nutritional content data on the list of
food ingredients, the nutritional value contained in
100 fresh taro includes 1.90% protein, 0.20% fat,
and 23.70% carbohydrate (Mahmud, et al., 2000).
Conversion of fresh taro tubers into a form of flour
that is ready to use, especially for the production of
processed food by side, encourages the emergence
of more diverse products that can also encourage the
Wachyuni, S.
Local Food Innovation: Taro Dawet Ice.
DOI: 10.5220/0009322600430050
In Proceedings of the 1st NHI Tourism Forum (NTF 2019) - Enhancing Innovation in Gastronomic for Millennials, pages 43-50
ISBN: 978-989-758-495-4
Copyright
c
2021 by SCITEPRESS – Science and Technology Publications, Lda. All rights reserved
43

development of the industry and increase the selling
value of taro commodities. The taro siege is also
expected to avoid losses due to the absorption of
fresh taro tubers on the market when the product has
over-harvesting (Wita, et al., 2013). Flour is a result
through drying process, refining, and sifting. Taro
flour has a granule size of about 0.5-5 microns
(Setyowati et al., 2007). The opportunity to develop
taro as a non-rice-starchy food is high and got
supports from the government.
Es Dawet or better known by people in Bogor,
Es Cendol, comes from Banjarnegara, area of
Central Java. Dawet is one of Indonesia's traditional
foods whose main raw materials are cereals. Cendol
has a chewy texture and green in colour
(Candraningsih, 1997). Generally, cendol is made
from rice flour, cassava flour, tapioca flour, hunkwe
flour, or other types of flour. Cendol is made by
mixing several types of flour. Different types of
flour have different characteristics, depending on the
type of flour used. Cendol characterisics are
commonly chewy, chewy but rather hard, and rather
hard (Aggraeni, 2002)
The lack of taro-based product innovation is the
basis for making experiments of taro dawet ice. The
use of rice flour as the base ingredients of dawet ice
was tested to be partially or wholly replaced by taro
flour. Then this is expected to be able to provide
economic value of local culinary and taro tuber
itself.
2 LITERATURE REVIEW
2.1 Taro
Taro (Coloscasia esculenta (L) Schot.) Belongs to
the genus Colocasia monocotyledon with the family
Araceae. It is known that taro is cultivated in Asia,
the Pacific, Central America and Africa. In the
South Pacific islands (Papua New Guinea, Solomon
Islands, Fiji and Samoa) taro is one of the important
food crops, while in Indonesia and other Asian
countries better known as food for snacks or
vegetable. The role as food product is now only
found in several regions, in the Mentawai Islands
and Papua (Richana, Widaningrum, and Widowati,
2008).
Both leaves and tubers of taro have good
nutritional content. The leaves contain 23% dry
weight protein and rich of Calsium (Ca), Phosphor
(P0, Ferrum (Fe), vitamin A, riboflavin and niacin.
Taro tubers have high content of carbohydrates and
protein (Nur Richana, et al., 2008).
2.2 Taro Flour
One of the processed taro products is taro flour. Taro
flour is an intermediate product that can be
processed into other products such as biscuits,
porridge, breakfast cereals, bread, and others.
Intermediate products are expected to have a longer
shelf life, and the drying stage is one of the factors
that can extend the shelf life (Nurdjannah, 2011).
The process of making taro flour follows the
Fauzan method (Fauzan, 2005), the stages are
stripping, slicing the tubers, soaking in a 3% salt
solution to relieve itching, steaming, drying, flouring
and sifting. According to Nurdjanah and Dwi
(2011), in 100 grams of taro flour contains a total
energy of 121.44 kkal, 83.33% moisture content,
0.39% ash content, 0.36% total fat, 2.73% protein,
and carbohydrate a total of 26.82%.
2.3 Dawet Ice
Dawet Ice is a traditional drink from Jepara, Central
Java. Along with the times, dawet ice spread to all
cities on the island of Java, starting from the city of
Semarang, Solo, Jakarta, Bandung, and other cities
in Indonesia. The taste of this drink is sweet and
savory. There is also Dawet Ice which originates
from Sunda land.we often encounter this cendol ice
in the market and on the street vendor. While the
origin of dawet ice itself originated from the land of
Java, Banjarnegara.
According to Candraningsih (1997), dawet or
cendol is one of traditional Indonesian beverages
containing raw materials of grains and nuts, which
has been known and favored in Indonesia. Dawet
has a chewy texture and generally green in color.
Dawet is formed as a result of the starch
gelatinization process.
According to Santoso (2000), in the process of
making dawet, pour the flour or rice flour and food
coloring and water, cook until specific thickness and
then formed using cendol mold.
The hypotheses in this study are:
Ho
1
: There is no difference in consumer
preference level (color, aroma, taste, texture) of
dawet from taro flour with a substitution
percentage of 20%, 40%, 60%, 80%, and
100%.
H1
1
: There is a difference in consumer
preference level (color, aroma, taste, texture) of
dawet from taro flour with a substitution
percentage of 20%, 40%, 60%, 80%, and
100%.
NTF 2019 - The NHI Tourism Forum
44

Ho
2
: There is no difference in sensory quality
(color, aroma, taste, texture) of dawet from taro
flour with a substitution percentage of 20%,
40%, 60%, 80%, and 100%.
H1
2
: There is a difference in sensory quality
(color, aroma, taste, texture) of dawet from taro
flour with a substitution percentage of 20%,
40%, 60%, 80%, and 100%.
3 METHOD
Methodology in this research is experimental
method. The experiments use one standard recipe
and the same processing for each sample in the
making of products and what distinguishes each
sample is the substitution percentage of Taro Flour.
The percentage of taro flour used in this experiments
are 20%, 40%, 60%, 80%, and 100% from the total
flour in the standard recipe. Independent variables in
this research are percentage of taro flour substitution
and dependent variable is the quality of Taro Dawet
as which is measured by sensory analisis (hedonic
and hedonic quality test). The number of sample is
15 samples, which are every level of percentage taro
flour used in the making of dawet ice are made 3
times to ensure the stability of the product. The
examiners who are semi skilled panelists will test
the sensory analysis. The researcher used ANOVA
(Analysis of Multivariance) and Post Hoc Test-
Duncan for analyzing the data to find the differences
of quality for each sample. The recipe and the varios
percentage of taro flour used can be seen in Table 1.
Table 1: Taro Dawet Basic Recipe
No Ingredients
Taro Flour Substitution
20% 40% 60% 80% 100%
1 Rice Flour 32gr 24gr 16gr 8 gr -
2 Taro Flour 8 gr 16gr 24gr 32gr 40 gr
3
Tapioca
Flour
60gr 60gr 60gr 60gr 60 gr
4 Salt 1 tsp 1 tsp 1 tsp 1 tsp 1 tsp
Source: Processed Data, 2016
4 RESULTS AND DISCUSSIONS
4.1 Results
4.1.1 Hedonic Results (Consumer
Preference Level)
From Table 1 the average value of the overall
preference test sample, sample of 20% taro flour is
the best sample because that sample got the highest
average value (3.92), followed by 40%, 60%, 80%,
and 100% Taro flour substitution. The best sample,
Dawet from 20% taro flour substitutions will be
continued with proximate/nutrition test to determine
each nutrient content containe. The average hedonic
test results can be seen in Table 2 while the ANOVA
results for the hedonic test can be seen in Table 3.
Table 2: The Average Value of Hedonic Test of Taro
Dawet
Indicator
Taro Flour Substitutions
(
%
)
20% 40% 60%
80
%
100
%
Colo
r
4.08 4.07 3.76 3.67 3.32
Flavo
r
3.97 3.70 3.59 3.46 3.52
Taste 3.66 3.69 3.74 3.54 3.54
Texture 3.92 3.84 3.75 3.66 3.55
Total Average
Value
3,91 3,83 3,71 3,58 3,48
Source: Processed Data, 2016
a. Hedonic Test : Color
Color is the result of person's observations using
the eyes on an object or things. Substitution of taro
flour with the highest value found in the sample of
20% taro flour, then followed by 40%, 60%, 80%,
and 100% in making Taro Dawet Ice.
Because it has significance values <0.05 and
<0.01, Fcount> Ftable, then H01 is rejected and H11
is accepted. There are differences in color
preferences level between the dawet with different
taro flour substitutions. Then the hedonic color test
can be continued to the Duncan test to see the
differences in preference for each variant of taro
flour. It can be seen from Table 4, the level of
consumer preferences of the samples between 20%
and 40% are the same, 60% and 80% are the same as
well.However there’s a difference from the sample
100 % which has the lowest favorite level value.
Local Food Innovation: Taro Dawet Ice
45

Table 3: Statistical Result of ANOVA Hedonic Test
Source : Processed Data, 2016
:Alpha = 0.05
Sig > 0.0, Fcounted < Ftable: H0 accepted,
H1refused
Sig < 0.05 Fcounted >Ftable: H0 refused, H1
accepted
Table 4: Duncan Test Result of Hedonic Color
b. Hedonic Test : Flavor
Flavor is one of the main indicators which provide
odor stimulation so that it can be smelled by
humans. The flavor can provide a perception of the
product. In addition, flavor can influence person to
consume products. The data shows the average value
of flavor preference, with the highest value is the
sample of 20% Taro flour, then followed by sample
40%, 60% 100%, and 80%. Based on ANOVA
results in Table 3, the significance values <0.05 and
<0.01, Fcount> Ftable, then H0
1
is rejected and H1
1
is accepted, that there is a difference in flavor
preferences level, between dawet products with
different taro flour substitutions. And then directly
proceed with Duncan Test. From Table 5 of
Duncan's test results, based on α <0.05, samples
20% and 40% are not significantly different but
different with samples 60%, 80%, and 100% while
in the error rate α <0.01 sample 20% are different
from all other samples.
Table 5: Duncan Test Result of Hedonic Color
Percenta
g
e of Substution
N
otation
α < 0.05 α<0.01
100% c
b
80%
b
c
b
60%
b
c
b
40% a ab
20% a a
c. Hedonic Test : Taste
Taste is the result of stimulation from the sense of
taste, tongue. Taste preference for a particular
product is also closely related to the flavor and look
of the product so that, it can cause someone like or
dislike a product. Taste is defined as stimulus that is
received by tongue into our mouth and the tongue
can sense different type of taste then provide a
perception of the product.
The highest average value of flavor preference is
the sample contain 60% taro flour, then followed by
40%, 20%, 80%, 100% of taro flour subtitutions.
Judging from the Anova statistical result in Table 2,
the taste preference test states that the significance
value> 0.05, or the value of Fcount <Ftable, then
H0
1
is accepted and H1
1
is rejected which can be
interpreted that the taste preference level is not
significantly different in Dawet with different
substitution of taro flour.
d. Hedonic Test : Texture
Texture is an attribute of sensory that can be felt by
touch. The characteristics of the texture itself can be
accepted by sight and touch. The average texture
value of sample 20% and 80% has the same value
which is the highest value of the hedonic test of
texture preferences, as for the sample of 40% and
60% these also have the same and the value are less
than the highest one. then the least value is dawet
with 100% taro flour sample. The results of the
statistical analysis in Table 2 show the significance
value> 0.05, or the value of Fcount <Ftable, then
H0
1
is accepted and H1
1
is rejected. It can be
interpreted that the level of texture preference is not
significantly different in Dawet with different
substitution of taro flour.
Anova
Sum of
Squares
Df F Sig.
Color 1,176 4 18,787 ,000
,157 10
1,333 14
Flavor ,479 4 7,946 ,004
,151 10
,630 14
Taste ,092 4 ,988 ,457
,232 10
,324 14
Texture ,063 4 1,102 ,407
,143 10
,206 14
Percenta
g
e of Substution
N
otation
α<0.05 α <0.01
100% C c
80% C
b
60% C ab
40% A a
20% A a
NTF 2019 - The NHI Tourism Forum
46
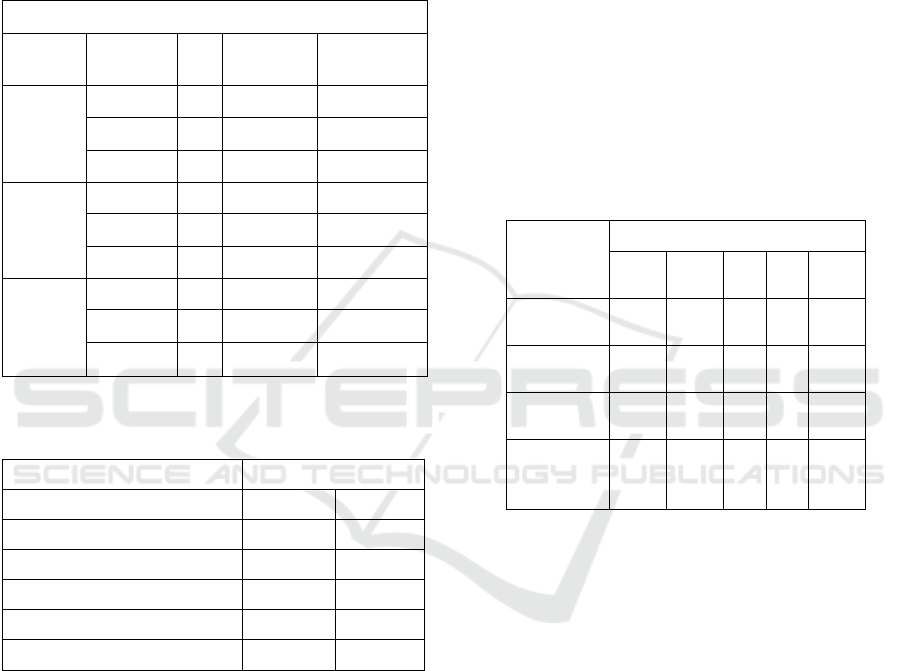
4.1.2 Sensory/Hedonic Quality Test
Quality test or hedonic quality test is carried out to
determine the difference in quality of each sample
tested. The average results of Taro Dawet hedonic
quality test can be seen in Table 6 and Anova test
results can be seen in
Table 6.
Table 6: Taro Dawet Hedonic Quality Test
Table 7: Statistical Reslut of ANOVA Hedonic Quality
Test
Source : Processed Data, 2016
:Alpha = 0.05
Sig > 0.0, Fcounted < Ftable: H0 accepted,
H1refused
Sig < 0.05 Fcounted >Ftable: H0 refused, H1
accepted
a. Hedonic Quality Test : Color
Table 6 show the result of the hedonic quality test of
the Taro Dawet color which has the highest average
value found in the sample of 20%, then followed by
sample 40%, 60%, 80%, then 100 % taro flour
substitution. The results of color measurements with
a scale from pure white to not too white. Dawet
whose color is pure white when made from rice
flour, the color changes when adding taro flour. The
color is increasingly turning to turbid white or gray
as the level of substitution increases, this is due to
the dominant color of taro starch which is gray.
Anova statistical results of hedonic quality in Table
7 state that the color indicators have significance
value <0.05 or Fcount> Ftable, then H0
2
is rejected
and H1
2
is accepted. It can be interpreted there are
significantly different color quality levels on Dawet
flour with different percentage of Taro Flour
substitutions. Then, proceed to the Duncan Test
which can be seen in Table 8. Table 8 show in the
level of α<0.05, sample 80% and 100% taro flour
substitution have no color difference. Then in the
sample of 20%, 40%, 60% and 80% there is a real
color difference. Whereas at α <0.01, only 20% and
100% samples had significant color differences from
other samples.
Table 8: Duncan Test Result of Hedonic Quality Color
Indicator
Taro Flour Substitutions (%)
20
%
40
%
60
%
80
%
100
%
Colo
r
4.57 4.21
3.
88
3.
59 3.42
Flavo
r
3.59 3.40
3.
07
3.
15 3.10
Texture 3.88 3.69
3.
44
3.
31 3.17
Total
Average
Value 4.01 3.76
3.
46
3.
35 3.30
b. Hedonic Quality Test : Flavor
Table 6 show the result of the hedonic quality test of
the Taro Dawet flavor which has the highest average
value found in the sample of 20%, then followed by
40%, 60%, 80%, and 100%. Measurement scale
from very not unpleasant to very unpleasant. Along
with the increase of taro flour substitution induces
unpleasant flavor. From the result of the ANOVA
analysis which can be seen in Table 7. The
significance value of flavor hedonic quality test is
<0.05 or Fcount> Ftable, then H0
2
is rejected and
H1
2
is accepted. It can be interpreted there are
significantly different level of flavor quality among
Dawet Ice with Taro flour substitutions. And then
the sample continued with the Duncan Test that can
be seen in Table 9.
Duncan test result showed the value of the flavor
hedonic quality with a significant difference at α
<0.05 shown between samples 20%, 60%, and
100%. Whereas at α <0.01, it is shown that sample
20% has a marked difference between the others.
Anova
Sum of
Squares
df F Sig.
Color 2.582 4 32.572 ,000
.198 10
2.781 14
Flavor .605 4 7.741 ,004
.195 10
.801 14
Texture .986 4 27.741 ,000
.089 10
1.075 14
Percenta
g
e of Substitutions
N
otation
α <0.05 α <0.01
100%
d
d
80%
d
c
d
60% c
b
c
40%
b
ab
20% a a
Local Food Innovation: Taro Dawet Ice
47

Table 9: Duncan Test Result of Hedonic Quality Flavor
c. Hedonic Quality Test : Texture
Table 6 show the result of the hedonic quality test of
the Taro Dawet texture which has the highest
average value found in the sample of 20%, then
followed by 40%, 60%, 80%, and 100%. This dawet
texture seen from its elasticity, the higher
substitution of taro flour, texture are softer. In other
words, the sample in which has the highest value in
the elasticity level is sample 20%. Based on Table 7,
the Anova statistical result of the texture quality test
stated that the significance value <0.05 or Fcount>
Ftable, then H0
2
was rejected and H1
2
was accepted.
It can be interpreted that the level of hedonic texture
quality is significantly different in dawet samples
with different taro flour substitutions. Duncan test
result of hedonic texture quality can be seen on table
10
Table 10: Duncan Test Result of Hedonic Quality Texture
Duncan test results of the hedonic quality of texture
at the level of α <0.05 indicate that the sample 80%
and 100% have no texture differences. So are the
sample 60%, and 80%. But among samples 20%,
40%, 60% and 100%, there were textural
differences. Whereas at α <0.0, Duncan test shows
that the 20% and 40% samples are not different, but
both are different based on sample 60%, 80%, and
100%. But there were no significant texture
differences in the sample of 80% and 100% dawet
with taro flour substitution.
d. The Best Formulation
Based on Table 2, the average value of total sensory
indicators (color, flavor, texture, and taste) of the
overall preference tests can be seen that the
substitution of 20% of taro flour in making dawet
becoming the most favorite sample of panelists, then
followed by samples 40%, 60%, 80% and 100%.
Then sample 20% will be continued to have
nutrition test to know the amount of each nutrient
contained in it. This 20% sample has the
characteristics of white color, slightly unpleasant
flavor, and rather chewy in texture. Then, Dawet can
be serve with palm sugar and coconut milk that can
be added adjusted to consumer taste.
4.1.3 Proximate/Nutrition Fact Analysis
Sample 20% which is the best sample based on
panelists have been tested in Saraswanti Indo
Genetech Bogor. The results can be seen in Table
11, each 100 grams of dawet ice which contains
20% taro flour has a total energy calculation of 28
calories, The serve suggestion is just adding a little
portion of palm sugar and coconut milk.
Table 11: Nutrition Fact of Taro Dawet Ice (Without
Sugar and Coconut Milk)
No Parameter Unit Result
1
Calories
form fa
t
kkal / 100
g
2.16
2
Total
Calories kkal / 100
g
28.08
3
Water
conten
t
% 93.26
4Ash conten
t
% 0.02
5Total fa
t
% 0.24
6 Protein % 0.46
7
Total
carboh
y
drate % 6.02
Source: Result of proximate test in Saraswanti Indo
Genetech, 2016
5 DISCCUSSION
5.1 Taro Dawet Ice as Local Food
Innovation and It’s Potential as
Tourist Attraction
Based on the result of sensory test, Taro Flour can
be substituted in making dawet up to 100%.
However, after going through a preference test, 20%
is the most preferred and best sample in terms of
Percentage of
Subtitutions
N
otation
α <0.05 α <0.01
100% c
b
80%
b
c
b
60% c
b
40% ab ab
20% a a
Percentage of
Substitution
N
otations
α <0.05 α <0.01
100%
d
c
80% c
d
b
c
60% c
b
40%
b
a
20% a a
NTF 2019 - The NHI Tourism Forum
48

quality. The characteristics of dawet made from taro
are white, the aroma is rather unpleasant, and the
texture is chewy. This product also has a low calorie
so that it can be consumed by people who are on a
diet. According to Nurdjannah and Amiarsi (2011),
taro flour has health benefits, including energy
sources, both for digestive health, improving the
body's immune system, carbohydrate substitute for
people with diabetes, blood pressure and heart
health, as well as increasing vision. But not all
people can enjoy processed products from taro, for
example, obese people, and allergic sufferers who
are sensitive to the mucus and oxalate content
contained in taro
Generally, taro tubers are only consumed by
boiling, frying, or by other conventional methods.
And dawet is generally made with rice flour. Both
rice flour and taro flour are Indonesian local raw
materials. The differentiation of dawet products is
also expected to be a surprise for consumers or
tourists, so they are interested in getting new
experiences trying new flavors from local culinary
products. Taro is mostly found in Bogor, West Java.
The identity of various culinary cities in Indonesia
need to be strengthened with innovative products
based on local products.
Local cuisine is currently being concern in
tourism. Because eating is basic needs of tourists.
According to Chang, Hall & Mitchell, and Scarpato
(in Mak et.al, 2012) there are increasing numbers of
destinations for their culinary resources in
promoting and differentiating themselves from
others, for example, Australia, New Zealand, Italy,
and Singapore. Today, many tourist destinations use
food as one of the tourist attractions in their tourism
marketing (Lin, Pearson & Chai, 2011).
Furthermore, Telfer and Wall (in Mak, et.al, 2012)
state that tourist expenditure for food reaches one
third of total tourist expenditure, therefore the
economic benefits resulting from the consumption of
tourist meals can give impact on the economic
sustainability, competitive destinations, and
development of hospitality business. in that area.
Local culinary innovation products such as Taro
Dawet ice is very potential to be developed as
regional tourism attractions.
6 CONCLUSION
Taro flour can be substituted in making dawet up to
100%, but the best sample is 20% percentage of
subtitutions. It’s position is in the first rank of the
test of preference. The characteristics is good in
color (white), flavor (rather unpleasant, but not too)
and texture (chewy) and all is accepted by the
examiner in sensory evaluation. The difference in
the level of preference for the sample tested are in
the hedonic test of color and flavor, while it does not
differ in texture and taste. Whereas in the hedonic
quality test, all samples have significant differences
in terms of color, taste, and texture. After doing the
proximate test taro resulting dawet is low in
calories. Suggestions for the use of sugar to be
added sufficiently so that it is safe for Diabetics
sufferers. It can also added with other natural
sweeteners such as honey. Suggestions for further
research is to be able to do the experiments on other
local culinary products varied from taro tubers, other
tubers, and other culinary products made by local
commodities.
REFERENCES
Ade, Setiawan. (2011). Uji Wilayah Berganda Duncan.
http://www.smar tstat.info/rancangan percobaan/per
bandingan-rata-rata/uji-lanjut-dun can.html. Diakses
pada tanggal 26 Juni 2016. (Online)
Anggraeni, D. (2002). Mempelahari Daya Simpan Cendol
pada Penyimpanan Suhu Kabar dan Suhu
Refrigerator. Skirpsi. Fakultas Teknologi Pertanian.
IPB. Bogor.
Arikunto, S. (2013). Prosedur Penelitian Suatu
Pendekatan Praktik. Jakarta: Rineka Cipta.
Candraningsih, F. (1997). Perilaku Konsumen Makanan
Tradisional Sunda (Studi Kasus di Rumah Makan
Sunda Ponyo dan Bu Mimi, Kodya Bogor). Skripsi.
Fakultas Pertanian. IPB. Bogor.
Ernayanti, dkk. (2003) Ensiklopedi Makanan Tradisional
di Pulau Jawa dan Pulau Madura. Deputi Bidang
Pelestarian dan Pengembangan Kebudayaan, Asdep.
Jakarta: Proyek Pelestarian dan Pengembangan Tradisi
dan Kepercayaan.
Lin, Yi Chin, Pearson.T.E, Chai, L.A. (2011). Food as a
Form of Destination Identity : A tourism Destination
Brand Perspective.
https://journals.sagepub.com/doi/abs/10.1057/thr.2010
.22
Mahmud, Mien, K., Hermana, Nila, A.Z., Aprianto, R.R.,
Ngaditao, I., Hartanti, B., Bernadus, dan Tinexcelly.
(2000). Tabel Komposisi Pangan Indonesia. Jakarta:
PT. Media Elex Komputindo.
Mak. A.H.N, Margaret. L.,A. Eves., R. Chang (2012).
Factors Influencing Tourist Food Consumption.
http://www.sciencedirect.com/science/journal/027843
19
Prihatiningrum. (2012). Pengaruh Komposisi Tepung
Kimpul dan Tepung Terigu terhadap Kualitas Cookies
Semprit. Food Science and Culinary Education
Journal, FSCE 1 (1) (2012). (Online).
Local Food Innovation: Taro Dawet Ice
49

(http://journal.unnes.ac.id/sju/index.php /fsce. Diakses
22 Juni 2016)
Richana N., Sunarti TC. (2004). Karakteristik Sifat
Fisikokimia tepung Umbi dan Tepung Pati dari Umbi
Ganyong, Suweg, Ubi Kelapa, dan Gembili. Jurnal
Pascapanen. 2004; 1(1):29-37.
Rungkat, F., Zakaria, dan Andarwulan N. (2001). Khasiat
Berbagai Pangan Tradisional untuk Pangan
Fungsional dan Suplemen. Prosiding Seminar Nasinal:
Pangan Tradisional sebagai Basis Industri Pangan
Fungsional dan Suplemen. Jakarta.
Setyowati, M., I. Hanarida dan Sutono. (2007).
Karakteristik Umbi Plasma Nutfah Tanaman Talas
(Colocasia esculenta). Buletin Plasma Nutfah
13(2):49-56.
Suismono. (2011). Teknologi Pembuatan Tepung dan Pati
Ubi-ubian untuk Menunjang Ketahanan Pangan.
Majalah Pangan Vol. X. No. 37:37-49. Puslitbang
Bulog. Jakarta.
Wahana Komputer. (2015). Belajar Cepat Analisis
Statistik Peramatik dan Non Peramatik dengan SIPSS.
Yogyakarta: C.V Andi Offset.
Wita, Dola Rista Sidabutar., Rona J Nainggolan, dan
Ridwansyah. (2013). Kajian Tepung Talas dan
Tepung Kacang Hijau Terhadap Mutu Cookies.
J.Rekayasa Pangan dan Pert. Vol. I No. 4. H. 67-75.
https://id.wikipedia.org/wiki/Kuliner_tradisional_indonesi
a. Diakses pada tanggal 22 Juni 2016. (Online)
NTF 2019 - The NHI Tourism Forum
50
