
The Effect of Market Attractiveness and Value Creation on the
Performance of Fertilizer Companies in Indonesia
Indarto Pamoengkas and Sulaeman Rahman
Faculty of Economics and Business, Universitas Padjajaran
Keywords: Market Attractiveness, Value Creation, Company Performance
Abstract: In the business development of both organic and inorganic fertilizers in Indonesia, companies have not shown
a high performance, while the demand for fertilizers continues to grow. This condition was allegedly caused
by issues related to the development of the value creation in the fertilizer industry. Other aspects that are
thought to have an impact on these conditions are related to adapting the attractiveness of the fertilizer market.
Based on this background, this research aims at examining the effect of market attractiveness and value
creation on the performance of fertilizer companies in Indonesia.
This research used a quantitative research approach. The unit of analysis in this research was fertilizer
producers in Indonesia, especially producers registered with the Ministry of Agriculture. Observations were
carried out using a cross section/one shot in the time horizon, which was year 2019. The observation unit was
the management of fertilizer producer companies in Indonesia. The population in this research was all
fertilizer producer totaling 55 companies, and a census was carried out on all fertilizer producers in Indonesia.
Verification analysis was used to measure quantitative data and hypothesis testing was conducted using PLS
(Partial Least Square).
The results showed that market attractiveness and value creation had a significant effect on company
performance, where value creation had a greater influence than market attractiveness. The dominant value
creation dimension in improving company performance was business domain, and then followed by business
partners, and customer benefits. While the most dominant dimension of market attractiveness in driving
company performance was market access, followed by market strength, and intensity of competition.
The results of this research have implications for the management of fertilizer companies in Indonesia that
improving company performance rests on the development of value creation, especially in the aspect of the
business domain, which is supported by the adaptation of market attractiveness especially in terms of market
access.
1 INTRODUCTION
At the international level, the fertilizer market
competition in 2018 was still high due to oversupply
faced by the international urea market. This condition
had resulted in difficulties in competing for fertilizer
producers who had uncompetitive selling prices. The
international prices of urea and ammonia hit their
lowest point in 2017, but turned rebounced in 2018
before going down again in H1 2019.
The high climate of competition in the
international fertilizer market was indicated from the
expansion of the establishment of new factories,
especially in areas that had low to medium production
cost advantages. The increase in the expansion of
factory establishment was not directly proportional to
the growth in consumption levels, which caused
oversupply market conditions. Another implication
was that products with uncompetitive prices lost
market share.
According to data from the Association of
Indonesian Fertilizer Producers (APPI – Asosiasi
Produsen Pupuk Indonesia), the consumption of urea
fertilizer throughout 2018 was the largest in the last
10 years with an achievement of 6,26 million tons,
exceeding the realization of urea fertilizer
consumption in 2017 which was 5.97 million tons.
The large amount of consumption was caused by
several factors, including the long rainy season that
encouraged farmers to produce more. The national
urea consumption in 2018 was dominated by the
agriculture (4.10 million tons), plantation (1.56
Pamoengkas, I. and Rahman, S.
The Effect of Market Attractiveness and Value Creation on the Performance of Fertilizer Companies in Indonesia.
DOI: 10.5220/0009311105230530
In Proceedings of the 2nd Economics and Business International Conference (EBIC 2019) - Economics and Business in Industrial Revolution 4.0, pages 523-530
ISBN: 978-989-758-498-5
Copyright
c
2021 by SCITEPRESS – Science and Technology Publications, Lda. All rights reserved
523

million tons), and industrial sectors (600 thousand
tons). Meanwhile, the export of urea fertilizer
throughout 2017 decreased by 39% to 766 thousand
tons compared to the previous year of 1.25 million
tons, later then improved in 2018 by achieving 1.14
million. This fluctuation was mainly due to the
unstable market price of urea and ammonia.
Nonetheless, the total urea consumption for the
domestic and export markets in 2018 increased by
10% to 7.40 million tons compared to the previous
year of 6.73 million tons. Meanwhile, NPK fertilizer
consumption also rose by 7.8% to 2.8 million tons
compared to the previous year of 2.59 million tons.
Urea fertilizer production fluctuated in the 2010-
2018 period. The fertilizer produced by PT Pupuk
Indonesia (PTPI) was dominated by urea, followed by
NPK and other fertilizers. However, production had
already fluctuated from 2013 to 2018.
PTPI fertilizer sales were divided into two
segments, namely the subsidized and non-subsidized
segments. PTPI's subsidized fertilizer sales
performance increased from 2013 to 2018. However,
the non-subsidized segment fluctuated from time to
time. The performance of export sales even showed a
weakening in line with fluctuations in prices of
fertilizer and ammonia commodities. The description
indicated problems in the performance of fertilizer
companies in Indonesia. According to Wheelen &
Hunger (2015), company performance is related to
sales, market share and profitability.
The aforementioned conditions were considered
to be related to value creation. This thought was based
on a literature review of previous research, such as the
findings of Sanchez et al. (2010) which showed that
producer organization learning is a direct factor to the
positive ability of customer value creation, which is
understood from a functionalist perspective that
directly enhances the business performance of
producers. In addition, Rodgers (2010) found that
corporate value creation causes performance gaps,
which are explained by seven organizational
variables focus on the entire organization, consisting
of vision, mission, core values, goals, strategies,
organizational flexibility and risk.
Conceptually, Kotler & Keller (2012: 79)
explained that customer value creation focuses on
customers, core competencies in business domains,
and collaborative networks at business partners. So
that, companies can create customer value, if they are
able to focus on providing benefits to customers, have
superior core competencies, and have good business
partners in their collaborative network. While
empirically, indications such as the lack of effort to
develop collaboration with business partners were
found. By paying attention to the high international
competition climate, each fertilizer producer is
required to operate efficiently, and be more
responsive to opportunities and take anticipatory
steps to continue to grow sustainably. Fertilizer
companies continued to make efforts to obtain gas
contracts at competitive prices.
Other aspects that are thought to be related to
problems in the performance of fertilizer companies
were the aspect of adapting market attractiveness. Ju
& Zhao (2009) found that the intensity of industrial
competition positively moderated the influence of
slacking organizations on performance.
Best (2013) suggested that the attractiveness of
segments are based primarily on three important
considerations, namely market demand, intensity of
competition, and market access. The measures of
market attractiveness are market forces, competitive
intensity, and market access. While the results of the
observations indicated that fertilizer companies in
producing and marketing fertilizers had not been
based on observations of market forces, such as the
extent of the market coverage, the extent of the
customer's purchasing power, and whether customers
have characteristics as loyal customers.
Based on the background, this research aims at
examining the effect of market attractiveness and
value creation on the performance of fertilizer
companies in Indonesia.
2 LITERATURE REVIEW
2.1 Market Attractiveness
Walker, Mullins and Boyd (2011) revealed that the
measuring factors of market attractiveness are
customers’ needs and behavior, market size, market
growth rate, and macro trends (demographic, socio-
cultural, economic, political/legal, technological, and
natural trends). Meanwhile, the measuring factors to
determine the position of the competitors are
opportunity for competitive advantage, firm and
competitor capabilities and resources, and the
attractiveness of the industry where they complete
(threat of new entrants, or new substitutes, buyer
power, supplier of power, competitive rivalry, and
industry capacity).
Best (2013) suggested that the attractiveness of
segments is based primarily on three important
considerations, namely an assessment of market
demand, competition intensity, and market access.
According to Best (2013), market attractiveness can
EBIC 2019 - Economics and Business International Conference 2019
524

be measured by market forces, competitive intensity,
and market access.
There are three factors that shape market
attractiveness, namely:
1. Market forces with indicators of market coverage
served (market size), level of product/service
growth (growth rate), strength of buyer power,
and customer loyalty
2. Competitive intensity with indicators of number
of competitors, competitor prices, ease of entering
the market, and service products or service
substitutes.
3. Market access with indicators of customer access,
familiarity with products/services of the
company, ease in getting products/services
(channel access), sales requirements, and ease in
managing and developing markets (company fit)
While, according to Huser (2012), market
attractiveness is a multidimensional phenomenon that
includes:
a. Market size
b. Market growth
c. Market potential / dynamics (prospective)
d. Others: distribution of small/medium goals
(diversification), off-season distrisution, length of
stay, and price insensitivity
On the other hand, Hubbard and Beamish (2011)
revealed that market attractiveness can be measured
based on the condition of the company's competitors,
customer demand, supporting and infrastructure
conditions, and supplier conditions.
Based on the description of the concept of market
attractiveness, market attractiveness in this research
refers to the Best’s (2013) description, hence it was
measured by the dimensions of market strength,
intensity of competition, and market access.
2.2 Value Creation
Kotler & Keller (2016:43) developed the concept of
holistic marketing. Holistic marketing is based on the
development, design, and implementation of various
marketing programs, processes, and activities that are
broad and interdependent. Holistic marketing
requires an integrated perspective in understanding
various issues related to marketing. Therefore,
holistic marketing recognizes and adjusts the scope
and complexity of various marketing activities.
Holistic marketing has four broad components,
namely relationship marketing, integrated marketing,
internal marketing, and performance marketing.
The holistic marketing dimensions relates to the
business task of delivering customer value to an
advantage. Marketers can succeed if they adjust the
value delivery process and select, provide, and
communicate superior value to the buyer. Kotler &
Keller (2012:79) explained that customer value
creation focuses on customers, core competencies in
business domains, and collaborative networks with
business partners. Therefore, companies can create
customer value, if they are able to focus on providing
benefits to customers, have superior core
competencies, and have good business partners in
their collaborative network.
Value creation activities are related to business
strategy. Hubbard & Beamish (2011:36) explained
that business strategies are related to value creation
that results in customer value, namely the difference
between what is sacrificed in costs and what is
received in a number of benefits derived from the
performance of a product or service received from the
organization. According to Bowman & Ambrosini
(2000), value creation is related to innovation that
increases benefits for consumers; from the
consumer’s perspective, value creation is related to
increasing value that can have an impact on
increasing consumer loyalty.
Based on the description of the concept, the value
creation in this research was measured by the
dimensions of benefits for customers, business
domains, and business partners.
2.3 Company Performance
The concept of performance was explained by
Wheelen et al. (2015) as the end result of an activity.
Performance is related to the objectives formulated in
the strategies as part of the management process.
In measuring performance, David (2013) used
quantitative criteria in the form of financial ratios to
compare company performance in several periods, to
compare company performance with competitor
performance, and to compare the company's
performance towards the industry average. Financial
ratios that are used to evaluate strategies are Return
on Investment (ROI), Return on Equity (ROE), Profit
Margin, Market Share, Debt to Equity, Earnings per
Share, Sales Growth, and Assets Growth.
Hassabelnaby, Hwang & Vonderembse (2012)
measured company performance with the dimensions
of financial performance (Return on Assets/ROA)
and nonfinancial performance (Quality). Huang
(2010) measured company performance based on
financial performance, measured by ROA, while
Fonseka et al. (2013) measured company
performance through accounting-based performance
measure, and ROI.
The Effect of Market Attractiveness and Value Creation on the Performance of Fertilizer Companies in Indonesia
525

Based on the concepts and dimensions of
company performance, the company performance
variable in this research was measured by the
dimensions of sales, profitability, and market share.
2.4 Hypothesis
H : Market attractiveness and value creation affect
company performance.
3 METHODOLOGY
This research examined the fertilizer industry in
Indonesia using a quantitative research approach
focused on the numerical assessment of the learned
phenomenon. Quantitative research is more
systematic, planned, structured, clear from the
beginning to the end of the research. This quantitative
approach is used to identify all concepts of the
research objectives (Malhotra, 2010). Quantitative
research seeks to test a theory by specifying
hypotheses, and then collecting data to support or
refute the theory. The data were collected using
special instruments designed to assess behavior, and
the information was analyzed using statistical
procedures and hypothesis testing.
Observations were carried out using a cross
section/one shot in the time horizon, meaning that the
information or data obtained was the result of
research conducted at one time, namely in 2019.
According to Sekaran (2010: 132), the unit of
analysis is level of aggregation of the data collected
during the subsequent data analysis stage. The units
of analysis in this research were companies of both
organic and inorganic fertilizers. Thus, the population
in this research was all fertilizer producers totaling 55
companies. Based on this population, a census of all
fertilizer producers in Indonesia was conducted. The
observation units used as the respondent in this
research were the managers or management of
fertilizer producer companies in Indonesia.
Verification analysis was used to measure
quantitative data and hypothesis testing using the PLS
(Partial Least Square).
4 RESULT AND FINDING
The following explains about the results of analysis
based on PLS method.
4.1 Result of Model Analysis Using
PLS
4.1.1 Evaluation of Measurement Model
(Outer Model)
The measurement model in this research used
SmartPLS program. The outer model analyzed the
relationship between latent variables and indicators.
Tests were carried out on external models include:
Convergent Validity: The value of convergen
validity was the value of loading factor on the
latent variable with its indicators. The expected
value was > 0.7.
Composite Reliability: The data had high
eliability with the composite reliability > 0.7.
Average Variance Extracted (AVE). The
expected AVE value was > 0.5.
Table 1: Reliability
Construct AVE Composite
Reliability
Cronbach’s
Alpha
PERFORMANCE 0.504 0.854 0.794
MARKET
ATTRACTIVENESS
0.558 0.902 0.880
VALUECREATION 0529 0.854 0.802
Table 1 depicted the reliability test of variables.
The values obtained were AVE > 0.5. Cronbach’s
Alpha > 0.7 and Composite Reliability > 0.7.
Therefore, the research variables had good reliability.
Table 2: Convergent Validity Dimension-Indicator (1
st
order)
Indicator <‐
Dimension
Original
Sample
(O)
Standard
Error
(STERR)
T Statistics
(|O/STERR|)
Concl
usion
CP1<‐Sales 0.886 0.028 32.073 Valid
CP2<‐Sales 0.914 0.014 64.873 Valid
CP3 <‐
Profitability
0.803 0.048 16.701 Valid
CP4 <‐
Profitability
0.849 0.020 41.606 Valid
CP5 <‐
Market
share
0.924 0.023 41.022 Valid
CP6 <‐
Market
share
0.907 0.024 37.764 Valid
MA1 <‐
Market
forces
0.762 0.035 21.817 Valid
MA2 <‐
Market
forces
0.709 0.053 13.333 Valid
MA3 <‐
Market
forces
0.613 0.074 8.280 Valid
EBIC 2019 - Economics and Business International Conference 2019
526

MA4 <‐
Market
forces
0.758 0.047 16.057 Valid
MA5 <‐
Intensity
0.654 0.055 11.837 Valid
MA6 <‐
Intensity
0.771 0.062 12.416 Valid
MA7 <‐
Intensity
0.864 0.024 36.257 Valid
MA8 <‐
Market
Access
0.777 0.040 19.416 Valid
MA9 <‐
Market
Access
0.638 0.078 8.191 Valid
MA10 <‐
Market
Access
0.658 0.068 9.724 Valid
MA11 <‐
Market
Access
0.717 0.041 17.357 Valid
VC1 <‐
Customer
benefit
0.839 0.045 18.679 Valid
VC2 <‐
Customer
benefit
0.848 0.031 27.037 Valid
VC3 <‐
Customer
benefit
0.665 0.088 7.559 Valid
VC4 <‐
Business
domain
0.811 0.055 14.741 Valid
VC5 <‐
Business
domain
0.677 0.093 7.264 Valid
VC6 <‐
Business
domain
0.608 0.118 5.161 Valid
VC7 <‐
Business
Partner
0.920 0.021 43.335 Valid
VC8 <‐
Business
Partner
0.930 0.017 54.576 Valid
The value of convergen validity was the value of
the loading factor in the latent variable with its
indicators. The value of loading factor was > 0.5,
meaning that the indicator was a valid mesurement
for latent variables in first order.
Table 3: Convergent Validity of Latent Variables-Dimensions
(2
nd
order)
Original
Sample
(
O
)
Standard
Error
(
STERR
)
T Statistics
(|O/STERR|)
Concl
usion
MARKET
ATTRACTIVENESS ->
Intensit
y
0.894 0.018 49.306 Valid
MARKET
ATTRACTIVENESS ->
Market Access
0.965 0.006 162.779 Valid
MARKET
ATTRACTIVENESS -
>Market forces
0.954 0.009 105.485 Valid
VALUE CREATION ->
Business Partner
0.679 0.082 8.255 Valid
VALUE CREATION ->
Business domain
0.911 0.020 45.789 Valid
VALUE CREATION ->
Customer benefit
0.883 0.020 44.170 Valid
PERFORMANCE ->
Market share
0.551 0.133 4.158 Valid
PERFORMANCE ->
Profitability
0.953 0.008 112.319 Valid
PERFORMANCE -> Sales 0.890 0.023 38.195 Valid
The value of loading factor was > 0.5, meaning
that the indicator was a valid mesurement for latent
variables in second order.
4.1.2 Evaluation of Structural Model (Inner
Model)
The evaluation of inner model was tested in three
ways, namely R
2
, Q
2
and GoF. According to Chin
(1998), the value of R
2
amounted to 0.67 was
categorized as strong, 0.33 as medium, and 0.19 as
weak. The Q
2
value of 0.02 was categorized as minor,
0.15 as medium, and 0.35 as large, and they were only
used for the endogenous construct with reflective
indicator. The value of GoF was considered small if
it was < 0.1, medium if it was 0.1-0.25, and large if it
was > 0.38 (Tenenhaus, 2004).
Table 4: Inner Model Test
Variable R
2
Q
2
GoF
PERFORMANCE 0.541 0.434 0.487
MARKETATTRACTIVENESS 0.450
VALUECREATION 0.431
Table 4 depicted that the R
2
value of company
performance as endogenous variables were in the
medium criteria (> 0.33), and Q
2
values were in the
large criteria (> 0.35), and GoF was in the large
criteria (> 0.35). Therefore, it could be concluded that
the research model was supported by the empirical
condition, so that the model was fit.
Based on the test results of R
2
, Q
2
and GoF, the
resulting model could be considered as robust.
The Effect of Market Attractiveness and Value Creation on the Performance of Fertilizer Companies in Indonesia
527
Therefore, the hypothesis testing was able to be
conducted.
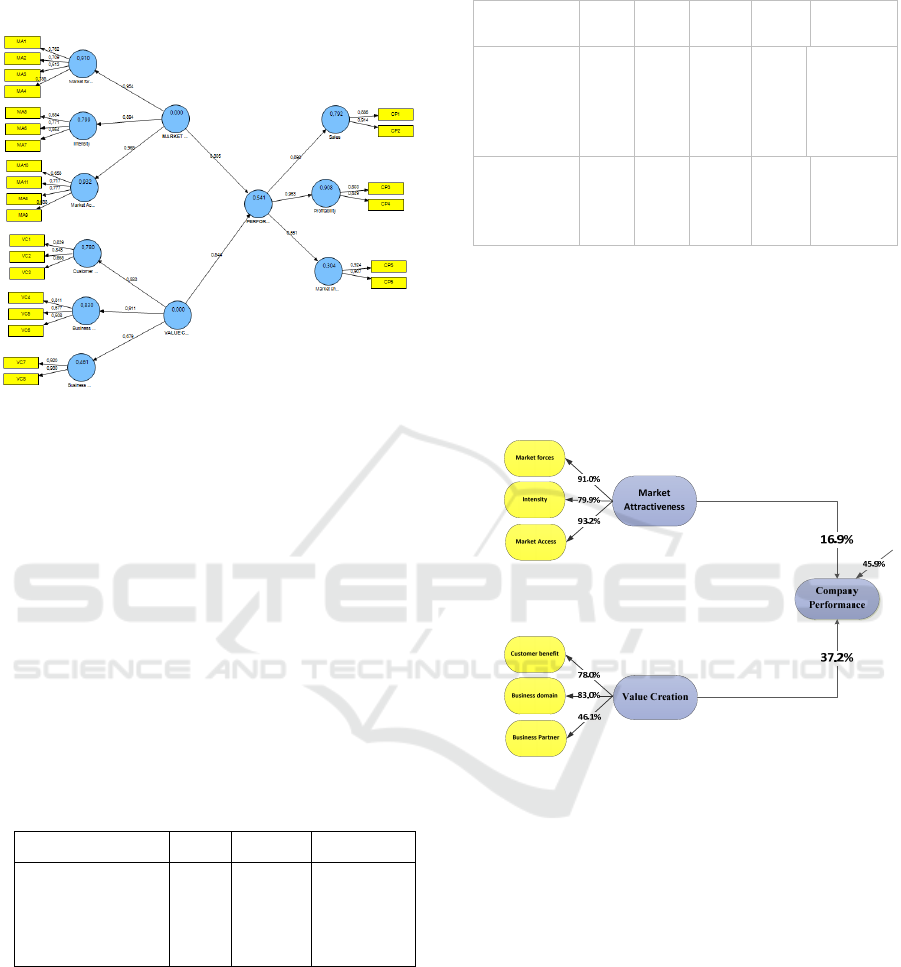
Figure 1: Complete path diagram the of research model
Based on the research framework, then the
structural model obtained was:
η
1
= 0.305
1
+ 0.544
2
+
1
η
1
= company performance
1
= market attractiveness
2
= value creation
1
= Residual
4.2 Hypothesis Testing
Table 5 presents the results of hypothesis testing both
simultaneously and partially.
Table 5: Simultaneous Testing of Hypothesis
Hypothesis R
2
F Conclusion
Market
Attractiveness and
Value Creation ->
Performance
0.541 30.667* Hypothesis
accepted
*significant at =0.05 (F
table
=3.175)
Table 5 depicted that there was simultaneous
influence of market attractiveness and value creation
on company performance amounted to 54.1% with
degree of confidence of 95% (=0.05), while the rest
of 45.9% was affected by other factors not examined
in this research.
Table 6: Partial Testing of Hypothesis
Hypothesis
SE
()
t R
2
Conclusi
on
Market
Attractiven
ess ‐>
Performan
ce
0.30
5
0.09
6
3.16
1*
0.16
9
Hypothes
is was
accepted
Value
Creation ‐>
Performan
ce
0.54
4
0.08
5
6.38
2*
0.37
2
Hypothe
sis was
accepte
d
*significant at = 0.05 (t
table
=1.68)
Partially, market attractiveness and value creation
had a significant influence on company performance, in
which value creation had a greater influence
(R
2
=37.2%).
Based on the results of the hypothesis testing, then the
research findings are described as follows.
Figure 2 : Research Findings
The hypothesis testing results revealed that
market attractiveness and value creation had an effect
on company performance, thus the hypothesis was
accepted. The results of statistical tests showed that
value creation had a greater influence than market
attractiveness on the achievement of company
performance in the fertilizer industry in Indonesia.
Value creation was formed by three dimensions,
namely customer benefits, business domains, and
business partners. From these dimensions, the
business domain had the highest influence (83%),
followed by customer benefits (78%), and business
partners (46.1%). Business domains were related to
the creation of distinctive product characteristics
compared to competitors, the creation of standards for
on-time and delays, and an increase in the company's
understanding of product trends in the future. These
EBIC 2019 - Economics and Business International Conference 2019
528

aspects had the highest implications in improving the
performance of fertilizer companies in Indonesia. The
second dimension that supported the achievement of
business performance was customer benefits relating
to the creation of product variations, the creation of
additional benefits, and the improvement of quality
standards. Meanwhile, the creation of business
partners' value was related to the creation of
partnerships with customers and business networks
with competent parties.
Market attractiveness was formed by three
dimensions, namely market forces, competitive
intensity, and market access. From these dimensions,
market access had the highest influence (93.2%),
followed by market forces (91%), and competitive
intensity (79.9%). These results illustrated that the
achievement of company performance produced by
companies were able to adapt market attractiveness,
especially in terms of market access aspects.
Adaptation of market access was mainly related to the
condition of the customer, the extent to which the
customer recognizes the company's products,
distribution channels, and the company's
understanding of product trends. The introduction of
market attractiveness also needed to be supported by
adaptation of market forces and competitive intensity.
Market forces were related to market coverage,
market growth, market forces, and market
characteristics. Meanwhile competitiveness is related
to the growth in the number of competitors, price
competition, and the quality of substitute products.
These aspects support the companies’ efforts to
analyze the extent to which the attractiveness of the
market in the fertilizer industry as an appropriate
strategy for winning the competition so as to produce
optimal company performance.
The research results revealed that company
performance was dominantly formed by value
creation, which was supported by the adaptation of
market attractiveness. The results of this research
supported the findings of Sanchez et al. (2010), which
showed that producer organization learning was a
direct factor to the positive ability of customer value
creation, which was understood from a functionalist
perspective that directly enhanced the business
performance of producers. In addition, Rodgers
(2010) found that corporate value creation affected
performance gaps, which were explained by seven
organizational variables focuses on the entire
organization consisting of vision, mission, core
values, goals, strategies, organizational flexibility and
risk; and Ju & Zhao (2009) found that the intensity of
industrial competition positively moderated the
influence of slack organizations on performance.
5 CONCLUSION AND
RECOMMENDATION
The hypothesis testing results revealed that market
attractiveness and value creation had an effect on
company performance, thus the hypothesis was
accepted. The results of statistical tests showed that
value creation had a greater influence than market
attractiveness on the achievement of company
performance in the fertilizer industry in Indonesia.
The results of this research have implications for
the management of fertilizer companies in Indonesia
that struggle to improve company performance are
based on the development of value creation which is
supported by the adaptation of market attractiveness.
Value creation development is prioritized on the
business domain aspect, followed by development in
the aspects of customer benefits and business
partners. Business domains are related to the creation
of distinctive product characteristics compared to
competitors, the creation of standards for meeting on-
time delivery, and increasing the company's
understanding of product trends in the future.
Meanwhile, market attractiveness adaptations are
prioritized on aspects of market access, followed by
adaptation to aspects of the market forces, and
competitive intensity. Adapting market access is
emphasized in aspects of customer conditions, the
extent to which customers recognize company
products, distribution channels, and the company's
understanding of product trends.
REFERENCES
Best, R. J. (2013). Market-Based Management: Strategies
for Growing Customer Value and Profitability (6th
Edition). London, England: Pearson Education.
Bowman, C., & Ambrosini, V. (2000). Value Creation
Versus Value Capture: Towards a Coherent Definition
of Value in Strategy. British Journal of Management,.
11, 1–15.
David, F. R. (2013). Strategic Management, Concepts &
Cases. London, England: Pearson Education , England.
Fonseka, M., Wang, P. & Manzoor, M. S. (2013). Impact
of human resource slacks on firm performance:
Evidence from a developing country. Zbornik Radova
Ekonomski Fakultet u Rijeka, 31(2), 279-306.
Hassabelnaby, H., Hwang, D. & Vonderembse, M. A.
(2012). The impact of ERP implementation on
organizational capabilities and firm performance.
Benchmarking: An International Journal, 19(4/5),
Hubbard, G. & Beamish, P. (2011). Strategic Management
- Thinking, Analysis, Action. Australia: Pearson, 4
th
Edition
The Effect of Market Attractiveness and Value Creation on the Performance of Fertilizer Companies in Indonesia
529

Irawan, Setyorini, D. & Rochayati, S. (n.d.). Proyeksi
Kebutuhan Pupuk Sektor Pertanian Melalui Pendekatan
Sistem Dinamis [PDF file]. Retrieved from
http://balittanah.litbang.pertanian.go.id/ind/dokumenta
si/lainnya/09%20-%20Irawan%20et%20al%20-
%20Proyeksi%20Kebutuhan%20Pupuk%20Sektor%2
0Pertanian%20Melalui%20Pendekatan%20Sistem%2
0Dinamis.pdf?secure=true
Ju, M. & Zhao, H. (2009), Behind organizational slack and
firm performance in China: The moderating roles of
ownership and competitive intensity. Asia Pacific
Journal of Management, 26(4),701-717.
Kotler, P. & Keller, K. L. (2012) Marketing Management.
14e, Global Edition, Pearson Education Limited
Kotler, P. & Keller, K. L. (2016) Marketing Management.
Global Edition, Pearson.
Malhotra, N. K. (2010). Marketing Research an Applied
Orientation. Prentice Hall.
Rodgers, D. (2010). Vision-to-value creation: A balanced
fit strategic dynamic capabilities process. ProQuest,
UMI Dissertation Publishing.
Sekaran, U., & Bougie, R. (2010). Research methods for
business A skill-building approach (5th ed.).
Haddington John Wiley & Sons.
Tenenhaus, M., Amato, S. & Vinzi, V. E. (2004) A global
Goodness-of-Fit index for PLS [PDF File]. Retrieved
from
https://pdfs.semanticscholar.org/cfdb/0d4ec08d6eb472
1787c795c092b36cb3805f.pdf
Walker, O., Mullins, J. & Boyd, H., Jr. (2011), Marketing
Strategy: A Decision-Focused Approach (8th Edition).
Business and Economics.
Wheelen, T. L. & Hunger, D. J. (2012). Strategic
Management and Business Policy, Towards Global
Sustainability (13
th
Edition). Pearson.
Wheelen, T. L., Hunger, D. J., Hoffman, A. N. & Bamford,
C. E. (2015). Strategic Management and Business
Policy: Globalization, Innovation, and Sustainability,
14
th
Edition. Global Edition, Pearson.
EBIC 2019 - Economics and Business International Conference 2019
530
