
The Influence of Capital Structure, Profitability, and Company Size
on Firm Values in Manufacturing Companies Listed on the Indonesia
Stock Exchange
Thomas Sumarsan Goh and Melanthon Rumapea
Department of Accounting, The University of Methodist Indonesia, Jl. Hang Tuah No. 8, Medan, Indonesia
Keywords: Capital Structure, Profitability, Company Size, Firm Values
Abstract: The value of the company is achieved when an investment generates a rate of return that is greater than the
investment risk. By increasing the value of the companies, shareholders’ value will also increase, which is
indicated by the high return on investment to shareholders. Several factors that can influence firm values are
capital structure, profitability, and the size of the companies. Financial risk is a risk that affects the financial
aspects of the company. And market risk is the risk that occurs due to business competition with the emergence
of potential new competitors in the market of the same product. The population of the study was 61 and 12
companies were selected to be the samples through purposive sampling technique. The data were analyzed
by using descriptive statistics technique. From the results of the study, it can be concluded, that capital
structure has a significant effect on firm value, but has a negative coefficient direction. Even though the capital
structure of a company has decreased, but the value of the company may not necessarily decline. Profitability
has a positive and significant effect on firm value, and firm size has a positive and significant impact on firm
value. Capital structure, profitability, and company size simultaneously have a significant impact on firm
value.
1 BACKGROUND
1.1 Background of the Problem
The main goal of the company is to maximize
shareholders’ value. Thus managements find ways to
increase the value of the company. So, the company
needs to ensure that the value of the company grows
sustainably. The cost of the company is achieved
when an investment generates a rate of return that is
greater than the investment risk. At the simplest level,
all leads to the investors or shareholders. This group
of people have risk factors within the company
because they contribute their values to the company
in the hope that they can get returns.
So it is essential for companies’ need to improve
their financials to attract new investors or make
investment decisions. This is the main thing for some
companies to increase their corporate values. By
increasing the value of the companies, shareholders’
value will also increase, which is indicated by the
high return on investment to shareholders. Several
factors that can influence company values are capital
structure, profitability, and the size of the companies.
According to Agus (2010: 240), capital structure
is a comparison or balance of long-term funding of
the company as indicated by the similarity of long-
term debt to own capital. Capital structure shows the
use of debt to finance its investment, so that by
knowing the company's capital structure, investors
can find out the balance between the risk and return
on investment. The purpose of capital structure
management is to combine the sources of funds used
by the companies to finance the operations. In other
words, this goal can be seen as a combination of funds
that will minimize the cost of capital and maximize
the value of the company.
The most important thing for a company is how
the profit can maximize the wealth of the
shareholders rather than how much profit the
company makes (Santy Kusumaningrum: 2016).
According to Ferry and Jones (2001), the size of
the company is as indicated by total assets, total sales,
average of total sales, and proportion of total assets.
The size of the company has dramatically influenced
446
Goh, T. and Rumapea, M.
The Influence of Capital Structure, Profitability, and Company Size on Firm Values in Manufacturing Companies Listed on the Indonesia Stock Exchange.
DOI: 10.5220/0009216104460456
In Proceedings of the 2nd Economics and Business International Conference (EBIC 2019) - Economics and Business in Industrial Revolution 4.0, pages 446-456
ISBN: 978-989-758-498-5
Copyright
c
2021 by SCITEPRESS – Science and Technology Publications, Lda. All rights reserved

the ability of the company to obtain a loan. Large
companies have significant funding needs to finance
the operation activities of the companies. Large
companies are more comfortable to get loans than
small companies. However, large companies have
more significant risks compared to smaller
companies, such as financial risk and market risk.
Financial risk is a risk that influences the financial
aspects of the company. And market risk is the risk
that occurs due to business competition with the
emergence of potential new competitors in the market
of the same product.
Firm’s size is the size of assets owned by the
company. Firm size is also an indicator that shows the
company's financial strength. So, the size of the firm
is considered to be able to influence the value of the
company, because the larger the size of the company,
the company is more comfortable to obtain funding
from both internal and external.
This research was conducted at manufacturing
companies listed at the Indonesia Stock Exchange
(IDX). A manufacturing company is a processing
industry company that processes raw materials into
semi-finished goods or finished goods which have
higher added value. In manufacturing companies,
there are three sectors, namely the essential industrial
and chemical sectors, various industrial sectors, and
the consumer goods industry sector. However, in this
article, the researcher put the limit in the research to
only study the essential industrial and chemical
sectors in manufacturing companies listed at the
Indonesia Stock Exchange.
Several studies have been conducted to analyze
the factors that can affect the value of the firm whose
results are in line or adverse. These studies include
those conducted by Nunung Nur Hanifah (2016)
showed that partially, the capital structure has
effected positively and not significantly on firm’s
value. While company growth, company size, and
profitability have impacted positively on firm’s value.
Simultaneously, capital structure, the company’s
growth, the company’s size, and profitability have
impacted positively and considerably on the firm’s
value. Based on the research of Santy
Kusumaningrum (2016) has shown that
simultaneously, all the independent variables of
capital structure and profitability have influenced
positively and significantly on firm’s value. And
based on research conducted by Ayu Sri, et al. (2013),
it showed that the capital structure has effected
negatively and significantly on firm’s value,
profitability had influenced positively and
significantly on the firm’s value, and firm size did not
affect firm’s value.
Based on the inconsistency of the above results of
several studies, therefore the researchers carried out
further research which would be able to provide more
adequate results with data that was more relevant to
current conditions.
Since the beginning of 2017, the primary and
chemical industry sectors on the Indonesia Stock
Exchange (IDX) have recorded high growth. The
primary and chemical industry sectors had recorded
growth of 17.08% year to date. This has made this
sector the second-most top growth sector after the
growth of financial industy of 29.18 year to date.
1.2 Identification of Problems
Based on the background of the above problem, the
problem identifications in this study are:
1. The value of the firms have not been stable.
2. The purpose of the company is to increase the
value of the company has not been achieved
effectively and efficiently.
1.3 Problem Formulation
Based on the description of the background and
identification of the above problem, the formulation
of the problems in this study are:
1. Does the capital structure partially influence the
value of the firm?
2. Does profitability have a partial influence on the
value of the firm?
3. Does the size of the company partially influence
the value of the firm?
4. Does the capital structure, profitability, and size
of the company influence simultaneously the
value of the firm?
1.4 Research Objectives
Based on the formulation of the problem above, the
objectives of this study are:
1. To test and analyze the effect of capital structure
on the value of the firm.
2. To test and analyze the effect of profitability on
the value of the firm.
3. To test and analyze the effect of company size on
the value of the firm.
4. To test and analyze the effect of capital structure,
profitability, and firm size on the value of the
firm.
The Influence of Capital Structure, Profitability, and Company Size on Firm Values in Manufacturing Companies Listed on the Indonesia
Stock Exchange
447

2 LITERATURE STUDY
2.1 Agency Theory
Agency theory describes the relationship between
shareholders as principals and management as agents.
Jansen and Meckling in Okky (2015:16) explain that
agency relations is agency relationship, a contract
under which one or more person (the principals)
engage another person (the agent) to perform some
service or their behalfs which involve delegating
some decision making authority to the agents.
Potential agency problems occur when the
manager's share of the company is less than one
hundred percent (Okky, 2015:17). The proportion of
ownership that only a part of the company makes
managers tend to act for personal interests and not to
maximize the company. This will cause agency costs.
The presence of managerial ownership can be
used to reduce the agency cost that has the potential
to rise, because by owning the shares of the company,
it is expected that the manager feels the benefits
directly from each decision taken.
2.2 Signal Theory
Signal theory is based on the assumption that the
information received by each party is not the same. In
other words, signal theory is related to information
asymmetry, which is what happens if one party from
a transaction has more or better information than the
other party.
If the information contains positive things, it is
expected that the market will react when the market
receives the announcement. A change in stock prices
indicates the market reaction at the time the
information is announced, and all market participants
have received the information. Whereby, external
parties will analyze the data as a good signal or a
wrong signal. If the announced information is a good
signal for external parties, then there will be an
increase in stock prices (Okky, 2015: 10). The profit
that is reported by the company can indicate the good
or bad condition of the company.
2.3 Financial Reports
2.3.1 Definition and Purpose of Financial
Statements
In simple terms, Keown (2004) defines financial
statements are reports that show the company's
financial statements at this time or in a certain period.
The purpose of the financial report that shows the
current condition of the company is the current
condition.
Financial statements describe the company's
economic posts obtained from a period. In practice,
several types of business reports are known, such as;
balance sheet, income statement, statement of
changes in equity, notes to financial statements, and
cash flow statement.
According to Kasmir (2015: 10), there are several
objectives of the preparation of financial statements,
namely:
1. Provide information about the type and amount of
assets held by the company;
2. Provide information about the type and amount of
liabilities and capital owed by the company;
3. Provide information about the type and amount of
income obtained in a given period;
4. Provide information about the amount of costs
and types of expenses incurred by the company in
a certain period;
5. Provide information about changes that occur to
assets, liabilities, and capital;
6. Provide information about the performance of the
company’s management in a period;
7. Provide information about the notes to the
financial statements; and other financial
information.
2.3.2 Analysis of Financial Statements
After the financial statements are prepared based on
relevant data and carried out the correct accounting
procedures and valuations, the actual financial
condition of the company will be seen. The financial
situation is known as how many assets, liabilities, and
capital in the balance sheet. Then it will also see the
income received and the amount of costs incurred
during specific periods. Thus, it can be understood
how are the results of the business obtained during a
certain period of income statement are prepared.
2.3.3 Value of the Firm
The value of the firm can reflect the value of assets
owned by companies such as securities. Stock is one
of the securities issued by the company. Financial
conditions influence the high and low of the stock
prices. The value of the firm is an investor's
perception of the level of success of the company that
is closely related to its stock price (Hermuningsih,
2013 : 131). High stock prices make the value of the
firm high and increase market confidence not only in
the company's current performance, but also in the
company's prospects. The stock price generally refers
EBIC 2019 - Economics and Business International Conference 2019
448

to the closing price and is the price that occurs when
the stock is traded on the market (Situmorang, 2016 :
14).
There are several methods that have been used to
measure the value of a firm, such as Price Earning
Ratio (PER), Price to Book Value (PBV), and Tobin’s
Q. Price-earnings ratio serves to measure changes in
future expected earnings ability.
Price-earnings ratio is one of the most significant
measures in fundamental stock analysis and part of
the valuation ratio for evaluating financial statements.
Price-earnings ratio is useful to see how the market
appreciates the performance of a company's stock on
company performance reflected in earnings per share.
Price-earnings ratio shows the relationship between
average stock market prices and profits per share.
Price-earnings ratio (PER) is a fundamental
analysis technique with the value of shares and
compares it with the price of shares per sheet with
profits generated from each share. According to
Brigham and Houston, the formula for calculating
PER is:
Price stock
Price-earnings ratio (PER) =
Earning per share
Companies with low growth usually have a low
PER. Besides that, it can also mean that the higher the
PER allows the market price of each share to be
better, and vice versa.
Price-earnings ratio is also a measure to determine
how the market member values a company's stock.
Firms with high growth rates usually have a high
PER, and vice versa, companies with low growth
rates, have a low PER.
2.3.4 Capital Structure
Agus (2010 : 248) states that to determine the optimal
capital structure, finance managers need to consider
several important factors such as: level of sales, asset
structure, the growth rate of the company,
profitability, profits in tax protection, company scale,
and internal corporate and macroeconomic
conditions.
The term gearing is used to describe the mix of
loan finance and equity finance in a company
(Weetman, 2011 : 348). Debt to equity ratio is the
ratio that uses debt and capital to measure the ratio.
The Debt to equity ratio is a ratio used to measure the
level of debt usage against the company's total
shareholder equity. Then the formula used is:
Total Liabilities
Debt to equity ratio (DER) = x100%
Total Capital
The debt to equity ratio can provide an overview of
the capital structure owned by the company, so that
the level of risk of uncollectible liability can be seen.
2.3.5 Profitabilities
The profitability of a company shows a comparison
between profit and assets or capital that produces the
benefit. According to Brealey, Myers, and Marcus,
the income statement measures the profitability of the
company during the year (2012 : 74). In other words,
profitability is the ability of a company to generate
profit. Company profitability concerns the ratio of
increasing company profits.
The measurement of profitability ratios can be
done with a return on assets (ROA). Return on assets
is the ratio between the balance of net income after
tax and the total assets of the company. ROA also
describes the extent of the return on all assets owned
by the company. Return on assets also to measure a
company's ability to generate profits using total assets
and after capital costs are excluded from the analysis.
Thus, the formula is:
Net profit after tax
Return on Assets (ROA) = x 100%
Total asset
ROA is a ratio used to measure the net profit obtained
from the use of assets. In other words, the higher the
rate, the better the productivity of assets in earning net
profits. This will further increase the attractiveness of
the company to investors.
2.3.6 Firm Size
The size of the company is an increase from the fact
that large companies will have a large market
capitalization, a significant book value, and high
profits. Whereas in small companies will have a small
market capitalization, little book value, and low profit
(Ayu Sri, 2013 : 6).
Block, Hirt, and Danielsen states that in
determining the appropriate capital mix, the firm
generally begins with its present capitl structure and
ascertains whether its current position is optimal
(2011 : 342)
Bauman and Kaen classify firm size as
technological, organization and institutional. Thus,
firm size is an indicator that can indicate a condition
or characteristic of a company. Firm size can be
measured by natural logarithm (Ln) on total assets,
with the formula:
Size = Ln on total assets
The Influence of Capital Structure, Profitability, and Company Size on Firm Values in Manufacturing Companies Listed on the Indonesia
Stock Exchange
449

The size of the firm is one of the variables that are
considered to influence the company's decision to
choose the form of funding. The size of the firm will
affect the company's debt policy. Companies that are
large and have a good reputation in the market will
use more debt as a source of funding. This increase in
debt can increase shareholder value.
2.4 Framework of Thinking
The thinking framework is a conceptual model of
how theory relates to various factors that have been
identified as essential problems (Sugiyono, 2012 :
91). The thinking framework in this study can be
described as follows:
Source: Drawn by the researcher
Figure 2.1: Thinking Framework
2.5 Hypothesis
According to Sugiyono (2012 : 96), the hypothesis is
a temporary answer to the research problem
formulation. The assumption in this study are:
H1: The capital structure partially has a significant
effect on the value of the firm listed on the Indonesia
Stock Exchange.
H2: Profitability partially has a significant effect on
the value of the firm listed on the Indonesia Stock
Exchange.
H3: The size of the firm partially has a significant
effect on the value of the firm listed on the Indonesia
Stock Exchange.
H4: The capital structure, profitability, and size of the
firm simultaneously have a significant effect on the
value of the firm listed on the Indonesia Stock
Exchange.
3 CONCEPTS AND THEORIES
3.1 Methods and Types of Research
The research method has used descriptive statistics
research, used to test specific theories by examining
relationships between variables. These variables are
measured so that data consisting of numbers can be
analyzed based on statistical procedures.
3.2 Research Sites
This research was conducted at the primary industrial
and chemical manufacturing companies listed on the
Indonesia Stock Exchange in 2014 - 2017 with the
site www.idx.co.id.
3.3 Research Variables
There are two types of research variables, namely:
1. Independent variable is a variable that value does
not depend on other variables.
2. The dependent variable is a variable that depends
on the value of the independent variable.
3.4 Types and Data Sources
The type of data used in this study is secondary data
which is generally in the form of evidence, records,
or historical reports of the company. The collection of
secondary data sources were obtained from the annual
report of the primary industrial and chemical
manufacturing companies listed on the Indonesia
Stock Exchange (IDX) in 2014 - 2017 by accessing
the IDX website, namely www.idx.co.id.
3.5 Population and Samples
The research population was 61 essential companies
and chemical industry companies listed on the
Indonesia Stock Exchange from eight sub-sectors.
The research sample was 12 companies in 2014 -
2017. The technique of determining the sample is
purposive sampling namely, sampling is made more
accessible by the prescribed criteria.
The criteria of researchers in sampling are:
1. The primary industrial and chemical industry
manufacturing companies on the IDX are still
active and have complete and accessible financial
data from 2014 - 2017.
2. Companies that earn net income every year from
2014 - 2017.
Capital
Structure
The Value of the
Company (Y)
Profitabilities
(X2)
Company Size
(X3)
EBIC 2019 - Economics and Business International Conference 2019
450

3. Companies that use Rupiah as the denominator in
financial statements.
3.6 Data Collection Technique
Data collection techniques are the most important
step in the research, because the main purpose of the
research is to get data (Sunyoto, 2016). Data
collection methods used in this study are; library
research and documentation techniques.
3.7 Variable Measuring Scale
The measurement scale of the variables studied are:
Table 3.1: Variable Measurement Scale
Variable
T
yp
e
Research
Variable
Parameter
Measuring
Scale
Independent
variable
Capital
Structure
(X
1
)
DER = Total
Liabilities x 100%
Total Capital
Ratio
Profitabilities
(X
2
)
ROA = Net profit
after tax x 100%
Total asset
Ratio
Company
Size (X
3)
Size = Ln on total
assets
Ratio
Dependent
variable
The value of
the company
(Y)
PER = Price
Stocks
Earning per
share
Ratio
Source: Authors' results from operational research
variables
3.8 Data Analysis Technique
The data analysis technique used in this study is
quantitative analysis. Quantitative analysis is an
analysis that uses statistical formulas that are adjusted
to the title of the research and formulation of the
problem, to calculate the numbers to analyze the data
obtained (Danang, 2016: 26).
Data analysis method is an analytical method used
to process data to obtain results and make
conclusions.
4 RESULTS AND DISCUSSION
4.1 Overview of Research Objects
In this study, the objects of the study were 61 essential
companies and chemical industry companies listed on
the Indonesia Stock Exchange from eight sub-sectors.
The technique of determining the sample in this study
was purposive sampling. Where there are 61
companies listed on essential industrial and chemical
sector companies and the remaining 12 companies
that meet the requirements. This research was
conducted for four years, from 2014 - 2017.
4.2 Research Results
4.2.1 Descriptive Statistics Test
Descriptive statistical analysis has the objective to
describe all the variables used in this study, based on
the statistics table that shows the measurement of the
mean, minimum and maximum values. The following
shows the results of testing descriptive statistics of
firm value, capital structure, profitability, and firm
size.
Table 4.1: Descriptive Statistics
Descriptive Statistics
N
Minimu
m
Maximu
m
Mea
n
Std.
Deviation
Firms’
Value
4
8
,01 ,18
,086
5
0,04987
Capital
Structure
4
8
,08 ,95
,364
4
0,2572
6
Profitabiliti
es
4
8
,01 ,21
,102
9
0,0509
5
Size of the
Firm
4
8
,12 ,18
,145
6
0,0179
7
Valid N
(listwise)
4
8
Source: Data processed with SPSS 23
From table 4.1, N shows a sample data of 48. The
minimum value of the company value is 0.01, and the
maximum amount is 0.18, and the average cost is
0.0865, and the standard deviation is 0.04987. In the
capital structure, the minimum amount is 0.08, and
the maximum amount is 0.95, and the average amount
is 0.3644, and the standard deviation is 0.25726. On
profitability, the minimum amount is 0.01, and the
maximum amount is 0.21, and the average is 0.1029,
and the standard deviation is 0.05095. At firm size,
the minimum amount is 0.12, and the maximum
amount is 0.18, and the average is 0.1456, and the
standard deviation is 0.01797.
4.2.2 Multiple Linear Regression Analysis
In this study used multiple regression analysis
models, because more than one independent variable,
which are the capital structure, profitability, and size
of the company. The results of multiple regression
analysis are as follows:
The Influence of Capital Structure, Profitability, and Company Size on Firm Values in Manufacturing Companies Listed on the Indonesia
Stock Exchange
451
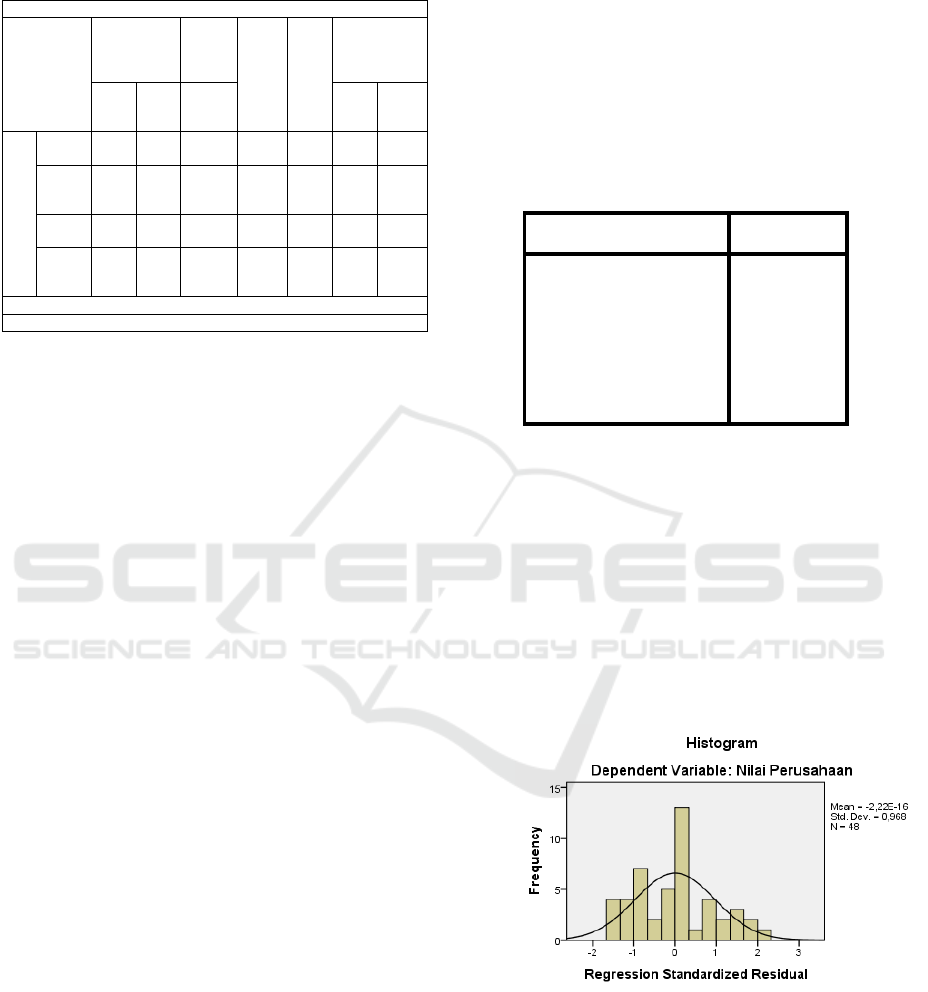
Table 4.2: Multiple Linear Regression
Source: data is processed with SPSS 23
From table 4.2 it showed the multiple linear
regression analysis above, namely:
Firm value = -0.028 - 0.094 capital structure + 0.303
profitability + 0.805 firm size + e
Information:
Y = Firm Value
a = Constant
b = Regression Coefficient
X1 = Capital Structure
X2 = Profitability
X3 = Firm Size
e = Error
The explanation of the results of the regression
analysis above are:
1. The boarding value is 0.028, which means that if
the capital structure, profitability, and size of the
firm are constant, then the firm value will
decrease by 0.028.
2. The capital structure coefficient of -0.94 states
that an increase in capital structure of 1% and
other independent variables remains unchanged,
then the value of the firm will decrease by -0.94.
3. The profitability coefficient of 0.303 states that an
increase in profitability of 1% and other
independent variables remains constant, then the
value of the firm will decrease by 0.303.
4. The coefficient of company size of 0.805 states
that the increase in company size of 1% and other
variables remain constant, then the value of the
firm will increase by 0.805.
4.2.3 Classical Assumption Test
Normality Test. The normality test aims to determine
whether each variable distributes normally or not. A
normality test is needed because to test other
variables by assuming that the residual value follows
a normal distribution. The normality test is carried out
using one Kolmogorov-Smirnov sample.
Table 4.3: Normality Test Results
One-Sample Kolmogorov-Smirnov Test
Unstandardized
Residual
N
48
N
ormal
Parameters
a,
b
Mean ,0000000
Std. Deviation
,03916675
Most
Extreme
Differences
Absolute ,106
Positive ,106
N
egative -,060
Test Statistic ,106
Asymp. Sig. (2-tailed) ,200
c,d
a. Test distribution is Normal.
b
. Calculated from data.
c. Lilliefors Significance Correction.
d. This is a lower bound of the true
significance.
Source: Data is processed with SPSS 23
From the table above, shows that the data have
distributed normally by looking at the Kolmogorov-
Smirnov value of 0.106 and the value of Asymp. Sig.
(2-tailed) 0.200, which is higher (>) than 0.05. The
normality test can also be shown through histogram
images and standard P-P Plot of Regression
Standardized graphs.
Source: Data processed with SPSS 23
Figure 4.1 Histogram
Figure 4.1, shows that the shape of the curve has a
balanced slope, so it can be concluded that the
variable data is distributed normally. Normality can
be detected through residual standard p-p plot of
regression standardized graphs, as shown below.
Coefficients
a
Model
Unstandardiz
ed
Coefficients
Standar
dized
Coeffic
ients
t Sig.
Collinearity
Statistics
B
S
td.
Erro
r
B
eta
Toler
ance
VIF
Constan
t
)
-
,028
,
049
-
,562
,
577
Capital
Structur
e
-
,094
,
024
-
,484
-
3,849
,
000
,
888
1
,126
Profitab
ilities
,
303
,
126
,3
10
2
,397
,
021
,
840
1
,190
Size of
the
Fir
m
,
805
,
378
,2
90
2
,129
,
039
,
755
1
,325
a. De
p
endent Variable: Firms’ Value
EBIC 2019 - Economics and Business International Conference 2019
452

Source: Data processed with SPSS 23
Figure 4.2 Normal P-P Graph Plot of Regression
Standardized Residual
Figure 4.2, has showed that the data spreads around
the diagonal line and follows the direction of the
diagonal line. Thus, the data meet the assumptions of
normality.
Multicollinearity Test. Multicollinearity test aims to
test whether the regression model is found to correlate
with independent variables. A good regression model
should not have a correlation between independent
variables. The general limits used to indicate the
presence of multicollinearity are tolerance values >
0.1 and VIF < 10.
Table 4.4: Multicollinearity Test Results
Coefficients
a
Model
Unstandardiz
ed
Coefficients
Standar
dized
Coeffic
ients
t Sig.
Collinearity
Statistics
B
Std.
Erro
r
Beta
Toler
ance
VIF
(Consta
nt
)
-
,028
,
049
-
,562
,
577
Capital
Structur
e
-
,094
,
024
-
,484
-
3,849
,
000
,
888
1
,126
Profitab
ilities
,
303
,
126
,3
10
2
,014
,
021
,
840
1
,190
Firm
Size
,
805
,
378
,2
90
2
,009
,
039
,
755
1
,325
a. De
p
endent Variable: Firms’ value
Source: Data processed with SPSS 23
From table 4.4, it can be seen that the overall
variable has a tolerant value > 0.1 and VIF value <
10. Thus it can be concluded that the independent
variables of this study are free from multicollinearity.
Heteroscedasticity Test. Heteroscedasticity test is to
test whether in the regression model variance
inequalities occur from residuals to one observation
to another observation remains.
Source: Data processed with SPSS 23
Figure 4.3 Heteroscedasticity Test Results
A good regression model is homoscedasticity, or
heteroscedasticity does not occur. From figure 4.3, it
can be seen that the points spread randomly above and
below the number 0 on the Y-axis and do not form a
clear pattern. So it can be concluded that there is no
problem of heteroscedasticity in the regression
model.
4.2.4 Hypothesis Test
F Test (Simultaneous Test). The F test is carried out
by simultaneously testing, whether all the
independent variables used in the regression model
together can affect the dependent variable. These
testing criteria are:
1. If Fcount > Ftable, then H0 is rejected and Ha is
accepted. This means that there is a significant
influence between the independent variables (X)
together on the dependent variable (Y).
2. If Fcount < Ftable, then H0 is accepted and Ha is
rejected. This means that there is no significant
influence between the independent variables (X)
together on the dependent variable (Y).
Table 4.5: F Test Results (Simultaneous)
ANOVA
a
Model
Sum of
Squares df
Mean
Square F Sig.
Regression ,045 3 ,015 9,113 ,000
b
Residual ,072 44 ,002
Total ,117 47
a. Dependent Variable: Firm Value
b. Predictors: (Constant), Capital Structure, Profitability,
Firm Size
Source: Data processed with SPSS 23
The Influence of Capital Structure, Profitability, and Company Size on Firm Values in Manufacturing Companies Listed on the Indonesia
Stock Exchange
453

Table 4.5 showed that Fcount = 9.113 and Ftable =
2.82 (9.113 > 2.82), meaning that there is a
simultaneous significant influence between the
capital structure, profitability and size of the firm on
the value of the firm. The amount of Sig. Equal to
0,000, which means smaller than 0.05 (0,000 < 0,05),
then the whole independent variables have a
significant effect on the dependent variable.
T-test (Partial Test). The t statistical test aims to
show how far the influence of one independent
variable individually in explaining the variation of the
dependent variable. Decision criteria are:
1. If the significance value is < 0.05, it means that
the independent variable influences the dependent
variable.
2. If the significance value is ≥ 0.05, it means that
the independent variable does not influence on the
dependent variable.
3. If tcount > ttable, then the independent variable
has a significant effect on the dependent variable.
4. If tcount < ttable, then the independent variable
does not have a significant effect on the dependent
variable.
Table 4.6: T-test Results (Partial)
Model
Unstandardized
Coefficient
Standar
dized
Coeffici
ents
T Si
g
.B
Std.
Erro
r
Beta
1 (Constant) ,028 ,049 -,562 ,577
Capital
Structure
-,094 ,024 -,484 -3,849 ,000
Profitabiliti
es
,303 ,126 ,310 2,397 ,021
Firm Size ,805 ,378 ,290 2,129 ,039
Source: Data processed with SPSS 23
The explanation of table 4.6 are as follows:
a. Capital structure has influenced significantly on
the value of the firm because the tcount of -3.849
and ttable of 2.015, the significant value is 0,000
< 0,05 and the direction of the coefficient is
negative, so H1 is accepted.
b. Profitability has a significant effect on the the
value of the firm, as it is shown from the tcount of
2,397 and the table of 2,015, and the direction of
the coefficient is positive, so H2 is accepted.
c. Firm size has a significant influence on the firm
value, since tcount is 2,129 and ttable is 2.015,
and the direction of the coefficient is positive, so
H3 is accepted.
4Determination Coefficient Test. The ratio of
determination (R²) is used to measure how far the
ability of the model in explaining the variation of the
dependent variable. The ratio of determination is
between zero and one (0 ≤ R2 ≤ 1). A small R² value
or close to 0 (zero) means that the ability of
independent variables to explain variations in the
dependent variable is minimal. Values close to 1 (one)
independent variables provide almost all the
information needed to predict differences in the
dependent variable.
Table 4.7: Determination Coefficient Test Results
Source: Data processed with SPSS 23
Table 4.7 shows that the R2 is 0.383, which
means the value is closer to number 0, which means
that independent variables (capital structure,
profitability, and firm size) in explaining the variation
of the dependent variable (firm value) are very
limited. This also shows that company value is
influenced by 38.3% of the variable of capital
structure, profitability, and firm size. While the
remaining 61.7% is influenced by other factors that
are not examined in this study, for example, cash flow
factors, funding decisions, dividend policies,
investment decisions, and so forth.
4.3 Discussion
4.3.1 Effect of Capital Structure on Firm
Valu es
Theoretically, there is an influence of capital structure
on firm value. Where, capital structure policy is
basically a decision in selecting of funding sources
with the type of investment that must be chosen by
the company to be in line with the company's
objective, namely to maximize shareholder welfare.
From the results of the study, it showed that there
was a significant influence between capital structure
on firm value, but with a negative coefficient
direction. In other words, the capital structure has a
negative and significant effect on firm value. Even
though the capital structure of a company has
decreased, but the value of the company may not
necessarily decline. The results of this study are
Model Summar
y
b
Model R
R
Square
Adjusted R
Square
Std. Error of
the Estimate
1 ,619
a
,383 ,341 ,04048
a. Predictors: (Constant), Capital Structure,
Profitabilities, and Firm Size
b
. Dependent Variable: Firms Value
EBIC 2019 - Economics and Business International Conference 2019
454

supported by the research of Ayu Sri Wahatma Dwi
and Ary Wirajaya (2013). But the results of this study
adverse to the research conducted by Santy
Kusumaningrum (2016) and Fifin Syahadatina
(2015), which states that the capital structure partially
has a positive and significant effect on firm value.
From the results of the test, there is a negative and
significant influence between the capital structure on
firm value which indicates that capital structure is not
always a benchmark in increasing the value of the
company. So, in order to increase shareholders’
prosperity, the company does not rely on the level of
capital structure of the company.
4.3.2 Effect of Profitability on Firm Values
Profitability is income minus expenses and losses
during the reporting period. Analysis of profitability
is very important for creditors and investors. For
creditors, are to know the source of interest and
principal payments. While for investors, are to
determine the changes in the value of the firm.
From the results of study showed that profitability
partially has a positive and significant effect on firm
value. The results of hypothesis testing showed tcount
of 2,397 and ttable of 2,015 (2,397 > 2,015), a
substantial amount of 0.021 < 0.05 with a positive
coefficient direction, so H2 is accepted. The result is
supported by previous research, namely by Nunung
Nur Hanifah (2016), Ayu Sri Wahatma Dwi and Ary
Wirajaya (2013), Santy Kusumaningrum (2016) and
Benny Halomoan Situmorang (2016) have shown that
profitability partially has a positive and significant
effect on firm value. But contrary to the research
conducted by Nur Hidayah (2015) which indicates
that profitability partially does not have a substantial
impact on firm value.
From the above results which states that there is a
significant influence between profitability on firm
value which proves that company profitability is a
benchmark in increasing the value of the firm. In this
case, investors must pay attention to the level of
profitability of the company in investing because with
the increase in the profitability of the company, it will
increase stock prices. So that, this can increase the
prosperity of the investors.
4.3.3 Effect of Firm Size on Firm Values
The size of the firm is one of the variables that are
considered to influence the company's decision to
choose the form of funding. The size of the firm will
affect the company's debt policy. Companies that are
large and have a good reputation in the market will
use debt more as a source of funding. The increase in
debt can increase shareholder’s value. This states that
the size of the firm influences the increase in firm
value.
The results also indicate that the size of the firm
influences the value of the firm because it is shown
from tcount of 2,129 and ttable of 2,015 (2.129 >
2.015), with a positive coefficient direction, so that
H3 is accepted. The size of the firm has a positive and
significant effect on the value of the firm. The results
of this study are supported by previous research
conducted by Nunung Nur Hanifah (2016) and Santy
Kusumaningrum (2016). But it is contrary to the
research conducted by Ayu Sri Wahatma Dwi And
Ary Wirajaya (2013), which states that the size of the
firm does not affect the value of the firm.
You (1995), in his paper gives a survey of the
theories of the determinants of firm size and the
distribution of firm sizes, with a special emphasize of
small firms. Thus, firm size is one of the company's
benchmarks in increasing the value of firm. So,
shareholders or investors also need to consider the
size of the firm in investing.
4.3.4 Effect of Capital Structure,
Profitability and Company Size on
Firm Value
Capital structure, profitability and firm size
simultaneously influence the value of the firm
because it shows from Fcount of 9,113 and Ftable of
2,82 (9,113 > 2,82), with a significant amount of
0,000 (0,000 < 0,05). So, to increase the value of the
firm, it is necessary to consider the capital structure,
profitability, and size of the firm.
The results of this test is supported by previous
research, namely by Nunung Nur Hanifah (2016)
with the results that simultaneously capital structure,
company growth, firm size, and profitability have a
positive and significant effect on firm value. Thus,
increasing the capital structure, profitability, and size
of the firm can also increase the value of the firm.
According to Cuong’s (2014) study has shown that
there was triple threshold effect exists between debt
ratio and firm value.
5 CONCLUSION
The purpose of this study is to test and analyze the
effect of capital structure, profitability, and firm size
on firm value. From the results of the study, it can be
concluded, that:
1. Capital structure has a significant effect on firm
value, but has a negative coefficient direction.
The Influence of Capital Structure, Profitability, and Company Size on Firm Values in Manufacturing Companies Listed on the Indonesia
Stock Exchange
455

From the results of the study, it can be concluded
that the high capital structure of a company does
not necessarily increase the value of the firm.
2. Profitability has a positive and significant effect
on firm value. The results of the study showed that
the high profitability of a company can increase
the value of the firm.
3. Firm size has a positive and significant effect on
firm value. The results showed that the size of a
firm affects the increase in the value of the firm.
4. Capital structure, profitability and firm size
simultaneously have a significant effect on firm
value. The results indicated that the level of
capital structure, profitability, and the size of a
firm affect the increase in firm value.
REFERENCES
Agus, R. 2010. Manajemen Keuangan Teori dan Akuntansi.
Yogyakarta: BPFE-Yogyakarta.
Bauman, H.D., and F. R. Kaen. 2013. Firm Size, Employees
and Profitability in U.S. Manufacturing Industries.
Social Science Research Network.
Block, Stanley B., Hirt, Geoffrey A., And Danielsen,
Bartley R., 2011. Foundations of Financial
Management, Fourteenth Edition. New York: Mc
Graw Hill.
Brealey, Richard A., Stewart C. Myers, and Alan J. Marcus,
2012. Fundamentals of Corporate Finance, Eighth
Edition. New York: McGraw Hill Education.
Cuong, Nguyen Thanh, 2014. Threshold Effect of Capital
Structure on Firm Value: Evidence from Seafood
Processing Enterprises in the South Central
Regional of Vietnam. International Journal of
Finance and Banking Studies 3, No. 3.
Dahlan, Sopiyudin. 2012. Ilmu SPSS. Jakarta: Salemba
Medika.
Dewi, Ayu Sri Wahatma. 2013. Pengaruh Struktur Modal,
Profitabilitas dan Ukuran Perusahaan pada Nilai
Perusahaan. Bali: Universitas Udayana (hal. 2-15).
Ferri, Michael G., and Wesley H. Jones. 1979.
Determinants of Financial Structures: A New
Methodological Approach. The Journal of Finance,
Vol. 34, No. 3.
Ghojali, Imam. 2013. Aplikasi Analisis Multivariate SPSS
23. Semarang: BP Universitas Diponegoro.
Hanifah, Nunung Nur. 2016. Analisa Pengaruh Struktur
Modal, Pertumbuhan Perusahaan, Ukuran
Perusahaan dan Profitabilitas terhadap Nilai
Perusahaan Perbankan yang Terdaftar di Bursa
Efek Indonesia Periode 2011-2015. Surakarta:
Universitas Muhammadiyah (hal. 5-15).
Hermuningsih, Sri. 2013. Pengaruh Profitabilitas, Growth
Opportunity, Struktur Modal Terhadap Nilai
Perusahaan Pada Perusahaan Publik Di
Indonesia. Buletin Ekonomi Moneter dan
Perbankan.
Hery. 2009. Akuntansi Keuangan Menengah I. Jakarta: PT.
Bumi Aksara.
____. 2017. Akuntansi Aset, Liabilitas, dan Ekuitas.
Jakarta: PT. Grasindo.
Hidayah, Nur. 2015. Pengaruh Struktur Modal, Ukuran
Perusahaan, Pertumbuhan Perusahaan dan
Profitabilitas terhadap Nilai Perusahaan pada
Perusahaan Asuransi yang Terdaftar di BEI.
Surakarta: Universitas Muhammadiyah (hal. 5-18).
Kamaludin dan Rini. 2012. Manajemen Keuangan Konsep
Dasar dan Penerapannya. Bandung: CV. Mandar
Madu.
Kasmir. 2015. Analisis Laporan Keuangan. Jakarta: PT.
Rajagrafindo Persada.
Keown, Arthur J, et.al. 2004. Financial Management:
Principles and Applications, Tenth Edition. New
Jersey: Prentice Hall.
Kusumaningrum, Santy. 2016. Pengaruh Struktur Modal,
Profitabilitas, Growth Opportunity terhadap Nilai
Perusahaan (Studi Empiris Perusahaan Food and
Beverage yang Terdaftar di Bursa Efek Indonesia
Tahun 2012-2015).Surakarta: Universitas
Muhammadiyah (hal. 5-15).
Okky, Damayanti. 2015. Analisis Pengaruh Laba
Akuntansi dan Komponen Arus Kas Terhadap
Return Saham Perusahaan. Jakarta: Universitas
Mercubuana (hal. 9-19).
Situmorang, Benny Halomoan. 2016. Pengaruh Tingkat
Likuiditas, Solvabilitas dan Profitabilitas terhadap
Nilai Perusahaan Food and Beverage yang
Terdaftar di Bursa Efek Indonesia. Medan:
Universitas Methodist Indonesia (hal. 6-41).
Sugiyono. 2012. Metode Penelitian Pendidikan. Bandung:
Alfabeta
Sunyoto, Danang. 2016. Metodologi Penelitian Akuntansi.
Bandung: PT. Refika Aditama.
Syahadatina, Fifin. 2015. Pengaruh Size dan Struktur
Modal terhadap Nilai Perusahaan yang Dimediasi
oleh Leverage. Surabaya: Sekolah Tinggi Ilmu
Ekonomi Indonesia (hal. 1-15).
Weetman, Pauline, 2011. Financial and Management
Accounting, An Introduction, Fifth Edition.
England: Pearson Education Limited.
You., I. J., 1995. Small Firms In Economic Theory.
Cambridge Journal of Economics, Vol. 19.
EBIC 2019 - Economics and Business International Conference 2019
456
