
Students’ Perception on the Physical Education Learning Process
using the 2013 and KTSP Curriculums of Wonosobo Regency Middle
Schools
Taufan Jannata
1
, Awan Hariono
1
1
Yogyakarta State University, Jl. Colombo No.1, Yogyakarta, Indonesia
Departement of Sport Science, Graduate School
Keywords: Curriculum, Students’ Perception, Physical Education
Abstract: The learning process is the main key to transfer knowledge and value from teachers to students. Good and
effective learning depends on methods and strategies which will lead to the smooth learning process in order
to achieve the learning objectives that have been set. The purpose of this study was to determine the
students' perceptions on physical education learning process using the KTSP and K13 curricula. The
participants of this study are 120 students consisting of 30 students of SMPN 4 Kertek which applies KTSP
Curriculum, and 30 students of SMPN 3 Kalikajar, 30 students of SMPN 2 Selomerto, also 30 students of
SMPN 1 Wonosobo applying 2013 Curriculum. The data were analyzed by using quantitative descriptive
technique. The findings of this study indicate that the students' perceptions on the Physical Education
learning process using K13 curriculum is better because of the learning materials, time management,
learning methods, and given learning motivation.
1 INTRODUCTION
The learning environment created by teachers is very
influential on the learning process and learning
outcomes achieved by students. To create conducive
learning environment, teachers should consider
learning facilities, students’ motivation, learning
time allocation, and learning objectives to be
achieved. According to SDT (Ryan & Deci, 2000),
competence, basic psychology, and autonomy are
very important in improving performance and
motivation in the physical education learning
process at schools. Students have the right to
develop and make choices in the learning process. In
this case, Physical Education is one of the facilities
in schools that aims to make students physically and
mentally healthy (A, Packham, 2019).
In several researches of Stefanou, Perencevich,
DiCintio, and Turner (2004) on teacher autonomy in
class, there are three types of teaching choices to
support the achievement of learning process, namely
cognitive, organizational, and procedural processes.
Cognitive process provides experience to students
and opportunities to assess the learning outcomes
that have been given to the students (Patall, Cooper,
and Wynn, 2010). Organizational process provides
flexibility for students to choose partners in learning
and to group students into small groups that will
ease the delivery of the learning materials. Then,
procedural process gives teachers opportunities to
modify the learning according to the schools’
condition.
In Xiang, Gao, and McBride's (2011) review
conducted on high school students in Hong Kong,
teachers provide cognitive, organizational, or
procedural learning to students. The finding of these
observations shows that the cognitive learning is the
learning process which is most likely to be done.
Then, the students are given a questionnaire to give
an assessment related to the three learning processes.
Education in Indonesia is different from other
countries. In Indonesia, education is regulated in Act
No. 20 of 2003 on the national education system. In
that act, education functions as a means of
developing and forming the characters of students in
order to educate the life of the nation to produce
human beings who believe in God Almighty, and
who are independent, creative, healthy, noble, and
democratic. Education in Indonesia is also regulated
in an educational curriculum. Indonesia has changed
Jannata, T. and Hariono, A.
Students’ Perception on the Physical Education Learning Process using the 2013 and KTSP Curriculums of Wonosobo Regency Middle Schools.
DOI: 10.5220/0009210300490058
In Proceedings of the 3rd Yogyakarta International Seminar on Health, Physical Education, and Sport Science in conjunction with the 2nd Conference on Interdisciplinary Approach in Sports
(YISHPESS and CoIS 2019), pages 49-58
ISBN: 978-989-758-457-2
Copyright
c
2020 by SCITEPRESS – Science and Technology Publications, Lda. All rights reserved
49

the curriculum several times. For now, Indonesia
adheres to the 2013 curriculum (K13) but there are
still many schools adhering to the old curriculum,
namely Kurikulum Tingkat Satuan Pendidikan
(KTSP) or the 2006 curriculum.
The term "curriculum" has several meanings, one
of which is that curriculum is a tool used as a
reference for conducting a learning program (Capuk,
2015). In the Curriculum Development book,
Theory and Practice, it is explained that the
curriculum, as a plan for learning, is something
created and designed for students’ learning. The
curriculum is a container that will determine the
direction of education, so the success or failure of a
country's education depends on the applied
educational policies and curricula. The curriculum is
the spearhead for the implementation of education.
Without a curriculum it is impossible for education
to run well, effectively, and efficiently as expected.
The curriculum is also implemented in order to get a
change in behavior for better learners and obtain the
triumph as expected (Haris, 2016). McDuffie (2018)
indicates that the curriculum has certain
characteristics, namely learning devices. Curriculum
and learning process are two things that are closely
related, and the curriculum is a comprehensive plan
which includes activities and experiences providing
experience to students.
KTSP stands for the Kurikulum Tingkat Satuan
Pendidikan, which is developed in accordance with
the potential of each region, school characteristics,
social culture of the local community, and
characteristics of students (E. Mulyasa , 2007). In
the KTSP curriculum, teachers will be the center of
the teaching and learning process, so students only
receive the transferred knowledge and not the center
of the teaching and learning process including in
physical education lessons. In the KTSP curriculum,
Physical Education lesson only gets a two-hour
teaching allocation in one week. Some parties argue
that this allocation is not enough to meet the goals of
Physical Education lesson.
The latest curriculum in Indonesia is 2013
curriculum (K13). This curriculum is the
development of a pre-existing curriculum, both a
competency-based curriculum that was released in
2004 and an educational unit level curriculum
(KTSP) in 2006 (M. Fadlillah, 2014).
There are four aspects of K13 which become the
goals of education namely attitude, behavior aspects,
skill, and knowledge. In K13, teachers play the role
as facilitators during the teaching and learning
process, so students are the center of the learning
and teaching process. Physical education in K13 also
gets an additional time allocation which is three
learning periods in one week.
Many schools in Wonosobo Regency are still
implementing the KTSP curriculum, but some other
schools have used the K13 curriculum. The
curriculum used in the schools usually adapts to the
ability to administer the teaching and learning
process. The difference in the use of the curriculum
causes differences in the materials and objectives
given by the teachers to students.
In short, this study aims to determine students’
perception on the physical education learning
process using the 2013 and KTSP curricula.
2 METHOD
This research is a descriptive research that aims to
determine students’ perception on the physical
education learning process using the 2013 and KTSP
curricula. The most appropriate method used to
describe data based on perception is descriptive
research (E, Akdemir, 2015). The method used in
this study is survey method and its data were
obtained through questionnaires. Participants in this
study consist of IX grade Junior High School
students in Wonosobo Regency and then the samples
were randomly selected using the random sampling
system. They consist of four different junior high
schools’ students totally 120 students (30 students
from each school).
Participants in this research follow the rules of
the study, filling out questionnaires given without
any assistance from the researcher. Students also fill
in their personal data which consist of the place and
date of birth, gender, class, and origin of school. The
variables in this study consist of two types, namely
the independent variable and the dependent variable.
The independent variable in this study is the
students’ perception on the physical education
learning process using the 2013 and KTSP curricula,
while the dependent variable in this study is physical
education physical education learning process using
the 2013 and KTSP curricula.
The population is the whole subjects of research
to be examined (Suharsini Arikunto, 2006). The
population in this study consists of grade IX students
of junior high schools in Wonosobo regency who
took part in physical education learning using KTSP
and 2013 curricula. Samples are parties or
representatives of the entire population to be studied
(Suharsini Arikunto, 2006). Then, the samples of
this study were randomly selected using random
sampling system. They consist of four different
YISHPESS and CoIS 2019 - The 3rd Yogyakarta International Seminar on Health, Physical Education, and Sport Science (YISHPESS
2019) in conjunction with The 2nd Conference on Interdisciplinary Approach in Sports (CoIS 2019)
50
junior high schools’ students totally 120 students (30
students from each school). The four selected
schools were SMP Negeri 1 Wonosobo, SMP Negeri
2 Selomerto, SMP Negeri 3 Kalikajar, and SMP
Negeri 4 Kertek. Participants in the study followed
the rules throughout the study, which is completing
the questionnaire provided without any guidance or
assistance from the researcher. Learners also fill in
their personal data including the place and date of
birth, gender, class, and school of origin.
The variables in this study consisted of two types
namely the independent variable and the dependent
variable. The independent variable in this study is
the students’ perception on the physical education
learning process using the 2013 and KTSP curricula,
while the dependent variable in this study is physical
education physical education learning process using
the 2013 and KTSP curricula.
This study uses a questionnaire instrument
consisting of 20 questions whose answers begin by
the words always, often, rarely, and never.
2.1 Data Collection
This study uses an instrument in the form of a
questionnaire consisting of 20 questions about how
teachers open physical education lessons, give
materials, provide motivation for students, apply
teaching methods, and manage learning time
allocation. The assessment on the questionnaire
ranges from 1 (never), 2 (rarely), 3 (often), and 4
(always).
The data in this study were collected through
questionnaires given to the ninth grade students of
SMPN 1 Wonosobo , SMPN 2 Selomerto, SMPN 3
Kalikajar, and SMPN 4 Kertek. The students were
given an understanding to answer the questions
truthfully without any intervention from any party.
Each student was given thirty minutes to complete
the given questionnaire.
2.2 Data Analysis
The data of this research were analyzed using
quantitative descriptive analysis and then input to
the SPSS application of independent sample t test.
The independent sample t test is a comparative test
or different test to find out whether there are
differences in the values of the samples that have
been studied. The steps include collecting and
inputting the obtained data from the students’
questionnaires, grouping the results of the students’
questionnaires who take part physical education
learning process using KTSP and 2013 curricula,
doing calculations in the SPSS application to find
out differences in students' perception values, and
describing the results of the numbers from the SPSS
application to describe them.
2.3 Research Result
From the results of questionnaires which have been
distributed to 120 students consisting of 60 students
who attend schools using the KTSP curriculum and
60 students who attend school using the K13
curriculum, the results obtained are mean of 60.73;
median of 60; mode of 56; Standard Deviation of
5.545; maximum score of of 75; minimum score of
47.
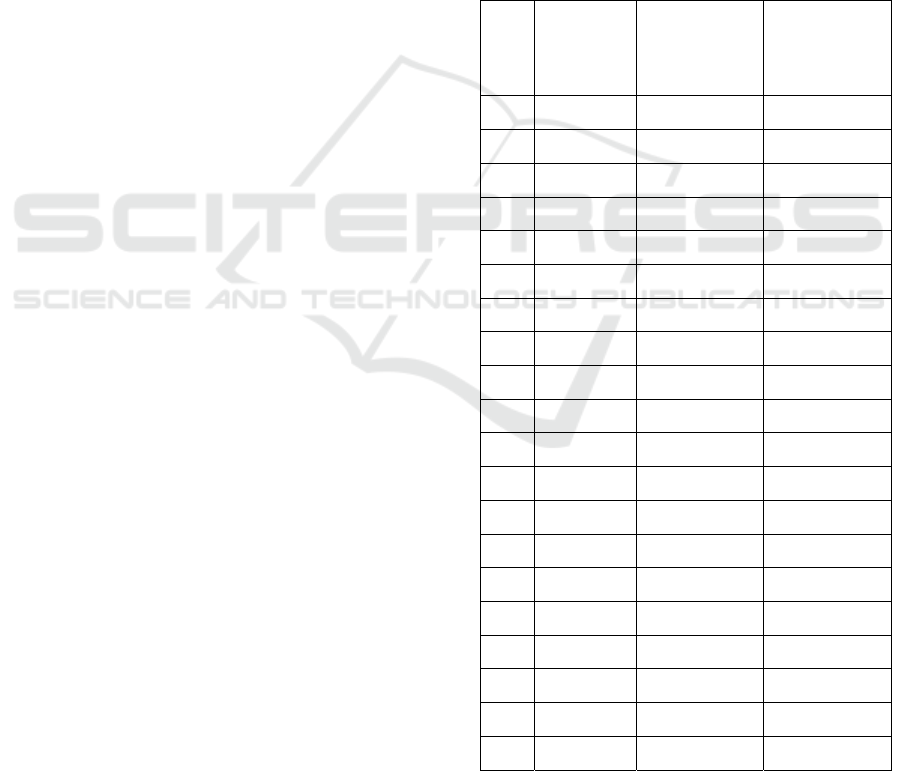
Table 1: The Average Value of the Students’ Perceptions.
No. Question Average
Value on
2013
Curriculum
Average
Value on
KTSP
Curriculum
1 No. 1 3,65 3,16
2 No. 2 3,56 3,26
3 No. 3 3,36 2,63
4 No. 4 3,58 3,25
5 No. 5 3,60 2,96
6 No. 6 3,30 3,28
7 No. 7 2,93 2,75
8 No. 8 2,40 1,75
9 No. 9 3,23 2,95
10 No. 10 2,80 1,81
11 No. 11 3,58 2,91
12 No. 12 3,63 2,96
13 No. 13 3,55 3,15
14 No. 14 3,28 3,31
15 No. 15 3,41 3,25
16 No. 16 3,41 3,30
17 No. 17 3,23 3,30
18 No. 18 3,18 3,18
19 No. 19 3,40 2,21
20 No. 20 3,30 3,18
Students’ Perception on the Physical Education Learning Process using the 2013 and KTSP Curriculums of Wonosobo Regency Middle
Schools
51

From the table above, it can be seen that the
K13 curriculum tends to be better. The average
value is higher than another one.
Table 2: The average score and the criteria of the answer
for question no. 1.
Students’
perception
on 2013
curriculum
Criteria Students’
perception
on KTSP
curriculu
m
Criteria
3,65 always 3,16 often
The average score of the students’ perception
on the teachers when giving examples of movements
in the 2013 curriculum is 3.65 indicating that
teachers always provide examples of movements.
Meanwhile, their perception on the teachers in the
KTSP curriculum scores 3.16 showing that the
teachers often show examples of movements.
Table 3: The average score and the criteria of the answer
for question no. 2.
Students’
perception
on 2013
curriculum
Criteria Students’
perception
on KTSP
curriculum
Criteria
3,56 always 3,26 often
The average score of the students’ perception
on the teachers about providing motivation to
students in the 2013 curriculum is 3.56 indicating
that the teachers always provide motivation to
students. Meanwhile, their perception on the
teachers in the KTSP curriculum scores 3.26
showing that the teachers often provide motivation
to students.
Table 4: The average score and the criteria of the answer
for question no. 3.
Students’
perception
on 2013
curriculum
Criteria Students’
perception
on KTSP
curriculum
Criteria
3,36 often 2,63 rarely
The average score of the students’ perception
on the teachers about paying attention to differences
in students' interest in the 2013 curriculum is 3.36
indicating that the teachers often pay attention to
differences in students' interests. Meanwhile, their
perception on the teachers in the KTSP curriculum
scores 2.63 showing that the teachers rarely see
differences in students' interests.
Table 5: The average score and the criteria of the answer
for question no. 4
Students’
perception
on 2013
curriculum
Criteria Students’
perception
on KTSP
curriculum
Criteria
3,58 always 3,25 often
The average score of the students’ perception
on the teachers about telling the learning objective to
the students in the 2013 curriculum is 3.58
indicating that the teachers always tell the learning
objectives to be done. Meanwhile, their perception
on the teachers in the KTSP curriculum scores 3.25
showing that the teachers often tell the purpose of
learning.
Table 6: The average score and the criteria of the answer
for question no. 5.
Students’
perception
on 2013
curriculum
Criteria Students’
perception
on KTSP
curriculum
Criteria
3,60 always 2,96 often
The average score of the students’ perception
on the teachers about conveying the steps of learning
in the 2013 curriculum is 3.60 meaning that the
teachers always explain the steps of learning. In
another way, their perception on the teachers in the
KTSP curriculum scores 2.96 indicating that the
teachers rarely explain the steps of learning to the
students.
YISHPESS and CoIS 2019 - The 3rd Yogyakarta International Seminar on Health, Physical Education, and Sport Science (YISHPESS
2019) in conjunction with The 2nd Conference on Interdisciplinary Approach in Sports (CoIS 2019)
52
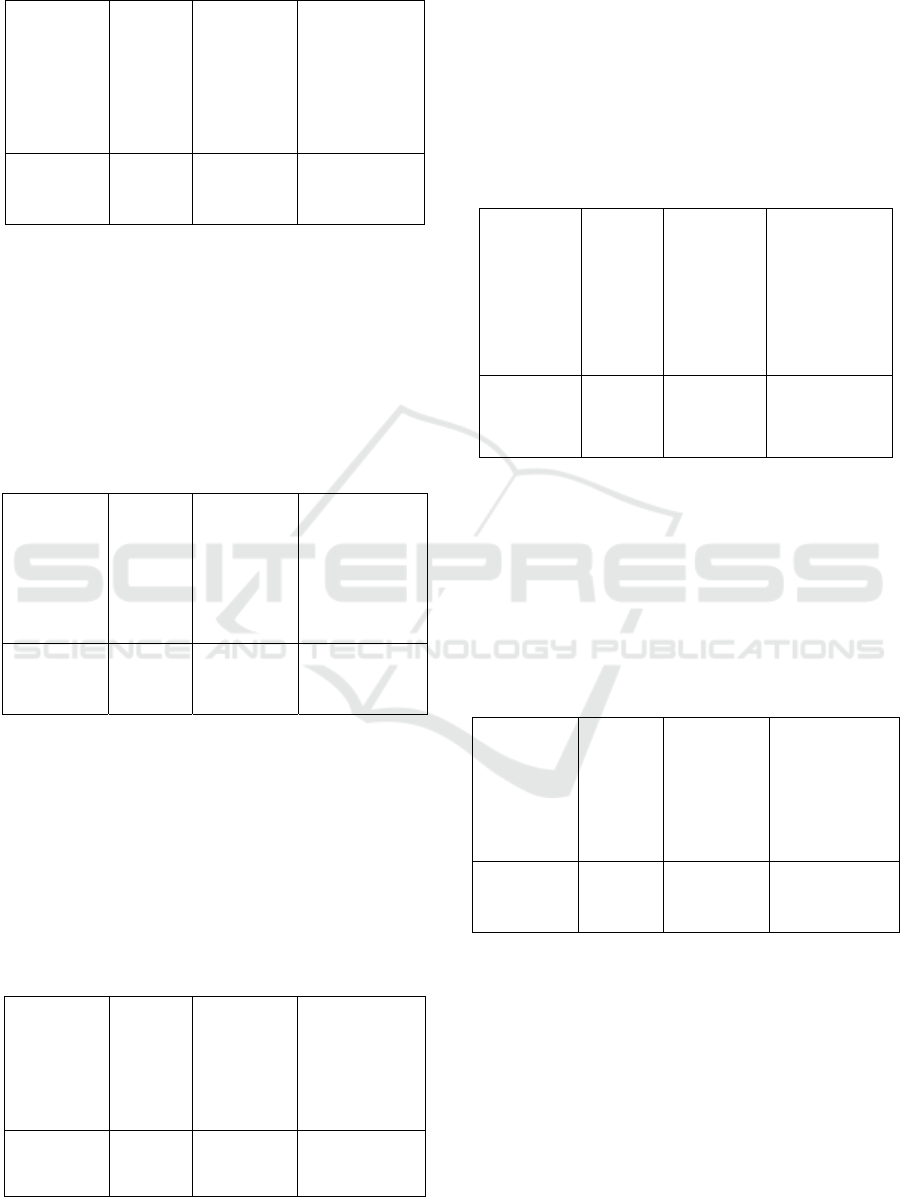
Table 7: The average score and the criteria of the answer
for question no. 6.
Students’
perception
on 2013
curriculum
Criteria Students’
perception
on KTSP
curriculum
Criteria
3,30 Often 3,28 Often
The average score of the students’ perception
on the teachers about reminding the subject matter
of learning material in the 2013 curriculum is 3.60
whereas in KTSP curriculum is 3.28. This indicates
that the teachers in both curricula often remind the
subject matter of learning. However, the ones in the
2013 curriculum score better.
Table 8: The average score and the criteria of the answer
for question no. 7.
Students’
perception
on 2013
curriculum
Criteria Students’
perception
on KTSP
curriculum
Criteria
2,93 often 2,75 often
The average score of the students’ perception
on the teachers about giving questions to the
students in the 2013 curriculum is 2.93 whereas in
KTSP curriculum is 2.75. This indicates that the
teachers in both curricula rarely give questions to the
students. However, the ones in the 2013 curriculum
score better.
Table 9: The average score and the criteria of the answer
for question no. 8.
Students’
perception
on 2013
curriculum
Criteria Students’
perception
on KTSP
curriculum
Criteria
2,40 Rarely 1,75 Rarely
The average score of the students’ perception
on the teachers about using instructional media in
the 2013 curriculum is 2.40 whereas in KTSP
curriculum is 1.75. This indicates that the teachers in
both curricula rarely use instructional media for
teaching and learning process. However, the ones in
the 2013 curriculum score better.
Table 10: The average score and the criteria of the answer
for question no. 9.
Students’
perception
on 2013
curriculum
Criteria Students’
perception
on KTSP
curriculum
Criteria
3,23 often 2,93 rarely
The score 3.23 for the 2013 curriculum in this
point indicates that the teachers often link the
students’ background knowledge on the old
materials to the new ones. Meanwhile, the teachers
rarely do so in the KTSP curriculum proven by its
score 2.93.
Table 11: The average score and the criteria of the answer
for question no. 10.
Students’
perception
on 2013
curriculum
Criteria Students’
perception
on KTSP
curriculum
Criteria
2,80 often 1,81 rarely
The question number ten refers to the
willingness of the teachers to associate physical
education learning materials to the other learning
materials. For 2013 curriculum, the average score is
2.80 indicating that the teachers often associate
physical education learning materials to the other
learning materials. On the other hand, in the KTSP
curriculum, the teachers rarely do so. It can be seen
from its score 1.81.
Students’ Perception on the Physical Education Learning Process using the 2013 and KTSP Curriculums of Wonosobo Regency Middle
Schools
53
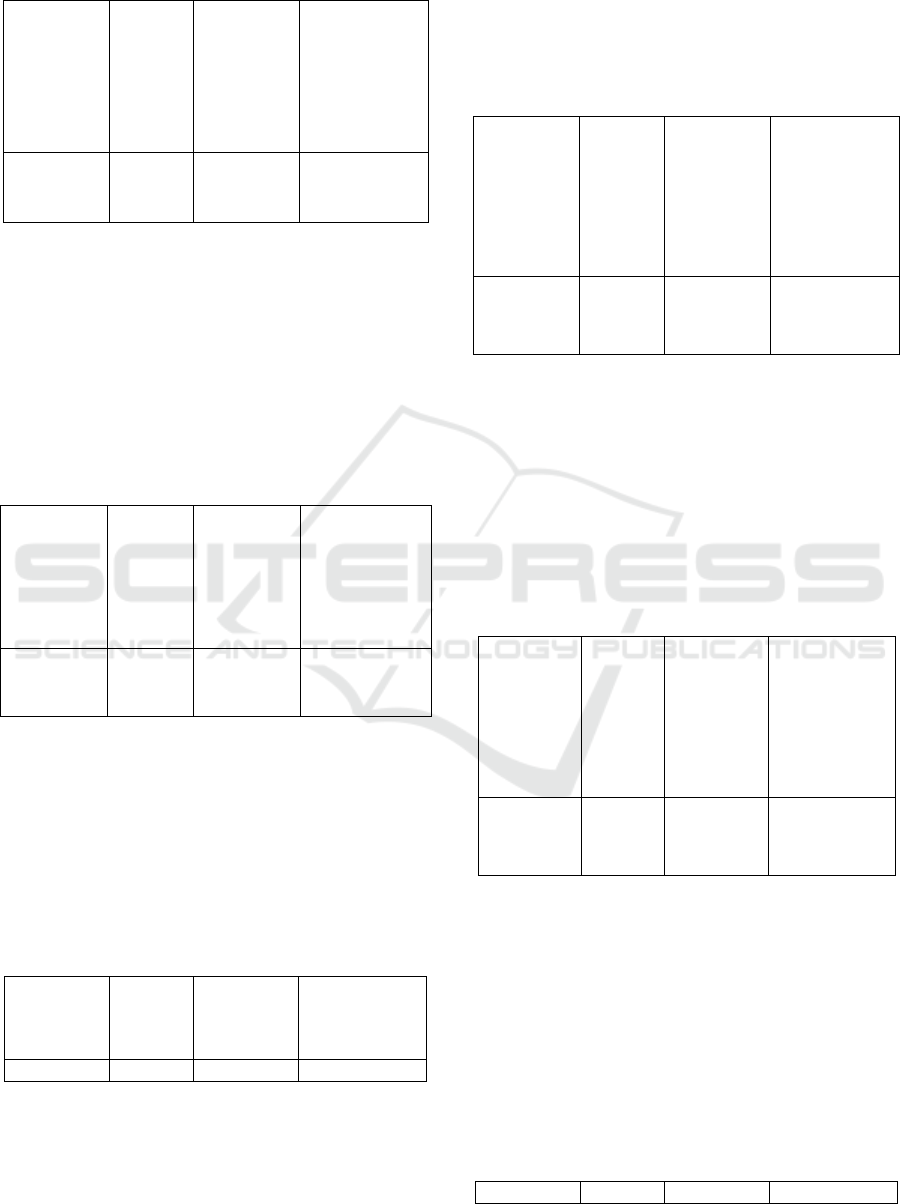
Table 12: The average score and the criteria of the answer
for question no. 11.
Students’
perception
on 2013
curriculum
Criteria Students’
perception
on KTSP
curriculum
Criteria
3,58 always 2,91 often
The question number eleven refers to the
willingness of the teachers to give freedom to the
students. For 2013 curriculum, the average score is
3.58 showing that the teachers always give freedom
to the students. On the other hand, in the KTSP
curriculum, the teachers often do so. It can be seen
from its score 2.91.
Table 13: The average score and the criteria of the answer
for question no. 12.
Students’
perception
on 2013
curriculum
Criteria Students’
perception
on KTSP
curriculum
Criteria
3,63 always 2,96 often
The score 3.63 for the 2013 curriculum in this
point indicates that the teachers always use certain
learning methods in delivering materials to the
students. Meanwhile, the teachers often use the
methods too in the KTSP curriculum proven by its
score 2.96.
Table 14: The average score and the criteria of the answer
for question no. 13.
Students’
perception
on 2013
curriculum
Criteria Students’
perception
on KTSP
curriculu
m
Criteria
3,55 always 3,15 often
By this point, it can be seen that in the 2013
curriculum, the teachers always play the roles as
facilitators not the center of the learning. This
conclusion is drawn by score 3.55. Meanwhile, the
score 3.15 for the KTSP curriculum indicates that
the teachers often play the roles as learning
facilitators, but sometimes sometime still as the
center of learning.
Table 15: The average score and the criteria of the answer
for question no. 14.
Students’
perception
on 2013
curriculum
Criteria Students’
perception
on KTSP
curriculum
Criteria
3,28 often 3,31 often
The average score of the students’ perception
on the teachers about modifying learning activities
in the 2013 curriculum is 3.28 whereas in KTSP
curriculum is 3.31. This indicates that the teachers in
both curricula often modify the learning activities
i.e. by employing some games. However, the ones in
the KTSP curriculum score better.
Table 16: The average score and the criteria of the answer
for question no. 15.
Students’
perception
on 2013
curriculum
Criteria Students’
perception
on KTSP
curriculum
Criteria
3,41 often 3,25 often
The average score of the students’ perception
on the teachers about adjusting the learning
materials to the students’ basic ability in the 2013
curriculum is 3.41 whereas in KTSP curriculum is
3.25. This indicates that the teachers in both
curricula often adjust the materials to the ability of
the students. However, the ones in the 2013
curriculum score better.
Table 17: The average score and the criteria of the answer
for question no. 16.
Students’ Criteria Students’ Criteria
YISHPESS and CoIS 2019 - The 3rd Yogyakarta International Seminar on Health, Physical Education, and Sport Science (YISHPESS
2019) in conjunction with The 2nd Conference on Interdisciplinary Approach in Sports (CoIS 2019)
54

perception
on 2013
curriculum
perception
on KTSP
curriculu
m
3,41 often 3,30 often
The average score of the students’ perception
on the teachers about giving emphasis and repetition
for the learning materials in the 2013 curriculum is
3.41 whereas in KTSP curriculum is 3.30. This
indicates that the teachers in both curricula equally
often emphasize and repeat the learning materials.
However, the ones in the 2013 curriculum score
better.
Table 18: The average score and the criteria of the answer
for question no. 17.
Students’
perception
on 2013
curriculum
Criteria Students’
perception
on KTSP
curriculu
m
Criteria
3,23 often 3,30 often
The average score of the students’ perception
on the teachers about giving appreciation to the
students in the 2013 curriculum is 3.23 whereas in
KTSP curriculum is 3.30. This indicates that the
teachers in both curricula often give appreciation to
the students. However, the ones in the KTSP
curriculum score better
Table 19: The average score and the criteria of the answer
for question no. 18.
Students’
perception
on 2013
curriculum
Criteria Students’
perception
on KTSP
curriculu
m
Criteria
3,40 often 2,10
r
arel
y
There is a significance difference between the
students’ perception on the 2013 curriculum and the
KTSP one regarding the assignments given by the
teachers. The score 3.40 in the 2013 curriculum
indicates that the teachers often give assignments to
the students. Meanwhile, the teachers rarely do so in
the KTSP curriculum shown by its score 2.10.
Table 20: average score and the criteria of the answer for
question no. 20.
Students’
perception
on 2013
curriculum
Criteria Students’
perception
on KTSP
curriculu
m
Criteria
3,30 often 3,18 often
The average score of the students’ perception
on the teachers about managing the learning time
allocation is 3.30 whereas in KTSP curriculum is
3.18. This indicates that the teachers in both
curricula often manage the learning time well.
However, the ones in the 2013 curriculum score
better.
3 DISCUSSION
Based on the data analysis above, it can be seen that
physical education learning using the 2013
curriculum is better than physical education learning
using the KTSP curriculum according to the
perceptions of the appointed students. The
followings are the influencing factors: (1) Learning
materials, Learning materials given in the KTSP
curriculum are mostly not related to the students’
daily life and other learning materials. On the other
hand, in K13 curriculum, the provided learning
materials are more varied because they relate to
other learning materials. In addition, they are also
provided thematically; (2) Time Management,
Proper time management is key to success in
learning (K, B, Nadinloyi: 2013). In the KTSP
curriculum the time allocation given is only 2
learning periods. This greatly affects the teaching
and learning process. Whereas in the K13
curriculum the given time allocation is 3 learning
periods, so that learning process takes place more
effectively. Added to this, good time management
will help someone to maximize the activities to be
carried out (S, A, Malkoc: 2019); (3) Learning
methods, Learning methods used by teachers must
be adapted to the conditions and characteristics of
the students (Y, Li: 2019).
In the KTSP
curriculum, the learning given uses the teacher-
centered method so that if the teachers do not deliver
the learning materials effectively, the students will
not understand the material well. The learning
process in 2013 curriculum uses a scientific and
student-centered method, so that the students are
more active in learning and the learning materials
can be delivered in effective ways. Researchers (N,
A, M, Mokmin: 2015) have proven that students
learn best when there is a personalization in
learning; (4) Giving Motivation, The research shown
that students’ learning motivation will affect on the
students’ learning outcomes.
In the KTSP
curriculum the teachers do not seem to motivate
students to increase their motivation and interest in
learning (M, V, Harsel 2019). Whereas in the K13
curriculum learning process is more manageable and
Students’ Perception on the Physical Education Learning Process using the 2013 and KTSP Curriculums of Wonosobo Regency Middle
Schools
55

giving motivation becomes an important part so that
students are more interested in the materials
provided by the teachers. Providing motivation
during the learning process greatly affects the
learning interest of students (L, Harvey, 2017).
To achieve a good, effective, and efficient
learning process in accordance with the objectives of
national education there are several factors, namely
the factors of learning goals, teachers, students,
teaching activities, materials and evaluation tools,
facilities and infrastructures, and school
environment. Teacher delivery methods are also one
of the factors in the success of physical education
learning in schools (Forey, G, 2019).
The first factor is learning goals. The goal here
is the target to be achieved in teaching and learning
activities. Learning objectives are a description of
abilities or competencies students will have after
joining the learning process. Learning objectives are
usually found in the lesson plans which have been
made by the teachers. In those lesson plans, it is also
explained to achieve the objective, the process
should be carried out through learning activities
created and planned by the teachers too. The purpose
of a learning material is always related to the overall
learning objectives. The purpose of learning is the
main key to how learning will be implemented (M,
Lee, 2019)
The optimal learning outcomes, learning
objectives must be made and studied in such a way
that they are very specific (Arikunto 2008).
However, the fact shows that many teachers only
copy the learning objectives from other teachers.
Therefore, the purpose of education is very difficult
to achieve, because learning objectives are specific
and cannot be equated for each school.
The second factor is related to educators or
teachers. A teacher is a professional teaching staff
whose job is to educate, train, teach, guide, and
evaluate students (Law No.14 of 2003). Apart from
the above assignments, teachers must be able to
become a role model for students. Teachers are
professionals who are experienced in the scientific
field they are engaged in. With the knowledge and
abilities possessed, teachers are expected to be able
to make students knowledgeable and have good
personalities. In addition to the obligation of
teachers to educate students and form students’ good
personalities, good teachers are able to transfer
knowledge and transfer value. The education level
of the teacher is a learning success factor (E, H,
Kwon, 2017).
The next factor is related to students. Students
are the ones who intentionally learn at school by
following a predetermined administrative procedure.
The characteristics of students are very different.
There are those who are quiet, jovial, talkative,
actively creative, and they have different
intelligence. Each student has a favorite subject (Z,
Chen, 2019).
Usually students have subjects that
are liked and disliked. This will greatly affect the
learning outcomes achieved by students. The lack of
students in each class will also influence a success in
learning. Students have different characteristics and
motivation to learn, and it is not possible for all
students to like physical education (L, Y, Li, 2017).
The teacher must have a strategy in order to
optimize the abilities of the students.
The fourth factor is about teaching activities.
The success of learning is also strongly influenced
by learning activities. Good teachers usually have
learning strategies and methods, so that the learning
process will be attractive and make students
enthusiastic about the learning materials provided by
the teacher. Many teachers nowadays do not master
good teaching methods and teaching strategies. In
fact, they only provide one-way learning or using
command methods, so students are not given the
opportunity to be active in the learning process. In
the 2013 curriculum, the teachers are expected to be
facilitators of learning not as the center of learning.
The center of learning in the 2013 curriculum is the
students.
The fifth factor is about materials and
evaluation tools. The evaluation in learning will
greatly influence the achievement of the students. To
get a good evaluation tool, it must contain the
principles of being comprehensive, comparative,
continuous, objective, based on valid criteria, and
functional. In the KTSP curriculum, the learning
evaluation is seen from the final results obtained by
students not the process that has been undertaken by
students. In the 2013 curriculum, the evaluation and
assessment are based on three aspects, namely
attitudes, knowledge, and skills. In physical
education learning, the assessment is more on the
aspect of skills, but in the 2013 curriculum the
assessment is not oriented towards the final results
of the students but the progress or process
experienced by students.
The next factor is about facilities and
infrastructure. Learning facilities and infrastructure
are very important in achieving learning objectives.
Adequate facilities and standard infrastructure will
make the teaching and learning process effective and
will make students more enthusiastic and motivated
to take part in learning. The reality in the field is that
there are still many schools lacking in infrastructure.
YISHPESS and CoIS 2019 - The 3rd Yogyakarta International Seminar on Health, Physical Education, and Sport Science (YISHPESS
2019) in conjunction with The 2nd Conference on Interdisciplinary Approach in Sports (CoIS 2019)
56

The teacher is expected to be able to optimize the
infrastructure available even if it is not in
accordance with the prescribed standards. Many
teachers who are creative make learning fun even
though using makeshift facilities and infrastructure,
but there are still many teachers who cannot
maximize existing infrastructure in schools.
The seventh last factor is the school
environment. A conducive school environment will
lead to the achievement of educational goals and the
success of national education. The school
environment is considered conducive based on
whether or not the school atmosphere supports to
organize the teaching and learning process, the
habits of teachers and students in schools, and the
community around the school.
All the factors above are closely related to the
implementation of learning process to achieve
educational goals. Teachers must pay attention to the
factors which influence the success of learning and
learning objectives. Success in learning does not
come by itself but with careful planning and
alignment between schools, students, teachers, and
parents of students. All of them will be very
influential in achieving learning goals and overall
educational goals
4 CONCLUSION
Based on this research, it can be concluded that
physical education learning using the K13
curriculum is more effective because of several
factors. In this curriculum, the teachers master the
materials more; the learning process is carried out
adjusting to other learning; more time allocation is
provided, teachers play the roles of facilitators; and
teaching media are used properly and effectively.
ACKNOWLEDGEMENT
The author would like to thank all the coaches of
some martial arts college in West Kalimantan
involved and contribute to this preliminary study.
The authors also thank the faculty and the students
of sports science at the Graduate Program,
Yogyakarta State University
REFERENCES
Akdemir, E., Karameşe, E. N., & Arslan, A., 2015.
Descriptive Analysis of Researches on Curriculum
Development in Education. Procedia - Social and
Behavioral Sciences, 174, 3199–3203.
Arikunto, Suharsimi. 2006. Prosedur Penelitian Suatu
Pendekatan Praktik, Rineka Cipta, Jakarta
Arikunto, Suharsimi., dkk. 2008. Penelitian Tindakan
Kelas. Bumi Aksara, Jakarta
Chen, Z., * Liu, Y., 2019. The different style of lifelong
in China and the USA based on influencing
motivations and factors. International Journal of
Educational Research. 95, 13-25.
Fadlillah, M., 2014. Implementasi Kurikulum 2013 Dalam
Pembelajaran SD/MI, SMP/MTS, dan SMA/MA, Ar-
Ruzz Media, Yogyakarta.
Forey, G., & Cheung, L. M. E., 2019. The benefits of
explicit teaching of language for curriculum learning
in the physical education classroom. English for
Specific Purposes, 54, 91–109.
Haris, A., & Ghazali, M. I., 2016. Implementation of
teacher learning in physical education curriculum at
the junior school in makassar, Indonesia. Journal of
Physical Education and Sport, 16(1), 683–687. Harsel,
M, L., & Hoogerheide, V., 2019. Effects of Different
Sequences of Examples and Problems on Motivation
and Learning. Contemporary Educational Psychology.
58, 260-275.
Harvey, L., 2017. Language learning motivation as
ideological becoming. System, 65, 69–77.
Kwon, E. H., & Block, M. E., 2017. Implementing the
adapted physical education E-learning program into
physical education teacher education program.
Research in Developmental Disabilities, 69, 18–29.
Lee, M., & Bong, M., 2019. Relevance of Goal Theories
to Language Learning Research. System, 102122.
Li, L.-Y., & Tsai, C.-C., 2017. Accessing online learning
material: Quantitative behavior patterns and their
effects on motivation and learning performance.
Computers & Education, 114, 286–297.
Li, Y., Zhang, T., Sun, S., & Gao, X., 2019. Accelerating
flash calculation through deep learning methods.
Journal of Computational Physics.
Malkoc, S. A., & Tonietto, G. N. , 2019. Activity versus
outcome maximization in time management. Current
Opinion in Psychology, 26, 49–53.
Mokmin, N. A. M., & Masood, M., 2015. The
Development of Self-Expressive Learning Material for
Algebra Learning: An Inductive Learning Strategy.
Procedia - Social and Behavioral Sciences, 197,
1847–1852.
Mulyasa, E.,2007. Kurikulum Tingkat Satuan Pendidikan
Sebuah Panduan Praktis, PT Remaja Rosdakarya,
Bandung.
Nadinloyi, K. B., Hajloo, N., Garamaleki, N. S., &
Sadeghi, H., 2013. The Study Efficacy of Time
Management Training on Increase Academic Time
Students’ Perception on the Physical Education Learning Process using the 2013 and KTSP Curriculums of Wonosobo Regency Middle
Schools
57

Management of Students. Procedia - Social and
Behavioral Sciences, 84, 134–138.
Packham, A., & Street, B.,2019. The Effects of Physical
Education on Student Fitness, Achievement, and
Behavior. Economics of Education Review.
Patall, E.A., Cooper, H., & Wynn, S.R., 2010. The
effectiveness and relative importance of choice in the
classroom. Journal of Educational Psychology, 102,
896–915.
Republik Indonesia., 2003. Undang-Undang No.14 Tahun
2003 tentang Martabat Guru dan Dosen: Lembaran
Negara RI Tahun 2003, No. 14. Sekertariat Negara.
Jakarta.
Republik Indonesia., 2003. Undang-Undang No.20 Tahun
2003 tentang Sistem Pendidikan Nasional: Lembaran
Negara RI Tahun 2003, No. 20. Sekertariat Negara.
Jakarta.
Roth McDuffie, A., Choppin, J., Drake, C., & Davis, J. ,
2018. Middle school mathematics teachers’
orientations and noticing of features of mathematics
curriculum materials. International Journal of
Educational Research.
Ryan, R. M., & Deci, E. L., 2000. Self determination
theory and the facilitation of intrinsic motivation,
social development, and well-being. American
Psychologist, 55, 68-78.
Stefanou, C.R., Perencevich, K.C., DiCintio, M., &
Turner, J.C., 2004. Supporting autonomy in the
classroom: Ways teachers encourage student decision
making and ownership. Educational Psychologist, 39,
97–110.
Suat, Capuk., 2015. ICT Integration Models Into Middle
And High School Curriculum in The USA. Procedia
Social and Behavioral Sciences.191. 1218-1224.
Xiang, P., Gao, Z., & McBride, R.E., 2011. Student
teachers use of instructional choic in physical
education. Research Quarterly for Exercise and Sport,
82, 482–490.
YISHPESS and CoIS 2019 - The 3rd Yogyakarta International Seminar on Health, Physical Education, and Sport Science (YISHPESS
2019) in conjunction with The 2nd Conference on Interdisciplinary Approach in Sports (CoIS 2019)
58
