
Expert System to Detect Early Depression in Adolescents using DASS 42
Nesi Syafitri, Yudhi Arta, Apri Siswanto and Sonya Parlina Rizki
Department of Informatics Engineering, Universitas Islam Riau, Pekanbaru, Indonesia
Keywords:
Case Based Reasoning, DASS 42, Expert System
Abstract:
Around 5% adolescents in Indonesia suffer from depression at the certain time. To identify the level of
depression, direct consultation with an expert like alienist or psychologist is needed. However, the problem is
the number of experts in hospital and culture social environment is limited, also the society is not used to do
consultation to alienist or psychologist. Therefore, a system that can help the medical to detect early depression
disorder is needed, before the adolescents do the next consultation to the medical. The system called as expert
system with web based which built by Case Based Reasoning (CBR) and using Simple Matching Coefficient
(SMC) method also DASS 42 as the research instrument. Based on the 200 data testing on 500 and 700 case
base, this expert system can detect the early disorder with an precision rate more than 90%. So that, with this
expert system the early disorder can be done accurately and fast.
1 INTRODUCTION
Depression is a mood disorder characterized by loss
of feelings of control and subjective experience of
severe suffering. Depression will cause feelings
of depression (sadness, disappointment, futility),
loss of energy and interest, feelings of guilt,
loss or difficulty concentrating, loss of appetite
to suicidal desires and sometimes self-degrading
behaviour (Faia et al., 2017; Shen et al., 2017).
Depression that is not detected early in adolescents
can eventually lead to serious difficulties in school,
work, and personal adjustment which often continues
in adulthood. To be able to correctly identify the
level of depression experienced by a adolescents,
parents or teachers must consult directly with experts,
both psychiatrists and psychologists. However,
the obstacle is the limited number of psychiatric
experts who are not available in all hospitals and
the sociocultural environment in the community that
is not accustomed to consulting a psychiatrist and
psychologist (Haryanto et al., 2016; Syafitri and
Apdian, 2016; Syafitri and Saputra, 2017).
Expert system is a computer program designed
to solve problems like an expert, by transferring
expertise so that other people (non-experts) can solve
problems that are usually carried out by an expert (Gu
et al., 2017; Rahman et al., 2018). The representation
of knowledge representation using Case Based
Reasoning (CBR) is a collection case-based that has
never happened before. CBR uses solutions from
previous cases that are similar to new cases to solve
problems. Various methods can be used to measure
the level of similarity of old cases with new cases.
One of similarity methods used is Simple Matching
Coefficient (SMC).
Some studies in the domain of expert systems with
CBR used as a reference are research conducted by
Faizal, E (2014) applying CBR to build a system
that has the ability to diagnose cardiovascular disease
based on similarity in previous cases using method
SMC. The test results show that the system built
has a sensitivity value of 97.06%, specificity of
64.29%, positive predictive value (PPV) of 86.84%,
negative predictive value (NPV) of 90.00%, accuracy
of 87.50% with level error (error rate) of 12.50%
(Faizal, 2014; Syafitri and Sari, 2017; Syafitri et al.,
2018).
2 RESEARCH METHOD
Research method is the stages passed by the
researcher to get description of the research. The
stages passed in the research method are follows:
2.1 Data Collection
The data collection techniques needed in making this
system are as follows:
Syafitri, N., Arta, Y., Siswanto, A. and Rizki, S.
Expert System to Detect Early Depression in Adolescents using DASS 42.
DOI: 10.5220/0009158202110218
In Proceedings of the Second International Conference on Science, Engineering and Technology (ICoSET 2019), pages 211-218
ISBN: 978-989-758-463-3
Copyright
c
2020 by SCITEPRESS – Science and Technology Publications, Lda. All rights reserved
211

• Interviews conducted directly with Psychology
experts.
• Distribution of online questionnaires to 700
adolescents aged 17 to 21 through Google Forms
to obtain case base data and test data.
• Literature studies through scientific references
from various sources related to the problem under
study, both from books, scientific journals and
from other readings that can be justified.
2.2 Adolescents
In English adolescents are called adolescent, derived
from the word adolescent which means growing
toward maturity. Adolescents is a period of transition
between childhood and adulthood. At this time,
adolescents experience the development of achieving
physical, mental, social and emotional maturity and
the emotional state of adolescents is still unstable
because it is closely related to hormonal conditions.
Hurlock (1980), divides adolescents into two parts,
namely early adolescents and late adolescents. Early
adolescents lasts approximately from the age of 13-16
years and the late adolescents starts from the age of
17-21 year(Holmbeck, 2018; Weis, 2017).
Adolescents is a period of developmental
transition between childhood and adulthood which
includes biological, cognitive and social emotional
changes. In English teenagers are called adolescent,
derived from the word adolescent which means
growing toward maturity. Adolescence is a period
of transition between childhood and adulthood. At
this time, adolescents experience the development
of achieving physical, mental, social and emotional
maturity and the emotional state of adolescents is
still unstable because it is closely related to hormonal
conditions. Emotional emotions dominate and
control themselves from a realistic mind (Rosenberg,
2015; Coleman, 2006).
2.3 Depression
Depression is a period of disruption of human
function related to natural feelings of sadness and
accompanying symptoms, including changes in sleep
patterns and appetite, psychomotor, concentration,
anhedonia, fatigue, hopelessness and helplessness,
and suicide. Depression is likened to flu, because
depression can occur in all circles, including
adolescents (Kaplan et al., 2010; Amelia et al., 2018).
There are 3 levels of depression :
• Mild Depression
At this level, the symptoms usually affect the
daily activities of people who experience it such
as being less interested in doing things that are
usually done, easily angry, the motivation to
work becomes less. This depression is not too
disturbing, but must be treated to prevent the
condition from getting worse.
• Middle Depression (Moderate Depression)
At this level, this depression causes a person to
experience difficulties in terms of social, work
and domestic activities. In moderate depression,
usually a person becomes less confident so
he or she is less motivated to do something.
Often a person starts to worry about things that
are unnecessary, more sensitive, and vulnerable
to feelings of hurt or offense in personal
relationships.
• Severe Depression
At this level, this depression causes a person
to experience severe suffering such as feeling
a loss of self-esteem or feeling useless and
guilty, and wanting to commit suicide. A person
who is severely depressed cannot manage his
emotions so that he easily experiences feelings of
despair. People with severe depression may also
suffer from delusions, hallucinations or stupor
depressive.
Anxiety can be divided according to the source
of reason, namely: Anxiety that comes from the
environment, called objective anxiety that is anxiety
caused by the environment and does not need
treatment, because it is one of the factors ”self-care”.
Anxiety in the body is called vital anxiety, namely
anxiety that originates in the body and functions as
a definition mechanism that protects the individual.
Awareness of consciousness is called conscience
anxiety, that is, individuals have an awareness of
morality that will protect individuals against acts that
are immoral (Lovibond and Lovibond, 1995).
Problems experienced by adolescents in fulfilling
the tasks of adolescent development, namely:
• Personal problems, namely problems related to
situations and conditions in the home, school,
physical condition, appearance, emotions, social
adjustment, duties, and values.
• Typical teen problems, namely problems that
arise due to unclear status in adolescents, such
as the problem of achieving independence,
misunderstanding, the existence of greater rights
and fewer obligations imposed by parents.
ICoSET 2019 - The Second International Conference on Science, Engineering and Technology
212
2.4 Expert
Systems Knowledge-based systems, also known
as expert systems, are one branch of artificial
intelligence, which in the commercial world is
called a system that can effectively and efficiently
carry out tasks that do not really require experts.
Expert systems are also known as advisory systems,
knowledge systems, intelligent work assistance
systems or operational systems (Aronson et al., 2005).
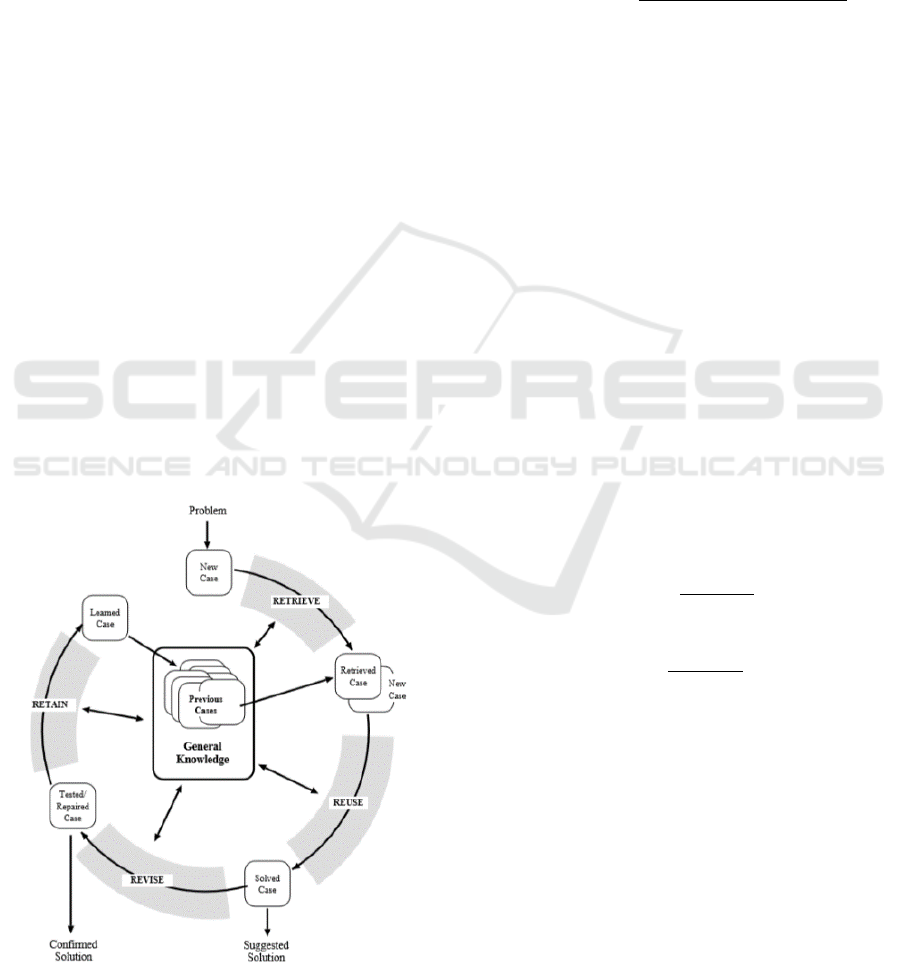
2.5 Case based Reasoning (CBR)
Case Based Reasoning (CBR) is a system that aims to
resolve a new case by adapting the solutions found
in the previous case that are similar to the new
case. The basic idea of CBR is to imitate human
abilities, namely solving new problems using answers
or experiences from old problems. Representation of
knowledge is made in the form of cases. Each case
contains problems and answers, so the case is more
like a certain pattern. The way CBR works is to
compare new cases with old cases. If the new case
bears a resemblance to the old case, the CBR will
provide an answer to the old case for the new case.
If there is no match, the CBR will adapt, by inserting
the new case into a case base, so that indirectly CBR
knowledge will increase (Li et al., 2018).
Figure 1: System Architecture CBR.
2.6 Simple Matching Coefficient (SMC)
There are a variety of techniques that can be used to
measure the similarity of a case with an old case on a
case base. One of methods similarity that can be used
is Simple Matching Coefficient (SMC) with equation
(1) (Faizal, 2014).
SMC(X ,Y ) =
M
11
+ M
00
M
01
+ M
10
+ M
11
+ +M
00
(1)
Description:
X = Old case
Y = New case
M11 = Number of attributes where X = 1 and Y = 1
M00 = Number of attributes where X = 0 and Y = 0
M01 = Number of attributes where X = 0 and Y = 1
M10 = Number of attributes where X = 1 and Y = 0
2.7 Feasibility System
Feasibility system is obtained by finding the value of
precision and recall systems based on comparison of
the results of detection by experts using the DASS
42 calculation with the results of detection by the
system. Before getting precision and recall values,
need the True Positive (TP), True negative (TN), False
Positive (FP) and False Negative (FN). These values
are measured using information retrieval (Huibers
et al., 1996). Precision and recall can go through the
formulas in equations (2) and (3).
Precision(P) =|
T P
T P + FT
| ∗100% (2)
Recall(R) =|
T P
T P + FN
| ∗100% (3)
2.8 DASS 42
The severity of depression, anxiety, and stress what
a person experiences can be measured on many
scales including using the Depression Anxiety Stress
Scale 42 or abbreviated with DASS 42 developed by
Lovibond & Lovibond (1995). DASS is a 42-item
questionnaire that includes three scales to measure
negative emotional states of depression, anxiety and
stress. Each of the three scales contains 14 items.
Scores for each respondent during each sub-scale,
then evaluated according to their severity (Lovibond
and Lovibond, 1995).
Expert System to Detect Early Depression in Adolescents using DASS 42
213
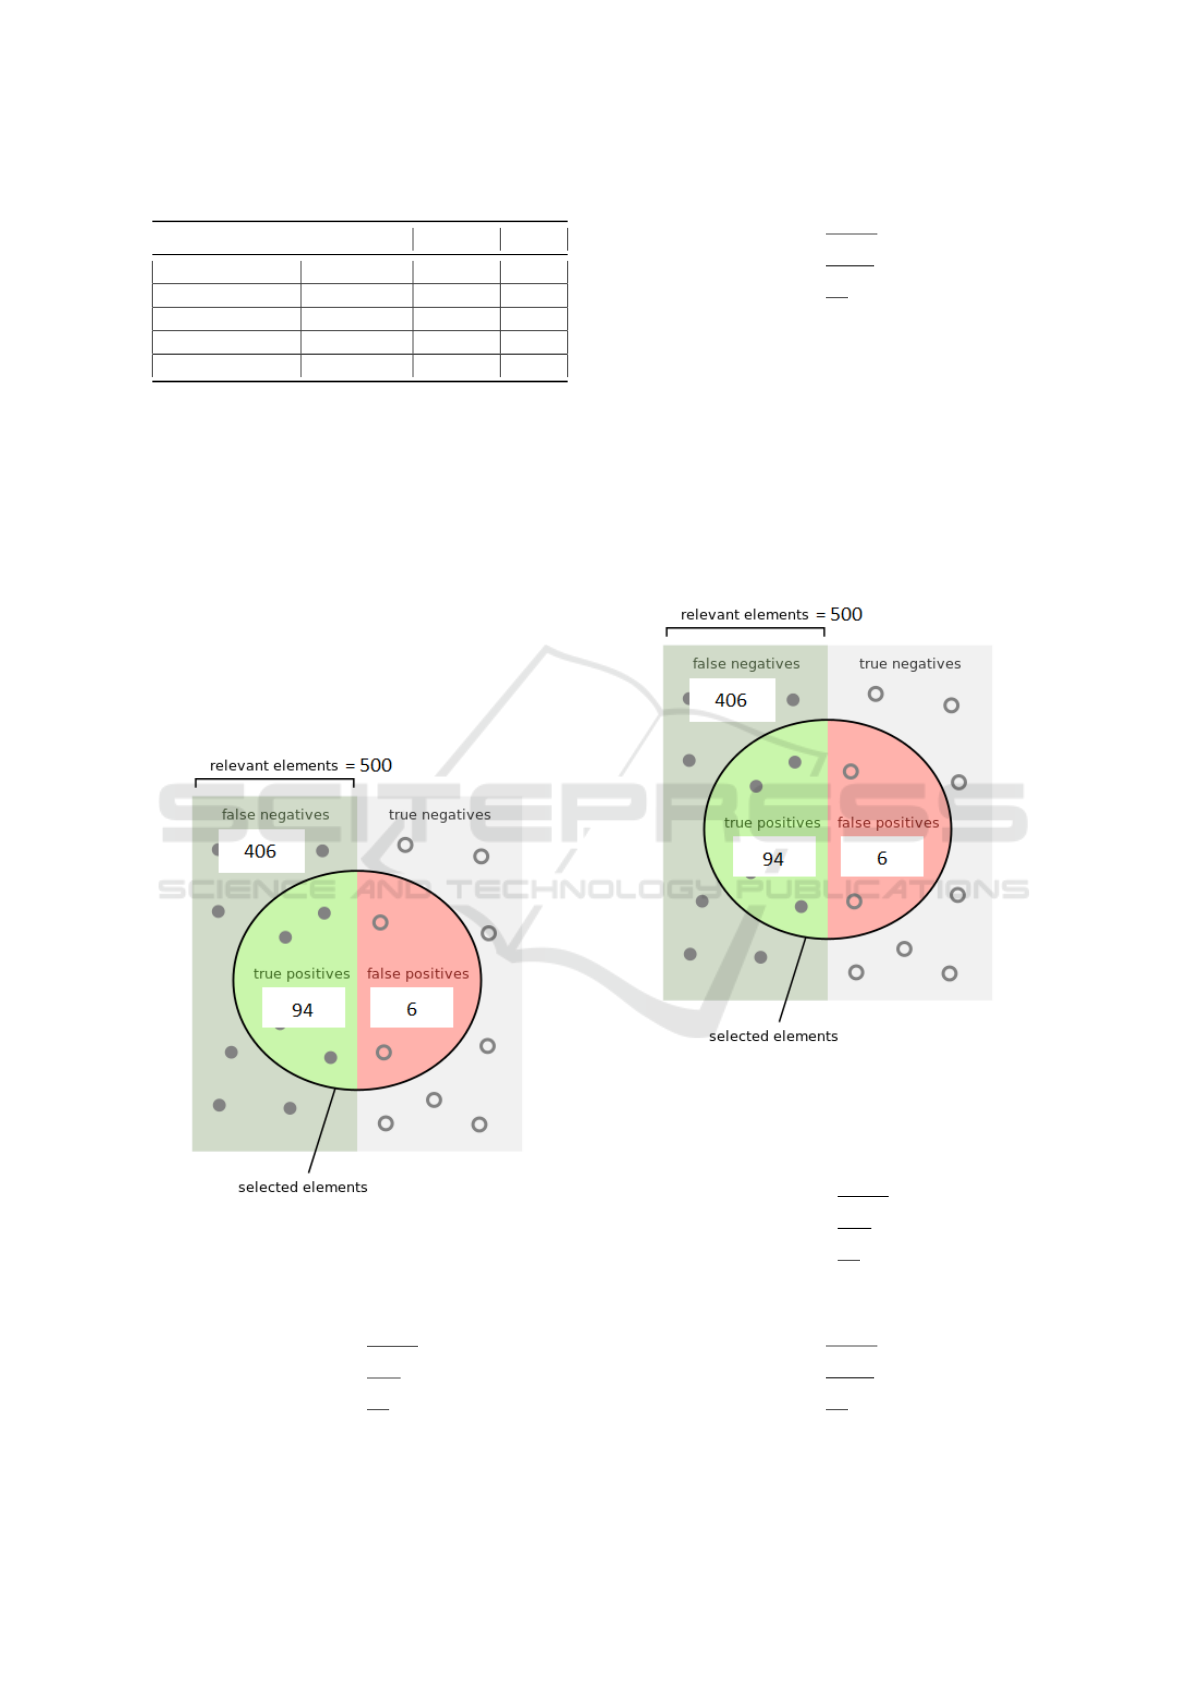
Table 1: Score DASS 42 (Lovibond & Lovibond 1995).
Level of Depression Anxiety Stress
Normal 0-9 0-7 0-14
Mild 10-13 8-9 15-18
Medium 14-20 10-14 19-25
Severe 21-27 15 - 19 26 - 33
Extremely severe >28 >20 >34
3 RESULT AND DISCUSSION
3.1 Testing on 500 Case Bases
There are 100 test data with an equal number of
detection rates of 20: 20: 20: 20: 20 in anxiety
detection, 20: 20: 20: 20: 20 in stress detection and
20: 20: 20: 20: 20 in depression detection . The
comparison sample of detection results is shown in
table 2.
Based on table 2, the number of detection levels
in the test data is shown in table 3.
Testing on Detection of Depression
Figure 2: Information Retrieval on Comparison of
Detection Results of Depression (Based on Table 3).
Based on figure 2, the precision and recall values
of depression detection can be found as follows:
(4)
Precision(P) =
T P
T P+FT
∗ 100%
=
94
94+6
∗ 100%
=
94
100
∗ 100%
= 94% .
(5)
Recall(R) =
T P
T P+FN
∗ 100%
=
94
94+406
∗ 500%
=
94
500
∗ 100%
= 18, 80% .
Testing the Amount of Random Detection Rate.
There are 100 test data with a number of random
detection rates of 14: 15: 30: 25: 16 in anxiety
detection, 11: 22: 41: 17: 9 in stress detection
and 8: 13: 35: 35: 9 in depression detection. The
comparison sample of detection results is shown in
table 4.
Based on table 4, the number of detection levels
obtained in the test data is shown in table 5.
Testing on Detection of Depression
Figure 3: Retrieval of Information on Comparative Results
Detection of Depression (Based on Table 5).
Based on Figure 3, the precision and recall values
of depression detection can be found as follows:
(6)
Precision(P) =
T P
T P+FT
∗ 100%
=
97
97+3
∗ 100%
=
97
100
∗ 100%
= 97% .
(7)
Recall(R) =
T P
T P+FN
∗ 100%
=
97
97+403
∗ 100%
=
97
500
∗ 100%
= 19, 40% .
ICoSET 2019 - The Second International Conference on Science, Engineering and Technology
214
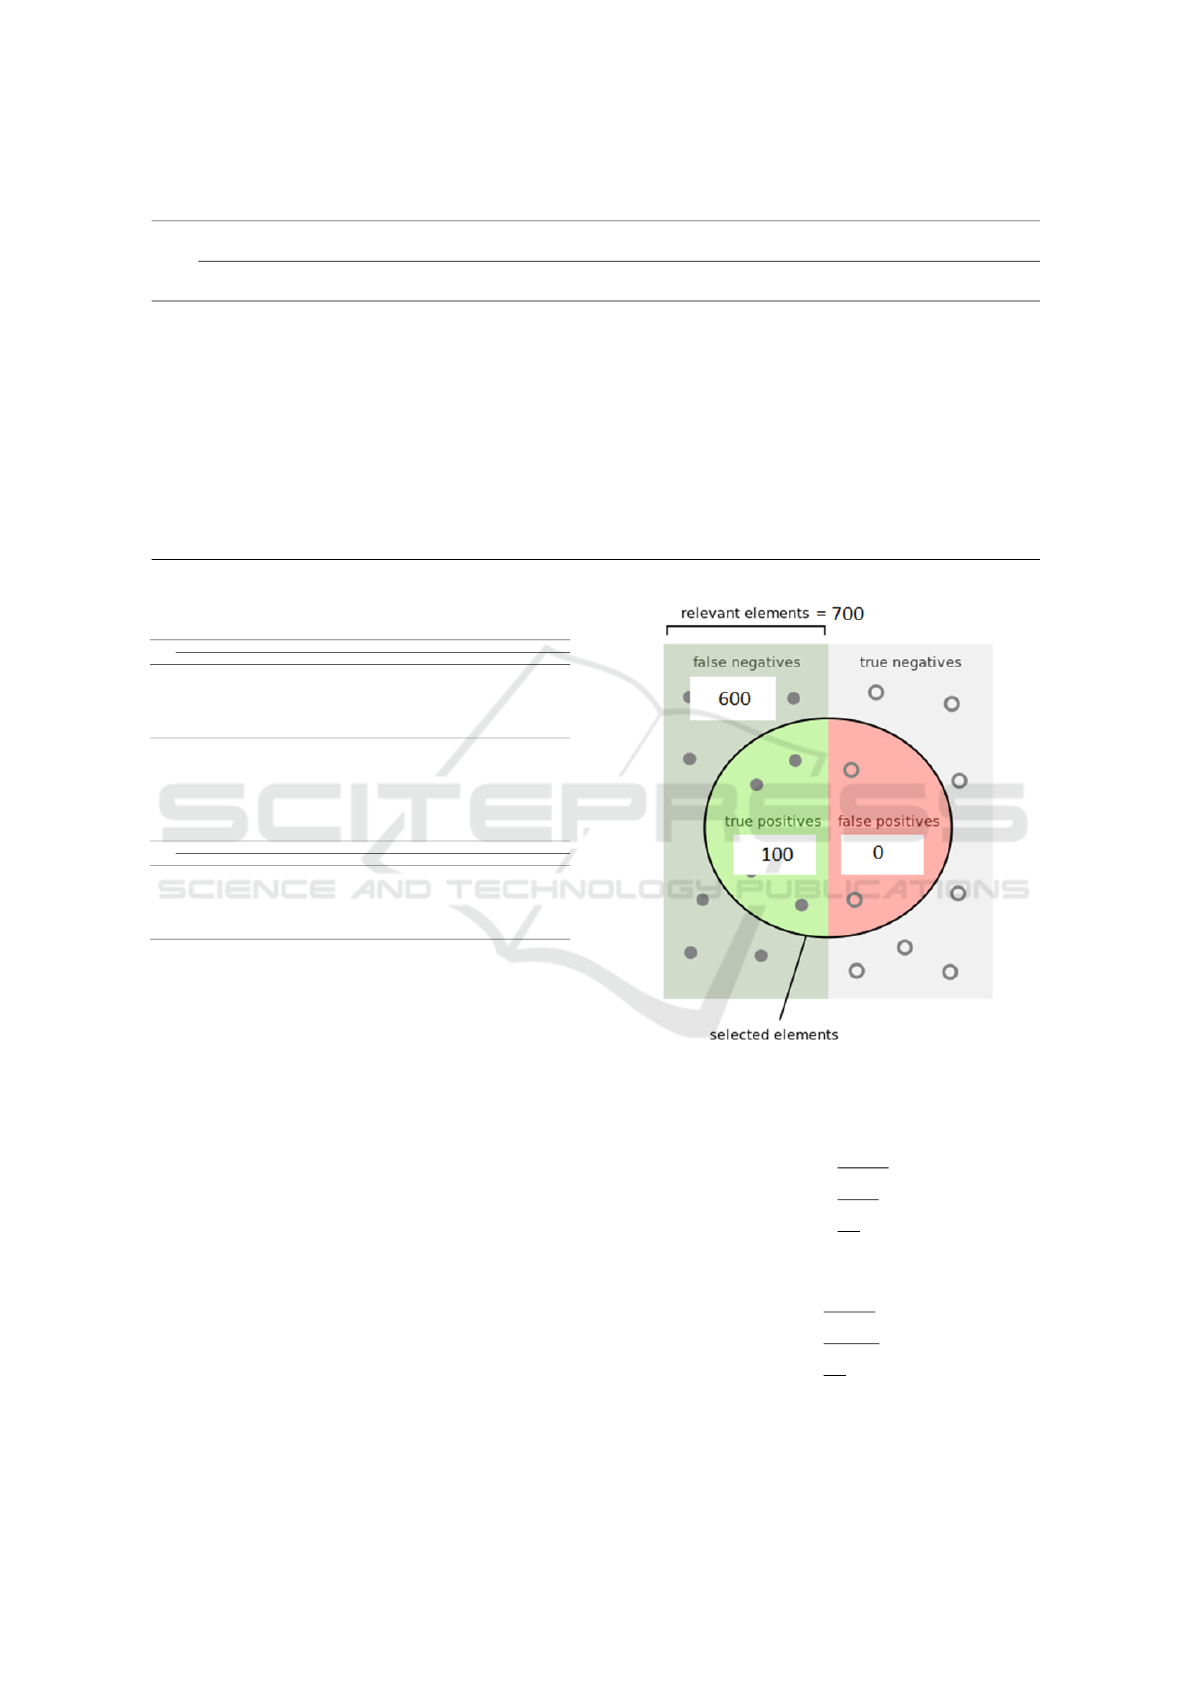
Table 2: Comparison of Test Data Detection Results by Experts with a System with an Equal Alignment Detection Level.
No
Anxiety Detection
Results
Stress Detection
Results
Depression Detection
Results
Expert
Results
Expert
Results
Expert
Results
Expert
Results
Expert
Results
Expert
Results
1 Normal Normal Normal Normal Normal Normal
2 Normal Normal Normal Normal Normal Normal
3 Normal Normal Normal Normal Normal Normal
4 Normal Normal Normal Normal Normal Normal
5 Normal Normal Normal Normal Normal Normal
6 Normal Normal Normal Normal Normal Normal
. . . . . . .
. . . . . . .
. . . . . . .
97 Extremely severe Extremely severe Extremely severe Extremely severe Extremely severe Extremely severe
98 Extremely severe Extremely severe Extremely severe Extremely severe Extremely severe Extremely severe
99 Extremely severe Extremely severe Extremely severe Extremely severe Extremely severe Extremely severe
100 Extremely severe Extremely severe Extremely severe Extremely severe Extremely severe Extremely severe
Table 3: Number of Detection Levels on Test Data (Based
on Expert Results).
No
Anxiety Detection Results Stress Detection Results Depression Detection Results
Detection rate Total Detection rate Total Detection rate Total
1 Normal 20 Normal 20 Normal 20
2 Mild 20 Mild 20 Mild 20
3 Medum 20 Medum 20 Medum 20
4 Severe 20 Severe 20 Severe 20
5 Extremely severe 20 Extremely severe 20 Extremely severe 20
Total 100 Total 100 Total 100
Table 4: Comparison of Test Data Detection Results by
Experts with a System with an Equal Alignment Detection
Level.
No
Anxiety Detection Results Stress Detection Results Depression Detection Results
Detection rate Total Detection rate Total Detection rate Total
1 Normal 14 Normal 11 Normal 8
2 Mild 15 Mild 22 Mild 13
3 Medum 30 Medum 41 Medum 35
4 Severe 25 Severe 17 Severe 35
5 Extremely severe 16 Extremely severe 9 Extremely severe 9
Total 100 Total 100 Total 100
3.2 Testing on 700 Case Bases
Testing is focused on similarity testing, where the
data to be tested consists of 200 depression data test
that are tested on 500 case base and on 700 case
base. 200 data test on the detection of depression are
subdivided into 2 which 100 data test with an equal
number of detection levels with 20:20:20:20:20 data
and 100 data test with a random number of detection
levels with 8:13:35:35:9 data. Experts will look for
detection results in the data test on each test using the
DASS 42 calculation.
Based on table 6, obtained the number of detection
levels in the test data shown in table 7.
Testing on Detection of Depression
Based on figure 2, the precision and recall values
of depression detection can be found as follows:
Figure 4: Information Retrieval on Comparison of
Detection Results of Depression (Based on Table 3).
(8)
Precision(P) =
T P
T P+FT
∗ 100%
=
100
100+0
∗ 100%
=
100
100
∗ 100%
= 100% .
(9)
Recall(R) =
T P
T P+FN
∗ 100%
=
100
100+600
∗ 100%
=
100
700
∗ 100%
= 14, 29% .
Testing the Amount of Random Detection Rate
Expert System to Detect Early Depression in Adolescents using DASS 42
215
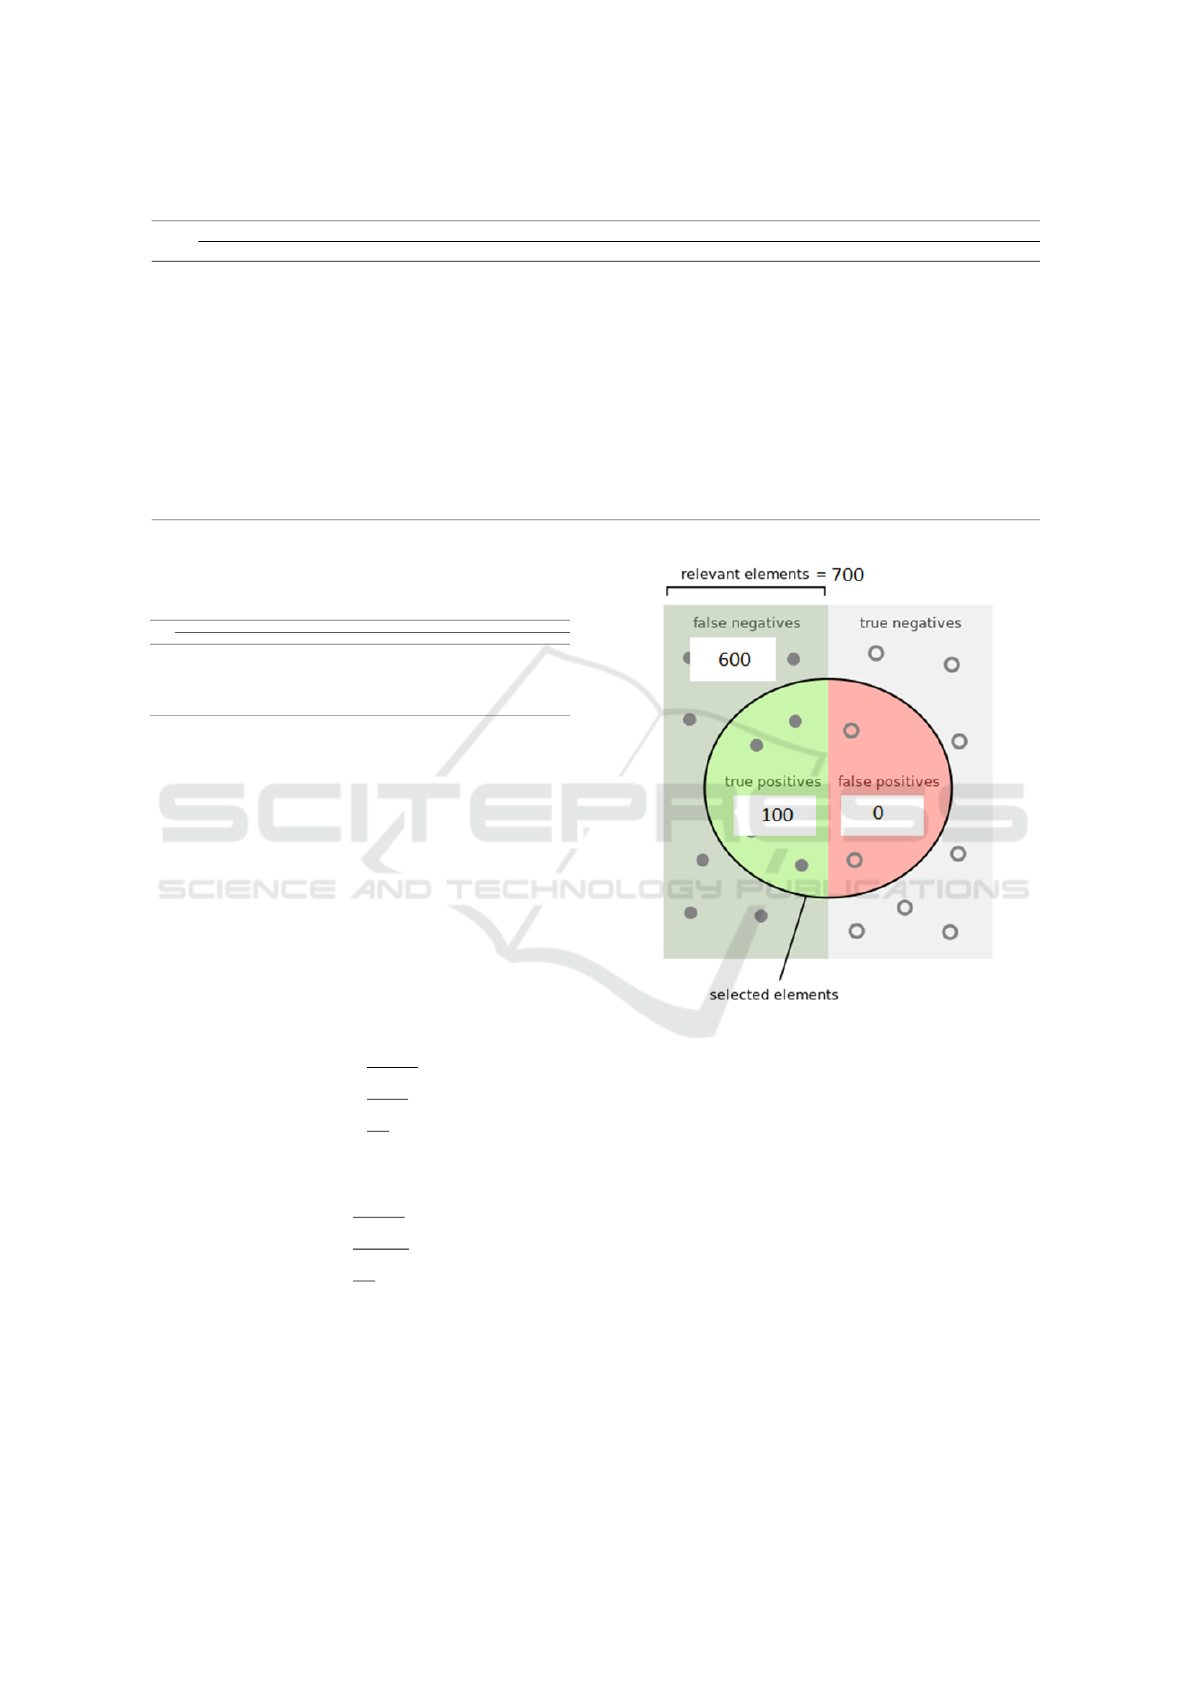
Table 5: Number of Detection Levels on Test Data (Based on Expert Results).
No
Anxiety Detection Results Stress Detection Results Depression Detection Results
Expert Results Expert Results Expert Results Expert Results Expert Results Expert Results
1 Mild Mild Extremely severe Extremely severe Extremely severe Extremely severe
2 Mild Mild Severe Severe Extremely severe Extremely severe
3 Mild Medium Severe Severe Mild Medium
4 Normal Normal Severe Severe Severe Severe
5 Mild Mild Severe Severe Medium Medium
6 Mild Mild Severe Severe Severe Severe
. . . . . . .
. . . . . . .
. . . . . . .
97 Extremely severe Extremely severe Mild Mild Medium Medium
98 Extremely severe Extremely severe Medium Medium Medium Medium
99 Severe Severe Mild Mild Severe Severe
100 Severe Medium Medium Medium Medium Medium
Table 6: Comparison of Test Data Detection Results
by Experts with Systems with Amount of Equal Level
Detection.
No Anxiety Detection Results Stress Detection Results Depression Detection Results
Detection rate Total Detection rate Jumlah Detection rate Total
1 Normal 20 Normal 20 Normal 20
2 Mild 20 Mild 20 Mild 20
3 Medum 20 Medum 20 Medum 20
4 Severe 20 Severe 20 Severe 20
5 Extremely severe 20 Extremely severe 20 Extremely severe 20
Total 100 Total 100 Total 100
There are 100 test data with a number of random
detection rates of 14: 15: 30: 25: 16 in anxiety
detection, 11: 22: 41: 17: 9 in stress detection
and 8: 13: 35: 35: 9 in depression detection. The
comparison sample of detection results is shown in
table 8.
Based on table 8, the number of detection levels
in the test data is shown in table 9.
Testing on Detection of Depression
Based on figure 5, we can find the value of
precision and recall value of depression detection as
follows:
(10)
Precision(P) =
T P
T P+FT
∗ 100%
=
100
100+0
∗ 100%
=
100
100
∗ 100%
= 100% .
(11)
Recall(R) =
T P
T P+FN
∗ 100%
=
100
100+600
∗ 100%
=
100
700
∗ 100%
= 14, 29% .
Based on Table 10, the first with 100 test data with
the equal number of detection with 20:20:20:20:20
data which tested at 500 case base explained that
percentage of precision is 94% and percentage of
recall is 18.80%. The second test with 100 data
Figure 5: Information Retrieval on Comparison of
Detection Results of Depression (Based on Table 9).
test with the random number of detection with
8:13:35:35:9 data which tested at 500 case base
explained that percentage of precision is 97% and
percentage of recall is 19.40%.
Based on table 11, both the third test with 100 with
the equal number of detection with 20:20:20:20:20
data and the fourth test with 100 test data with the
random number of detection with 8:13:35:35:9 data
which was tested at 700 case base explained that all
percentages of precision is 100
Based on the testing, the percentage of precision
is 100% at 700 case base and are ¿ 90% at 500 case
base so it can be concluded that the number of case
base affects the percentage of precision in the system.
ICoSET 2019 - The Second International Conference on Science, Engineering and Technology
216

Table 7: Number of Detection Levels on Test Data (Based on Expert Results).
No
Anxiety Detection
Results
Stress Detection
Results
Depression Detection
Results
Expert Results Expert Results Expert Results Hasil Sistem Expert Results Expert Results
1 Normal Normal Normal Normal Normal Normal
2 Normal Normal Normal Normal Normal Normal
3 Normal Normal Normal Normal Normal Normal
4 Normal Normal Normal Normal Normal Normal
5 Normal Normal Normal Normal Normal Normal
6 Normal Normal Normal Normal Normal Normal
. . . . . . .
. . . . . . .
. . . . . . .
97 Extremely severe Extremely severe Extremely severe Extremely severe Extremely severe Extremely severe
98 Extremely severe Extremely severe Extremely severe Extremely severe Extremely severe Extremely severe
99 Extremely severe Extremely severe Extremely severe Extremely severe Extremely severe Extremely severe
100 Extremely severe Extremely severe Extremely severe Extremely severe Extremely severe Extremely severe
Table 8: NumberComparison of Detection Results of Test Data by Experts with Systems with Amount of Random Detection
Rate.
No
Anxiety Detection Results Stress Detection Results Depression Detection Results
Expert Results Expert Results Expert Results Hasil Sistem Expert Results Expert Results
1 Mild Mild Extremely Severe Extremely Severe Extremely Severe Extremely Severe
2 Mild Mild Severe Severe Extremely Severe Extremely Severe
3 Mild Mild Severe Severe Mild Mild
4 Normal Normal Severe Severe Severe Severe
5 Mild Mild Severe Severe Medium Medium
6 Mild Mild Severe Severe Severe Severe
. . . . . . .
. . . . . . .
. . . . . . .
97 Extremely Severe Extremely Severe Mild Mild Medium Medium
98 Extremely Severe Extremely Severe Medium Medium Medium Medium
99 Severe Severe Mild Mild Severe Severe
100 Severe Severe Medium Medium Medium Medium
Table 9: Number of Detection Levels on Test Data (Based
on Expert Results).
No
Anxiety Detection Results Stress Detection Results Depression Detection Results
Detection rate Total Detection rate Jumlah Detection rate Total
1 Normal 14 Normal 11 Normal 8
2 Mild 15 Mild 22 Mild 13
3 Medum 30 Medum 41 Medum 35
4 Severe 25 Severe 17 Severe 35
5 Extremely severe 16 Extremely severe 9 Extremely severe 9
Total 100 Total 100 Total 100
Table 10: Testing Conclusions on 500 Case Base.
Detection
Tested on 500 Case Base
100 Equal Data Test 100 Random Data Test
Precision Recall Precision Recall
Depression 94% 18,80% 97% 19,40%
Average 95,33% 19,07% 95,67% 19,13%
Table 11: Test Conclusions on 700 Case Base.
Detection
Tested on 700 Case Base
100 Equal Data Test 100 Random Data Test
Precision Recall Precision Recall
Depression 100% 14,29% 100% 14,29%
Average 100% 14,29% 100% 14,29%
4 CONCLUSIONS
Testing is focused on similarity testing, where the
data to be tested consists of 200 depression data test
that are tested on 500 case base and on 700 case
based. 200 data test on the detection of depression are
subdivided into 2 which 100 data test with an equal
number of detection levels with 20:20:20:20:20 data
and 100 data test with a random number of detection
levels with 8:13:35:35:9 data. Experts will look for
detection results in the data test on each test using the
DASS 42 calculation.
REFERENCES
Amelia, R., Labellapansa, A., and Siswanto, A.
(2018). Sistem pakar sebagai alat bantu untuk
pendekatan diagnosis penyakit thalasemia pada anak
menggunakan metode dempster-shafer. IT JOURNAL
RESEARCH AND DEVELOPMENT, 2(2):14–23.
Aronson, J. E., Liang, T.-P., and Turban, E. (2005).
Decision support systems and intelligent systems,
volume 4. Pearson Prentice-Hall New York.
Coleman, J. (2006). The adolescent society. Education
Next, 6(1).
Expert System to Detect Early Depression in Adolescents using DASS 42
217

Faia, R., Pinto, T., Abrishambaf, O., Fernandes, F.,
Vale, Z., and Corchado, J. M. (2017). Case based
reasoning with expert system and swarm intelligence
to determine energy reduction in buildings energy
management. Energy and Buildings, 155:269–281.
Faizal, E. (2014). Case based reasoning diagnosis penyakit
cardiovascular dengan metode simple matching
coefficient similarity. Jurnal Teknologi Informasi dan
Ilmu Komputer, 1(2):83–90.
Gu, D., Liang, C., and Zhao, H. (2017). A case-based
reasoning system based on weighted heterogeneous
value distance metric for breast cancer diagnosis.
Artificial intelligence in medicine, 77:31–47.
Haryanto, H., Wahyuni, H. D., and Nandiroh, S. (2016).
Sistem deteksi gangguan depresi pada anak-anak dan
remaja. Jurnal Ilmiah Teknik Industri, 14(2):142–152.
Holmbeck, G. N. (2018). A model of family relational
transformations during the transition to adolescence:
Parent–adolescent conflict and adaptation. In
Transitions through adolescence, pages 167–199.
Psychology Press.
Huibers, T. W. C., Lalmas, M., and Van Rijsbergen, C.
(1996). Information retrieval and situation theory. In
ACM SIGIR Forum, volume 30, pages 11–25. ACM.
Kaplan, H. I., Sadock, B. J., and Grebb, J. A. (2010).
Sinopsis psikiatri: Ilmu pengetahuan perilaku psikiatri
klinis. Dr. I. Made Wiguna S. Jakarta: Bina Rupa
Aksara, pages 113–129.
Li, O., Liu, H., Chen, C., and Rudin, C. (2018).
Deep learning for case-based reasoning through
prototypes: A neural network that explains its
predictions. In Thirty-Second AAAI Conference on
Artificial Intelligence.
Lovibond, P. F. and Lovibond, S. H. (1995). The
structure of negative emotional states: Comparison
of the depression anxiety stress scales (dass) with the
beck depression and anxiety inventories. Behaviour
research and therapy, 33(3):335–343.
Rahman, A., Slamet, C., Darmalaksana, W., Gerhana, Y. A.,
and Ramdhani, M. A. (2018). Expert system for
deciding a solution of mechanical failure in a car using
case-based reasoning. In IOP Conference Series:
Materials Science and Engineering, volume 288, page
012011. IOP Publishing.
Rosenberg, M. (2015). Society and the adolescent
self-image. Princeton university press.
Shen, L., Yan, H., Fan, H., Wu, Y., and Zhang, Y.
(2017). An integrated system of text mining technique
and case-based reasoning (tm-cbr) for supporting
green building design. Building and Environment,
124:388–401.
Syafitri, N. and Apdian, A. (2016). Sistem pakar
untuk mendiagnosa obesitas pada anak dengan
menggunakan metode backward chaining. IT Journal
Research and Development, 1(1):1–8.
Syafitri, N., Prayogi, M., and Labellapansa, A. (2018).
Sistem pendukung keputusan pemilihan calon
paskibraka di provinisi riau. IT JOURNAL
RESEARCH AND DEVELOPMENT, 2(2):24–33.
Syafitri, N. and Saputra, A. (2017). Prototype pendeteksi
jumlah orang dalam ruangan. IT Journal Research and
Development, 1(2):36–48.
Syafitri, N. and Sari, J. E. (2017). Sistem klasifikasi
jamur dengan algoritma iterative dichotomiser 3.
IT JOURNAL RESEARCH AND DEVELOPMENT,
1(1):27–37.
Weis, R. (2017). Introduction to abnormal child and
adolescent psychology. Sage Publications.
ICoSET 2019 - The Second International Conference on Science, Engineering and Technology
218
