
Spatiotemporal Analysis of Urban Land Cover:
Case Study - Pekanbaru City, Indonesia
Idham Nugraha
1
, Faizan Dalilla
1
, Mira Hafizhah Tanjung
1
, Rizky Ardiansyah
2
, and M. Iqbal Hisyam
2
1
Urban and Regional Planning Departement, Universitas Islam Riau, Pekanbaru, Indonesia
2
Student in Urban and Regional Planning Departement, Universitas Islam Riau, Pekanbaru, Indonesia
Keywords:
Land Cover, Remote Sensing, Spatiotemporal, Pekanbaru.
Abstract:
The number of people has an increasing pattern by years and it will impact spatial aspects. One of the impacts
was land cover changes from the non-built area into the built-up area. Pekanbaru is one of developing city
in Indonesia that has a high number of the population surge. The purpose of this paper was to analyse the
land cover change in the urban area of Pekanbaru city. The analysis spatiotemporal has been done by using
Landsat Imagery year of 2000, 2005, 2009 and 2014. The method of this paper was digital classification
using maximum likelihood and their integration with Geographical Information Systems (GIS). Land cover
classification divided into two classes such as built-up area and non-built up land area. Based on the results,
the built-up land area has been increased by years, on the other hand, the non-built up area has declined. The
percentage of built-up area change from 29,51% into 59,99%. The spatial distribution of and cover change
dominantly occurs in south part of Pekanbaru city. The mean of accuracy index for the land cover map in this
research was 85,17%. The land cover change of Pekanbaru city has a decreasing pattern where the year of
2000-2005 has a significant number and decreasing by years massively.
1 INTRODUCTION
Globally, the number of populations has an increasing
pattern. Based on the report of Worldmeters (Wor,
2020), the rate of increasing population was 1,09%
by years. Specifically, Indonesia has the number of
population amount of 267.630.499. Indonesia cate-
gorized as a country that has high urbanization index
in Asia around 2,75% by years and it’s above the na-
tional index around 1,49% per year (Indrayani et al.,
2017).
The increasing population will have some con-
sequences. In the spatial aspect, the dimension of
space has been pushed out by the increasing popu-
lation. Yunus (Yunus, 2005) explained that spatial
consequences were increasing demand for space to
accommodate the population activities in the form
of infrastructure and other physical structure. That
will be seen the massive of land cover change from
the non-built area into the built-up area. Land cover
changes can be categorized by the complex interac-
tions of structural and behavioural factors associated
with technological capacity, demand and social rela-
tions that affect both environmental capacity and the
demand along with the nature of the environment of
interest (Veldkamp and Verburg, 2004) (Butt et al.,
2015). Land cover change is one of the main driv-
ing forces of global environmental change, is cen-
tral to the sustainable development debate (Hegazy
and Kaloop, 2015). Land cover change becomes one
of the significant issues for planners and decision-
makers in urban and regional policy (Wijaya and
Susilo, 2013). In line with the issue of increasing
population, land cover change become an interesting
issue to explore in a developing country, especially in
Indonesia. Wijaya (Wijaya and Susilo, 2013) high-
light that issue has been thriving because of the lack-
ing of law enforcement and the policy inter-institution
horizontally and vertically. The study of land cover
change is very essential to understand human activi-
ties and natural phenomenon.
The study of land cover change has been devel-
oped with different methods and cases (Purwanto and
Bayuardi, 2016). One of the methods to determine
that is the integration of remote sensing data and Ge-
ographic Information Systems (GIS). For example, in
China the land cover change was obtained by using
the integrated remote sensing data and GIS at years
of 1992, 1996, 2001, 2004 and 2008 (Purwanto and
Bayuardi, 2016). In Indonesia, several studies have
74
Nugraha, I., Dalilla, F., Tanjung, M., Ardiansyah, R. and Hisyam, M.
Spatiotemporal Analysis of Urban Land Cover: Case Study - Pekanbaru City, Indonesia.
DOI: 10.5220/0009106300740079
In Proceedings of the Second International Conference on Science, Engineering and Technology (ICoSET 2019), pages 74-79
ISBN: 978-989-758-463-3
Copyright
c
2020 by SCITEPRESS – Science and Technology Publications, Lda. All rights reserved
been done, one of them was Indrayani et al (2016). It
has been done to evaluate land cover change and its
relations with the ecological connectivity index us-
ing remote sensing data year of 1997 until 2012 in
Makasar city.
The technology advance, especially on remote
sensing and GIS, gives some benefit to obtain some
information about earth surface such as land cover.
One of them is remote sensing data can give quick in-
formation and multi-series data (NUGRAHA, 2016).
GIS advance can be used for measurement, mapping,
monitoring and modelling (Star and Estes, 1990). To
ease the used remote sensing data and GIS in land
cover studies, it can be done by making land cover
classification (NUGRAHA, 2016).
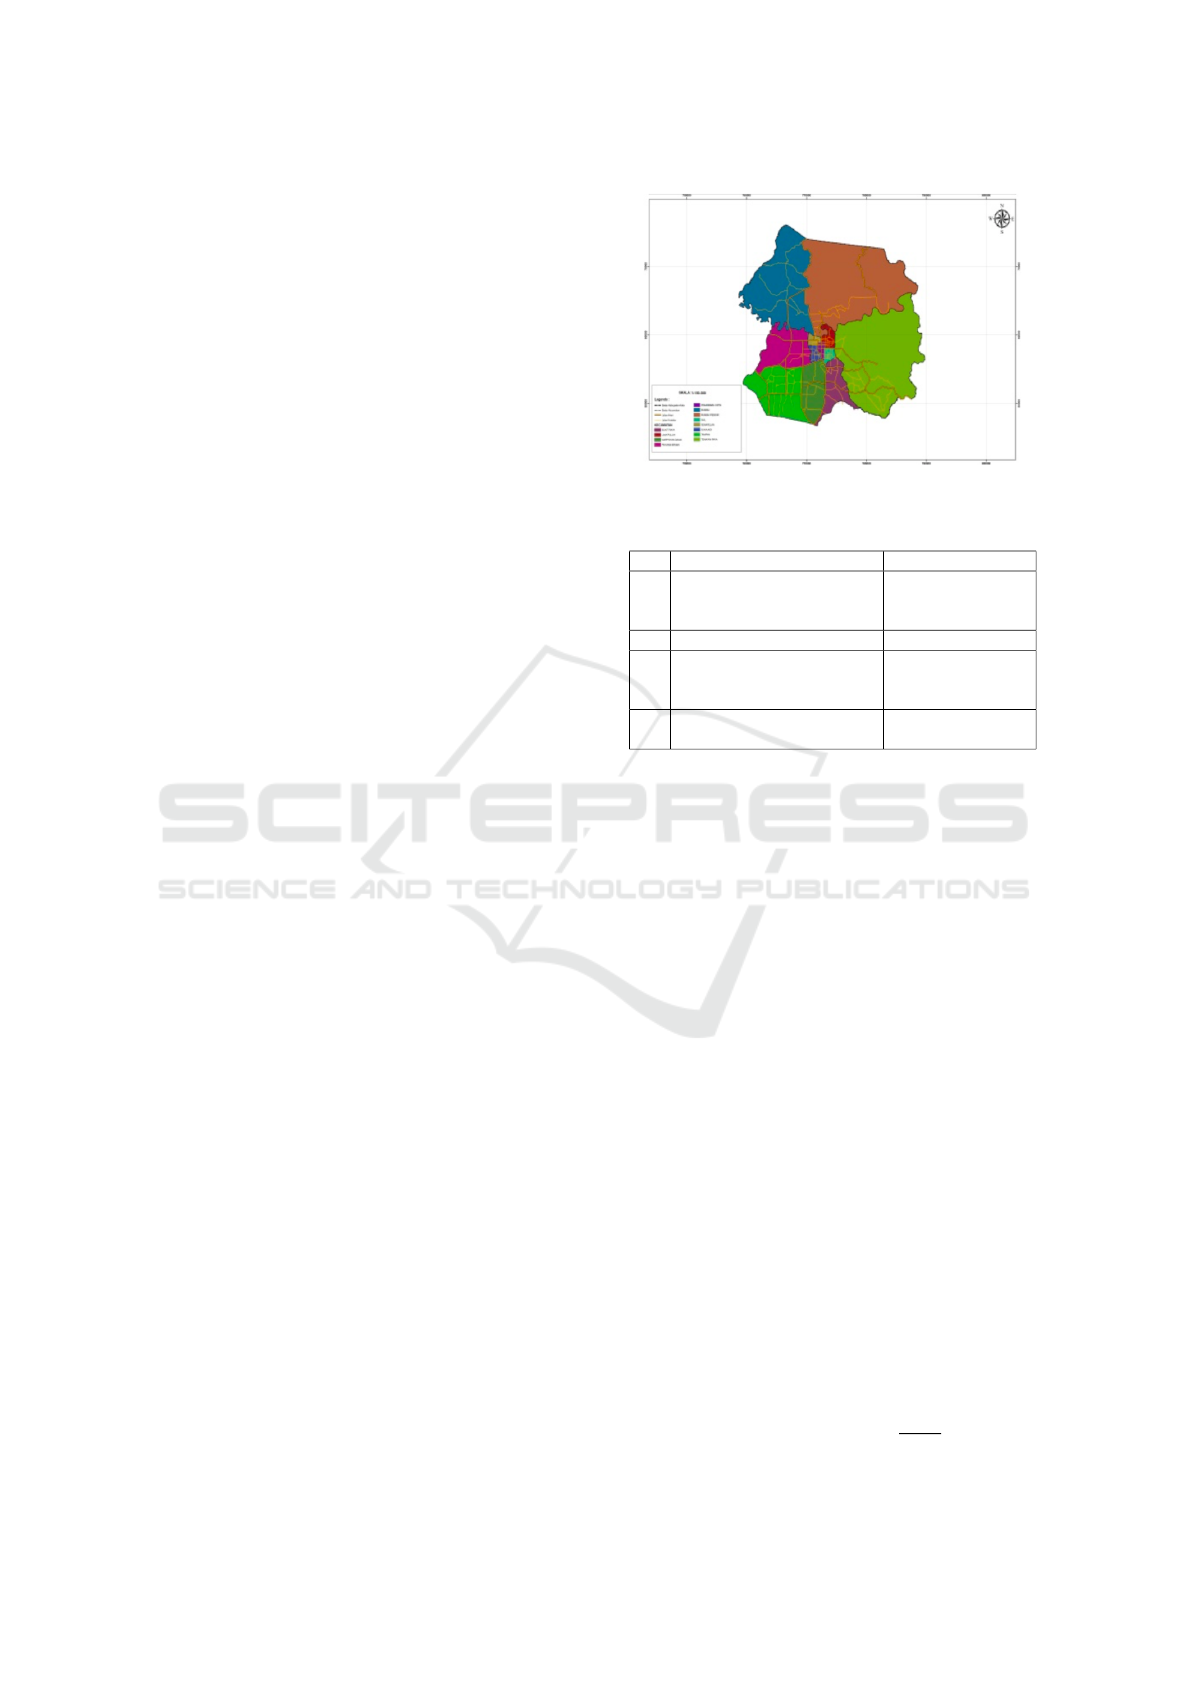
Pekanbaru is a central city in Riau Province and
categorized as a developing city in Indonesia. Pekan-
bary city connects the north-south littoral of Sumat-
era, and it also connects the East and West of this
island (Kausarian et al., 2018). Pekanbaru consists
of twelve (12) districts, there area Bukit Raya, Lima
Puluh, Marpoyan Damai, Payung Sekaki, Pekanbaru
Kota, Rumbai, Rumbai Pesisir, Sail, Senapelan, Suka-
jadi, Tampan and Tenayan Raya (figure 1). Based
on Statistical data (Pekanbaru, 2016), Pekanbaru has
total populations amount 1.038.118 in the year of
2015. For the comparison, In 2000 Pekanbaru has
the number of populations around 586.223. In 15
years, Pekanbaru has 451.895 of people accretion and
it will affect the spatial condition in Pekanbaru city.
The research purpose was to review the land cover of
Pekanbaru city year of 2000, 2005, 2009 and 2014
by using Landsat imagery and digital classification.
To achieved purposed, some step will be done. There
were :
a) Determine the land cover of Pekanbaru city
b) Determine the accuracy of the land cover
map
c) Determine the land cover change of Pekanbaru
city
2 METHOD
To achieve the purpose of the research, some pri-
mary and secondary data were needed. The data were
Landsat imagery, Rupabumi Indonesia Map (Base
Map), The draft of Spatial Regulation Document of
Pekanbaru year of 2006. For further information, the
required data were:
Figure 1: Administrative map of Pekanbaru
Table 1: The Data Requirements
No Data Sources
1 Landsat ETM+ year of
2000, 2005 and 2009.
Landsat 8 year of 2014
USGS
2 Rupabumi Indonesia Related Institutions
3 The draft of Spatial Regula-
tion Document of Pekanbaru
year of 2006
Related Institutions
4 The form of Land Cover
Change
Field Observation
2.1 Determine The Land Cover of
Pekanbaru City
To determine the land cover of Pekanbaru city,
we used the classification of maximum likelihood
method by using ENVI 4.5. The maximum likeli-
hood is categorized as supervised classification. This
method is classified as the pixel based on their value
to the particular class. Technically, the sample was
collected from Landsat imagery that has spatial reso-
lution 30 m by selecting the Region of Interest (ROI).
The land cover present into two classes, there were
built up area and non-built up area.
2.2 Determine the Accuracy of The
Land Cover Map
The accuracy assessment was needed to determine the
correctness of the land cover map. The method is the
Kappa index assessment. This method is compared
to the land cover map with the actual condition on the
field. For the sample, we used 60 points that randomly
distributed. The minimum index that allowed is 85%
(Jensen et al., 2004). The matrix of the accuracy index
is explained below.
T he total accuracy =
a + d
T
(1)
Spatiotemporal Analysis of Urban Land Cover: Case Study - Pekanbaru City, Indonesia
75
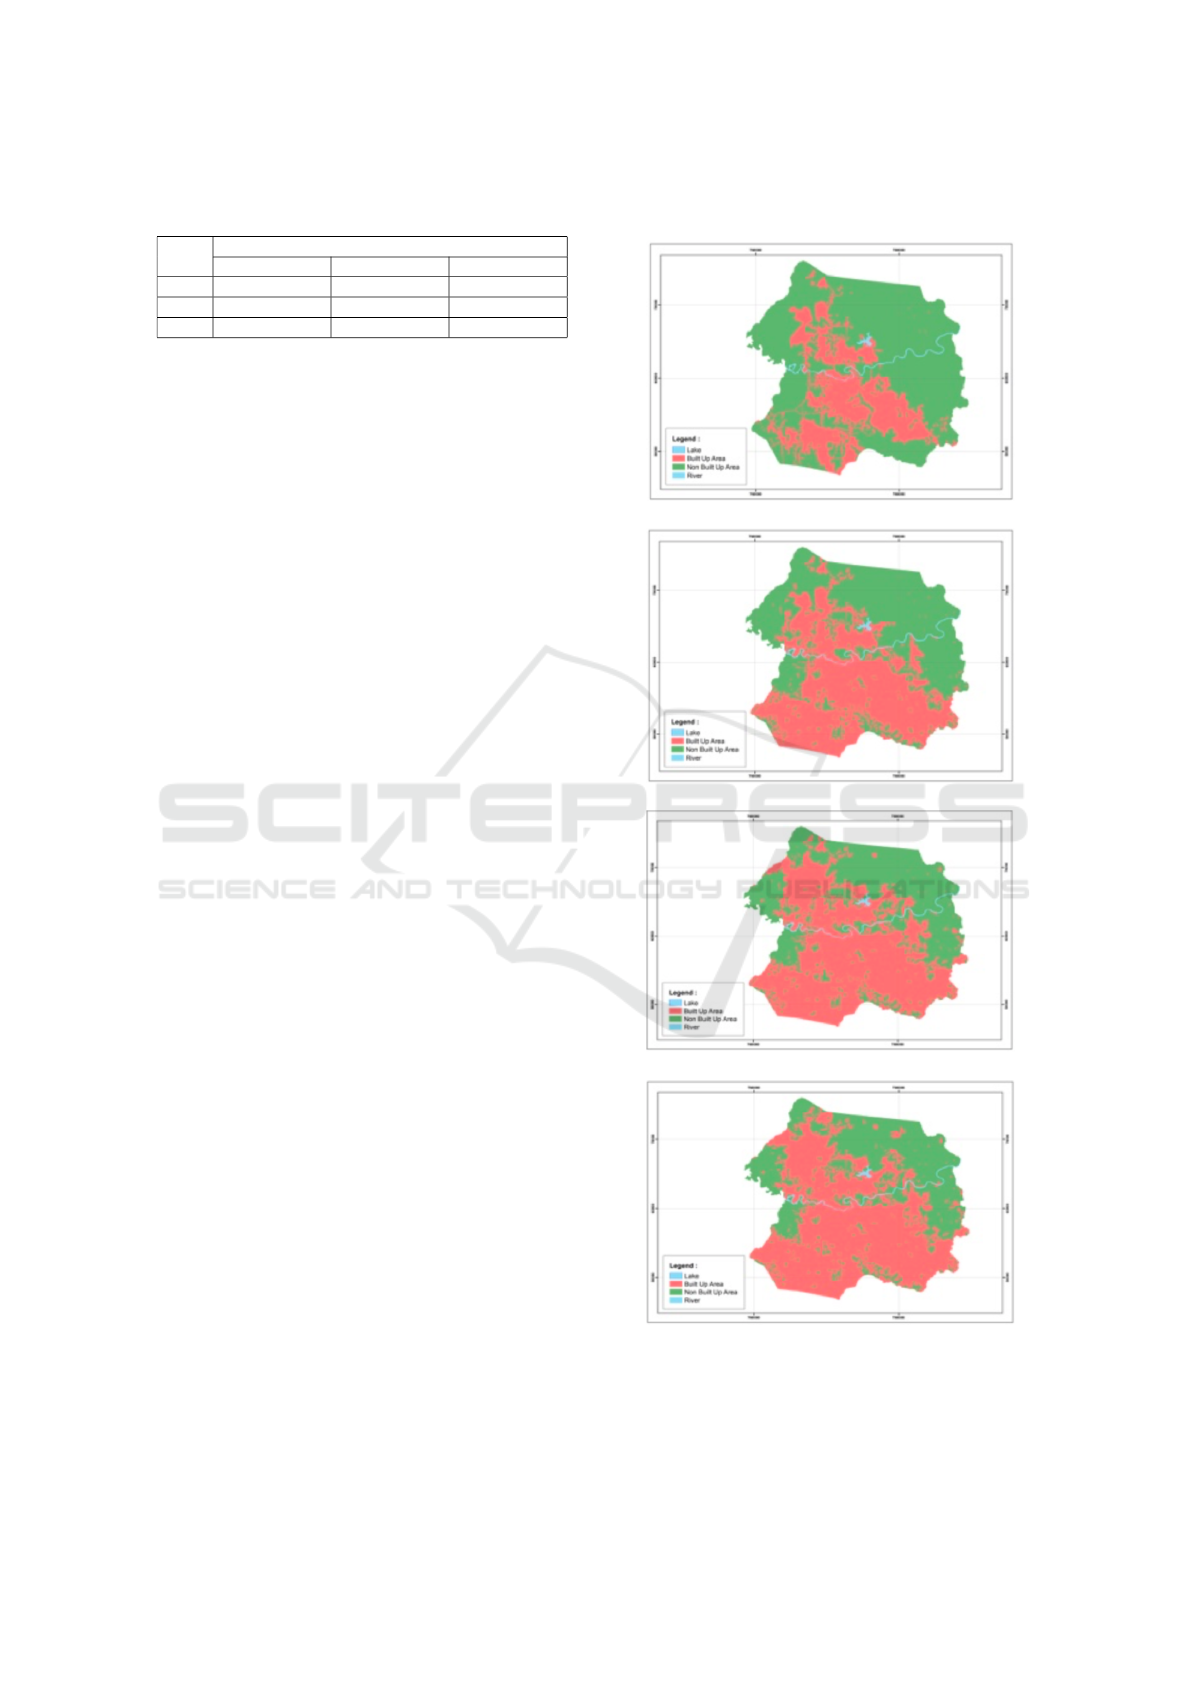
Table 2: The Matrix of Accuracy Index
Field
Interpretation
A1 A2 Total
A1 a b a+b
A2 c d c+d
Total a+c b+d T
Source: (Sutanto and Leung, 1999) with modification
2.3 Determine The Land Cover Change
of Pekanbaru City
The land cover change was obtained by overlaid the
land cover map. This stage has been done to deter-
mine the spatial distribution of the change by using
ArcGIS. This method was using the raster calculator.
For further analysis, field observation is needed. The
land cover change information will be guided to the
field observation. This step will be done to obtain
information about the form of land cover change in
Pekanbaru city.
3 RESULTS AND DISCUSSION
3.1 The Land Cover of Pekanbaru City
For this stage, we used the application of ENVI 4.5.
From the Landsat images, we generated two classes
of Region of Interest (ROI). There were built-up area
and non-built up area. There were 100 samples for
each class. Here below the figure 3, shows the land
cover of Pekanbaru city 2000-2014.
Based on figure 2, we can see that the land cover
of Pekanbaru city dominantly by the built-up area
shown by the red mark on the map. Generally, the
built-up area in Pekanbaru has been developing. In
2000, the built-up area amount of 208.712 pixels or
around 29,51% from the total of land cover in Pekan-
baru City. For the comparisons, in the year of 2014,
built up area was increasing. It is shown by the num-
ber of pixels of the built-up area around 424.362 pix-
els (59,99%). For the distribution, the built-up area
distributed randomly in Pekanbaru especially in the
south part of Pekanbaru. It was because in the south
part of Pekanbaru found some of the development
centres as a triggered factor such as the centre of ed-
ucation, the centre of government and centre of trad-
ing. For the further, the pixel number of land cover in
Pekanbaru shown on the table below.
(a)
(b)
(c)
(d)
Figure 2: The Land Cover Map of Pekanbaru City; (a) year
of 2000, (b) year of 2005, (c) year of 2009, (d) year of 2014
ICoSET 2019 - The Second International Conference on Science, Engineering and Technology
76
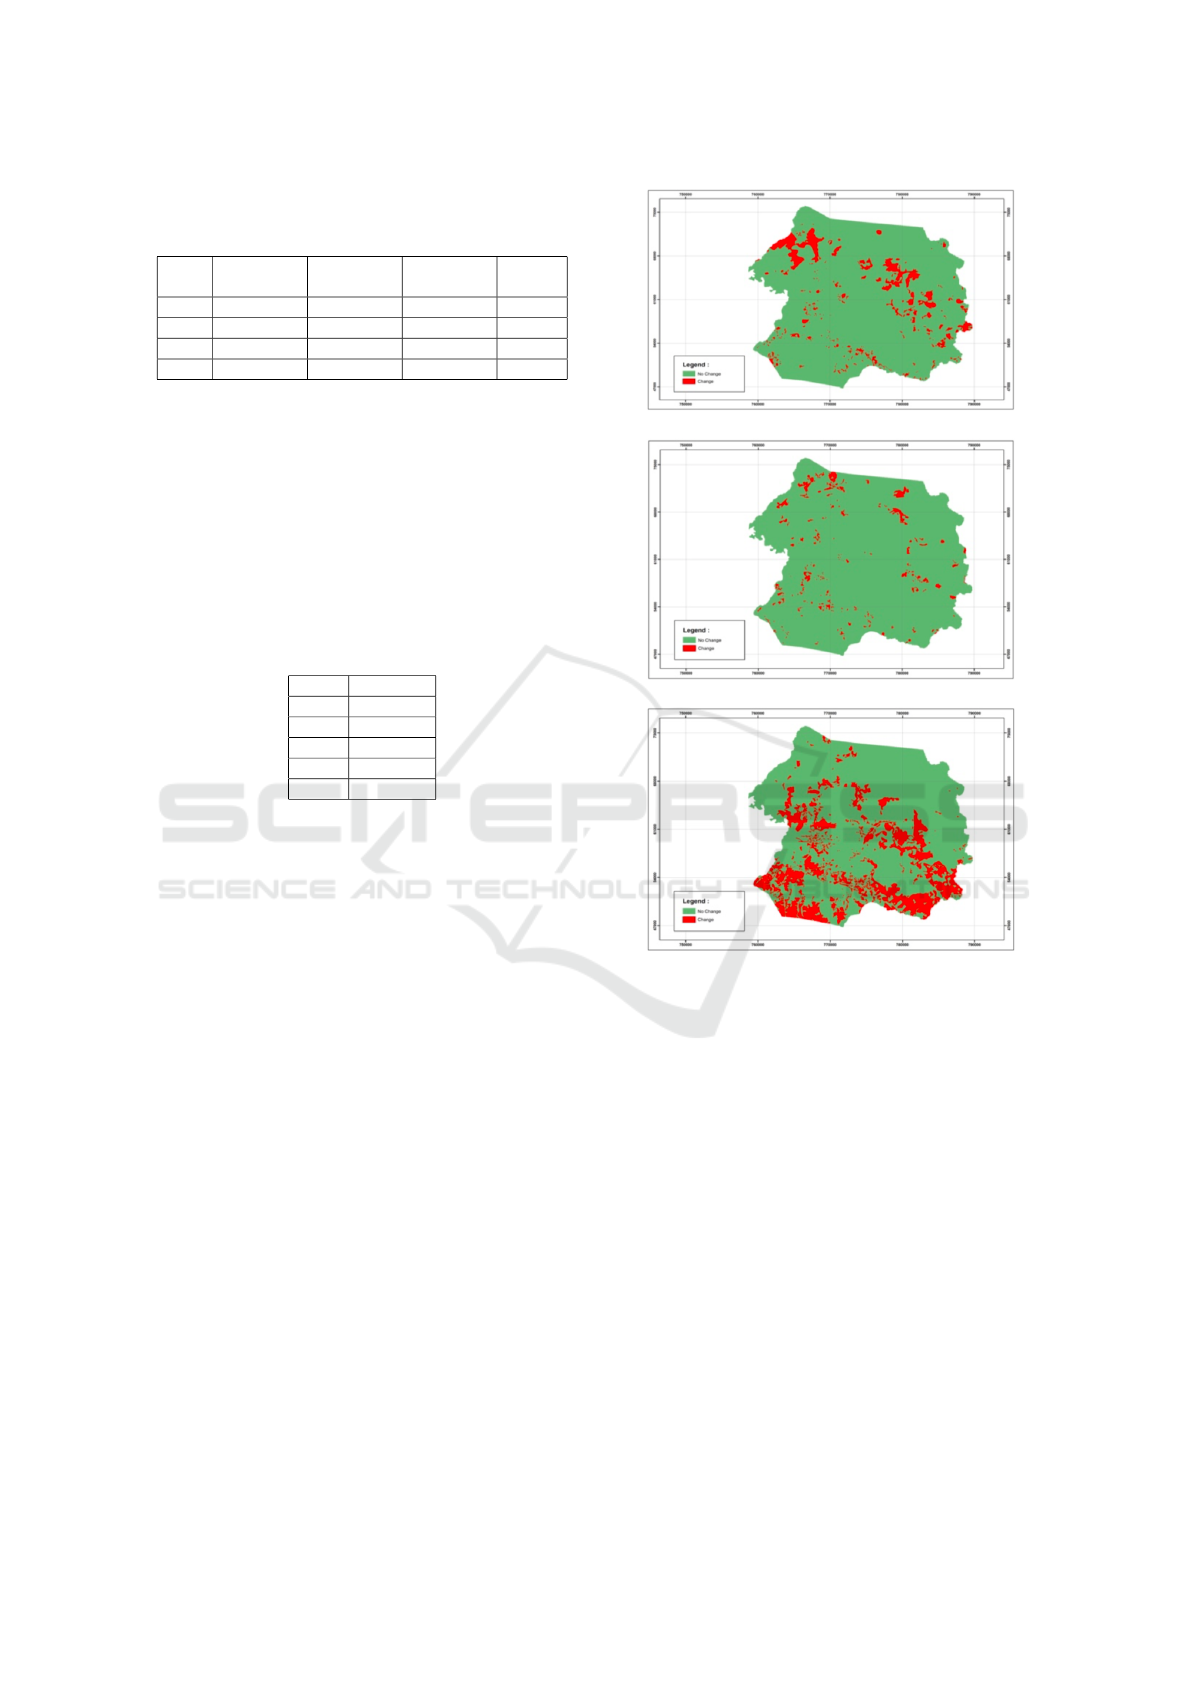
Table 3: The Pixel Number of Land Cover in Pekanbaru
City
Year Built Up
Area
Non Built-
Up Area
Lake River
2000 208712 491813 5377 1451
2005 349080 351445 5377 1451
2009 402534 297991 5377 1451
2014 424362 276163 5377 1451
3.2 The Accuracy of Land Cover Map
First step of this stage was determined the training
area or point as a sample. The number of samples
were 60 points that randomly spread around Pekan-
baru city. The mean of accuracy from Landsat image
was 85.17%. For the detail information about the ac-
curacy shown on table below.
Table 4: The Accuracy of Land Cover Map
Year Accuracy
2000 84.2
2005 85.5
2009 85.0
2014 86.0
Mean 85.17
3.3 The Land Cover Change of
Pekanbaru City
The information about the land cover change in this
paper was obtained from the land cover map that ex-
tracted from the Landsat image. The thematic map
will be overlaid by using Raster Calculator tool on
ArcGIS application. The unit analysis for the land
cover change is a pixel. We used the pixel to described
the change value. The land cover change in Pekan-
baru city occurred in the form of the non-built up area
like vegetation, swamp area transforms into the built-
up area such as settlement, trading and service. The
significant change occurred in 2000 until 2005. It
is shown on the map, that change has been noticed
by the red mark and been seen on the south part of
Pekanbaru significantly. Meanwhile, the change be-
tween 2005-2009 and 2009-2014 has a small portion
and distribute more equal to the north part of Pekan-
baru city. Figure 3 shows the land cover change in
Pekanbaru city 2000-2015.
Based on the analysis, the land cover change in
Pekanbaru city has decreases pattern. From 2000 un-
til 2005 the land cover has been massively changed
from the non-built area into the built-up area. From
(a)
(b)
(c)
Figure 3: The Land Cover Change Map of Pekanbaru City;
(a) year of 2000-2005, (b) year of 2005-2009, (c) year of
2009-2014
the total pixel around 707.503 pixels, the land cover
change reaches 140.368 pixels (19,84%). From 2005-
2014, the change has declined pattern, it looked from
the percentage. The percentage of change 2005-2009
amount of 53.454 pixel (7,5%) and 2009-2014 around
21.828 pixels (3,0%). For the detail information, the
pattern of land cover changes Pekanbaru city present
in figure 4 below.
The next stage of the paper is the land cover anal-
ysis. We analyze the land cover change by using dis-
trict administration as a unit and classified it into two
classes (change and no change). We used the draft
of Spatial Regulation Document of Pekanbaru City
as other input. Pekanbaru city consists of 12 dis-
tricts with each district has different size and num-
ber of populations. Based on the analysis, we found
Spatiotemporal Analysis of Urban Land Cover: Case Study - Pekanbaru City, Indonesia
77
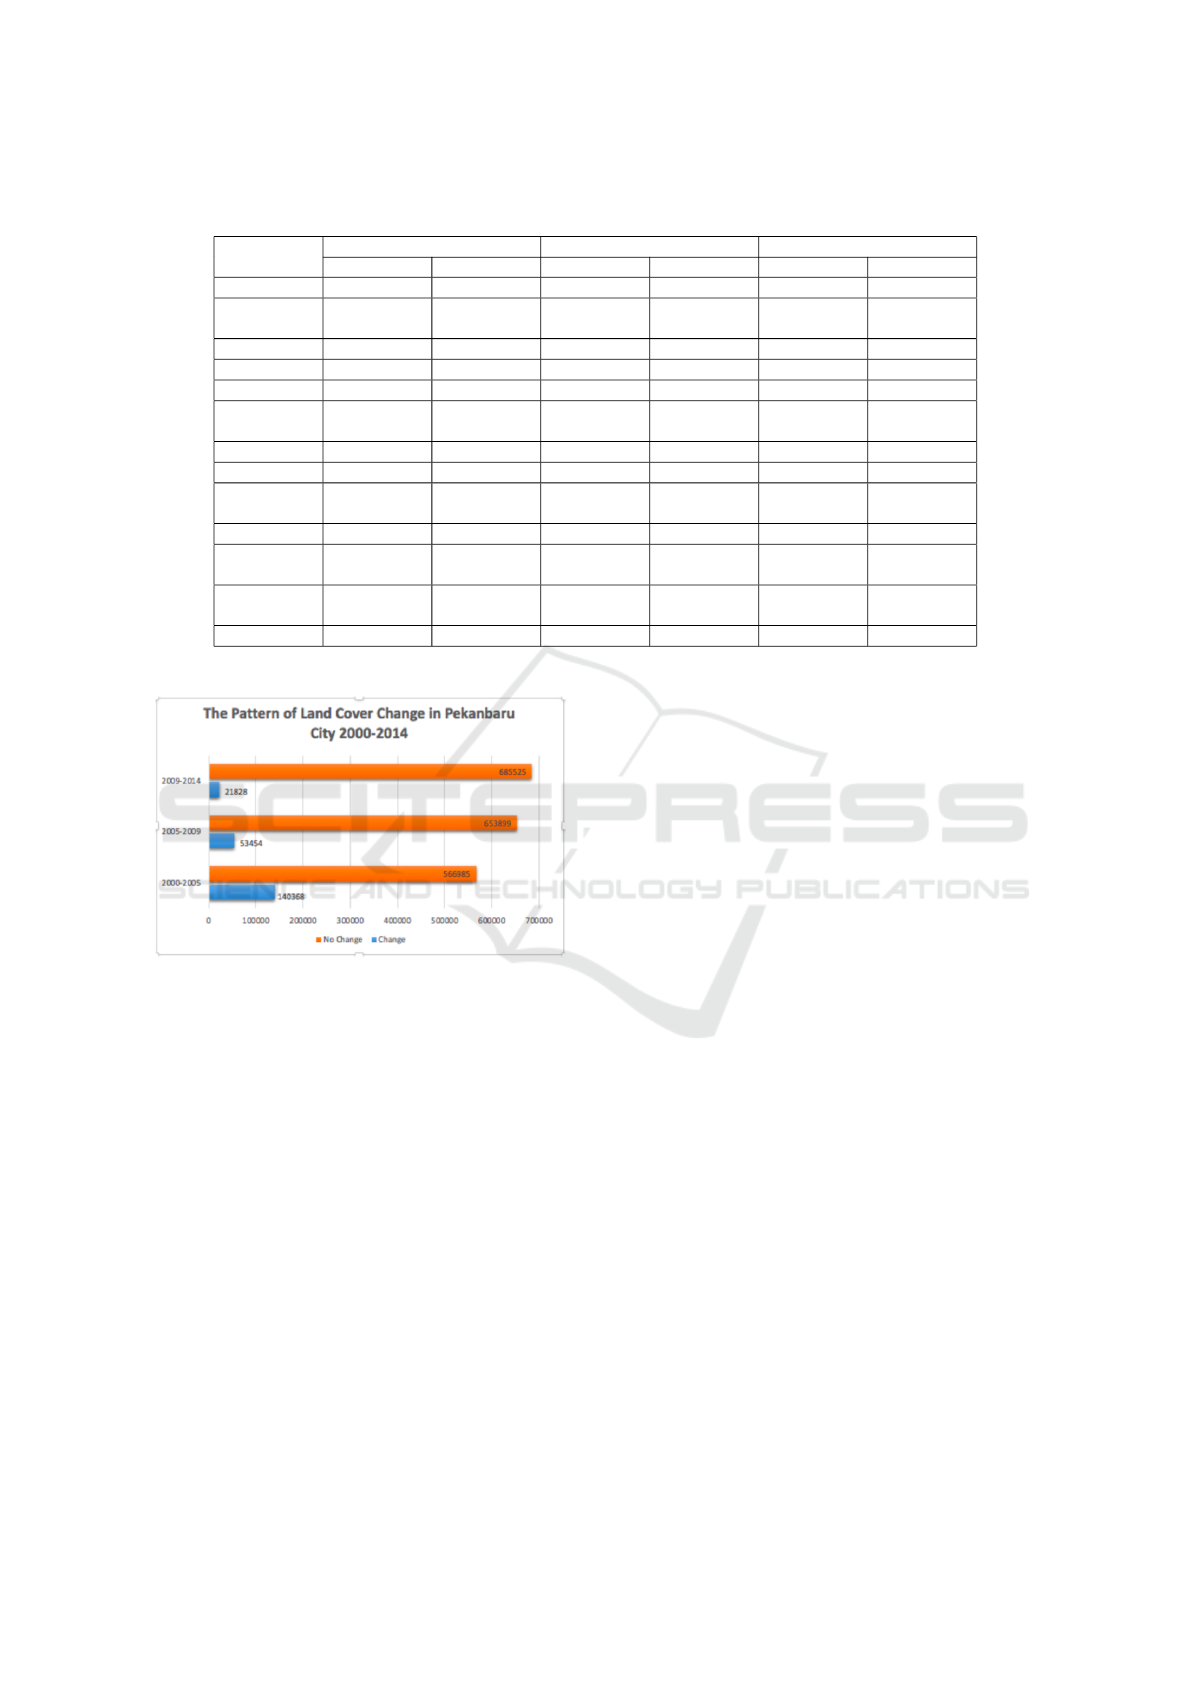
Table 5: The Number of Land Cover Change in Pekanbaru City 2000-2014 (pixel)
Districts
2000-2005 2005-2009 2009-2014
Change No Change Change No Change Change No Change
Tampan 30118 34024 2150 61992 1394 62748
Marpoyan
Damai
7404 26881 1252 33033 995 33290
Bukit Raya 7437 20391 1925 25903 652 27176
Sail 250 3622 ∗ 3872 ∗ 3872
Lima Puluh 346 6020 ∗ 6366 ∗ 6366
Pekanbaru
Kota
36 2316 ∗ 2352 ∗ 2352
Sukajadi 17 4258 ∗ 4275 ∗ 4275
Senapelan 81 3302 ∗ 3383 ∗ 3383
Payung
Sekaki
9240 38352 1960 45632 2290 45302
Rumbai 20101 125565 18327 127339 7627 138039
Rumbai Pe-
sisir
8289 165976 13398 160867 4956 169309
Tenayan
Raya
57049 136278 14442 178885 3914 189413
Total 140368 566985 53454 653899 21828 685525
Figure 4: The Pattern of Land Cover Change in Pekanbaru
City 2000-2014
that there were five districts has “no change” class
from 2005 until 2014. It could occur because they
located in the city centre with the least number of
the non- built up area were available. Commonly,
the other districts in Pekanbaru city have a decreasing
pattern. For example, Tampan district and Tenayan
Raya district has the high number of change during
2000- 2005, but decreasing in a heavy way by years.
It showed that during 2009-2014 there were approxi-
mately 1000-4000 pixel has been changed.
In over decades, Pekanbaru hit by land cover
change phenomenon as consequences of urban expan-
sions. The increasing of populations due to fertility
and migrations will impact the land cover conditions
in Pekanbaru city. During 2000-2014, the land cover
change in Pekanbaru city has a decreasing pattern.
The main reason was the limited access to the land
due to availability and land value. Based on the re-
search, people have the tendency to develop the land
around the edge of the city. So for the future, the
research related land cover change in the sub-urban
area of Pekanbaru city. Regarding the remote sens-
ing data, in this research, we used Landsat imagery
as the main input. It has the spatial resolution around
30 m. For future research, the used high resolution of
remote sensing data is needed.
4 CONCLUSIONS
For this paper, we can conclude some points there
were: 1) The land cover in Pekanbaru city was domi-
nantly by the built-up area. It shows by the percentage
of built-up area in 2014 was 59,99% from the total of
Pekanbaru city, 2) The accuracy of the land cover map
measured by using the short method. The mean index
of the accuracy was 85,17%, and 3) the land cover
change from the non-built up area into the built-up
area has the decreasing pattern. It’s related to land
availability and land value.
ACKNOWLEDGEMENTS
This paper is part of the research with the title “Mon-
itoring Perubahan Penutup Lahan Kota Pekanbaru
Menggunakan Citra Satelit Landsat” by Idham Nu-
graha and Faizan Dalilla. This research was funded
ICoSET 2019 - The Second International Conference on Science, Engineering and Technology
78

and fully support by LPPM of Universitas Islam Riau.
We thank all colleagues that involved in this research.
REFERENCES
(2020). Worldometers - real time world statistics.
Butt, A., Shabbir, R., Ahmad, S. S., and Aziz, N. (2015).
Land use change mapping and analysis using remote
sensing and gis: A case study of simly watershed, is-
lamabad, pakistan. The Egyptian Journal of Remote
Sensing and Space Science, 18(2):251–259.
Hegazy, I. R. and Kaloop, M. R. (2015). Monitoring ur-
ban growth and land use change detection with gis and
remote sensing techniques in daqahlia governorate
egypt. International Journal of Sustainable Built En-
vironment, 4(1):117–124.
Indrayani, P., Mitani, Y., Djamaluddin, I., and Ikemi, H.
(2017). A gis based evaluation of land use changes
and ecological connectivity index. Journal of Geo-
matics and Planning, 4(1):9–18.
Jensen, R., Gatrell, J., Boulton, J., and Harper, B. (2004).
Using remote sensing and geographic information
systems to study urban quality of life and urban for-
est amenities. Ecology and Society, 9(5).
Kausarian, H., Sumantyo, J. T. S., Putra, D. B. E., Suryadi,
A., et al. (2018). Image processing of alos palsar
satellite data, small unmanned aerial vehicle (uav),
and field measurement of land deformation. Interna-
tional Journal of Advances in Intelligent Informatics,
4(2):132–141.
NUGRAHA, I. (2016). Pemodelan Spasial Perubahan
Penutup Lahan Dalam Rangka Estimasi Debit Pun-
cak di Sub DAS Sail. PhD thesis, Universitas Gadjah
Mada.
Pekanbaru, B. P. S. (2016). Kota pekanbaru dalam angka
2016. Badan Pusat Statistik Kota Pekanbaru. Pekan-
baru.
Purwanto, A. and Bayuardi, G. (2016). Monitoring the
land use change in campus 2 stkip pgri pontianak.
Geoplanning: Journal of Geomatics and Planning,
3(1):77–86.
Star, J. and Estes, J. E. (1990). Geographic information
systems: an introduction, volume 303. Prentice Hall
Englewood Cliffs, NJ.
Sutanto, D. and Leung, C. H. (1999). Automatic index ex-
pansion for concept-based image query. In Interna-
tional Conference on Advances in Visual Information
Systems, pages 399–408. Springer.
Veldkamp, A. and Verburg, P. H. (2004). Modelling land
use change and environmental impact.
Wijaya, M. S. and Susilo, B. (2013). Integrasi model
spasial cellular automata dan regresi logistik biner un-
tuk pemodelan dinamika perkembangan lahan terban-
gun (studi kasus kota salatiga). Jurnal Bumi Indone-
sia, 2(1).
Yunus, H. S. (2005). Manajemen kota: perspektif spasial.
Pustaka Pelajar.
Spatiotemporal Analysis of Urban Land Cover: Case Study - Pekanbaru City, Indonesia
79
