
Image Segmentation of Nucleus Breast Cancer using Digital Image
Processing
Ana Yulianti
1
, Ause Labellapansa
1
, Evizal Abdul Kadir
1
, Mohana Sundaram
2
, and Mahmod Othman
2
1
Department of Informatics Engineering, Universitas Islam Riau, Pekanbaru, Indonesia
2
Department of Fundamental & Applied Sciences, Universiti Teknologi Petronas, Perak Darul Ridzuan, Malaysia
Keywords:
IHC Breast Cancer, ER/PR Receptor, Image Processing
Abstract:
One of examination methods of breast cancer cells is using Immunohistochemistry (IHC). IHC is used to
determine the status of Estrogen Receptor (ER) and/or Progesterone Receptor (PR). The bonding reaction
occurring between the cell and the painting results in the color of the nucleus cell being blue which signifies
the negative and brown ER/PR hormone for positive ER/PR. The given hormonal therapy will be effective to
breast cancer patients if they have positive ER/PR receptors. Up to now the Anatomy Pathology specialist
calculatses the percentage of positive cells that have been marked semiquantitatively. This is time-consuming,
costly, subjective and tedious, thereby impacting the length of time required in determining appropriate therapy
for breast cancer patients. This study analyze the image of IHC breast cancer to determine the assessment of
ER/PR hormone receptor using image processing. The use of kernels of different sizes shows differences in
the results of cell segmentation in connective tissue. The use of 3×3 and 1×1 kernels has indeed succeeded in
removing cells in the connective tissue, but not all cells in the connective tissue can be identified. If this step
has been completed, then the next process until cell count can be done.
1 INTRODUCTION
Breast cancer is a dangerous disease that occurs due
to the uncontrolled cells growth. One of examination
methods of breast cancer cells is using Immunohisto-
chemistry (IHC). IHC is used to determine the status
of Estrogen Receptor (ER) and/or Progesterone Re-
ceptor (PR). The IHC technique is performed by ap-
plying Hematoxylin and Diaminobenzidine and ob-
serving the antibody presence bonds by microscope
based on the observation by Pathologyst. The bond-
ing reaction occurring between the cell and the paint-
ing results in the color of the nucleus cell being blue
which signifies the negative and brown ER/PR hor-
mone for positive ER/PR. The given hormonal ther-
apy will be effective to breast cancer patients if they
have positive ER/PR receptors. IHC image Positive
estrogen receptors and negative show in the Figure 1.
Up to now the Anatomy Pathology specialist cal-
culatses the percentage of positive cells that have been
marked semiquantitatively. This is time-consuming,
costly, subjective and tedious (Limsiroratana and
Boonyaphiphat, 2009; Estrogen, ), thereby impacting
the length of time required in determining appropriate
therapy for breast cancer patients. This study will an-
(a) (b)
Figure 1: IHC image (a) Positive estrogen receptors (b)
Negative estrogen receptors
alyze the image of IHC breast cancer to determine the
assessment of ER / PR hormone receptor using digital
image processing which is expected to help doctors to
determine whether the breast cancer patients require
hormonal therapy or not.
(Kostopoulos et al., 2007; Calhoun et al., 2019)
provides a positive estrogen receptor assessment by
analyzing IHC images using a color texture feature.
Assessment of positive ER receptor status with com-
puter method is done through 2 stages, ie. stage I
of segmentation of nucleus using Otsu’s global im-
age threshold method and morphology operation and
stage II classification of nucleus based on brown
and blue color using feature selection and K-Nearest
64
Yulianti, A., Labellapansa, A., Kadir, E., Sundaram, M. and Othman, M.
Image Segmentation of Nucleus Breast Cancer using Digital Image Processing.
DOI: 10.5220/0009105900640067
In Proceedings of the Second International Conference on Science, Engineering and Technology (ICoSET 2019), pages 64-67
ISBN: 978-989-758-463-3
Copyright
c
2020 by SCITEPRESS – Science and Technology Publications, Lda. All rights reserved
Neighbors weighted voted (KNN-WV).
(Yulianti et al., 2014; Akbari et al., 2011) seg-
mented the immunohistochemical image of estrogen
receptor to breast cancer using watershed marker.
(Labellapansa et al., 2016) conducted a similar study
but using the IHC HER2 method for scores of 1+ and
3+ and the classification can be done correctly 100%
for scores of 3+ and 65% for scores of 1+.
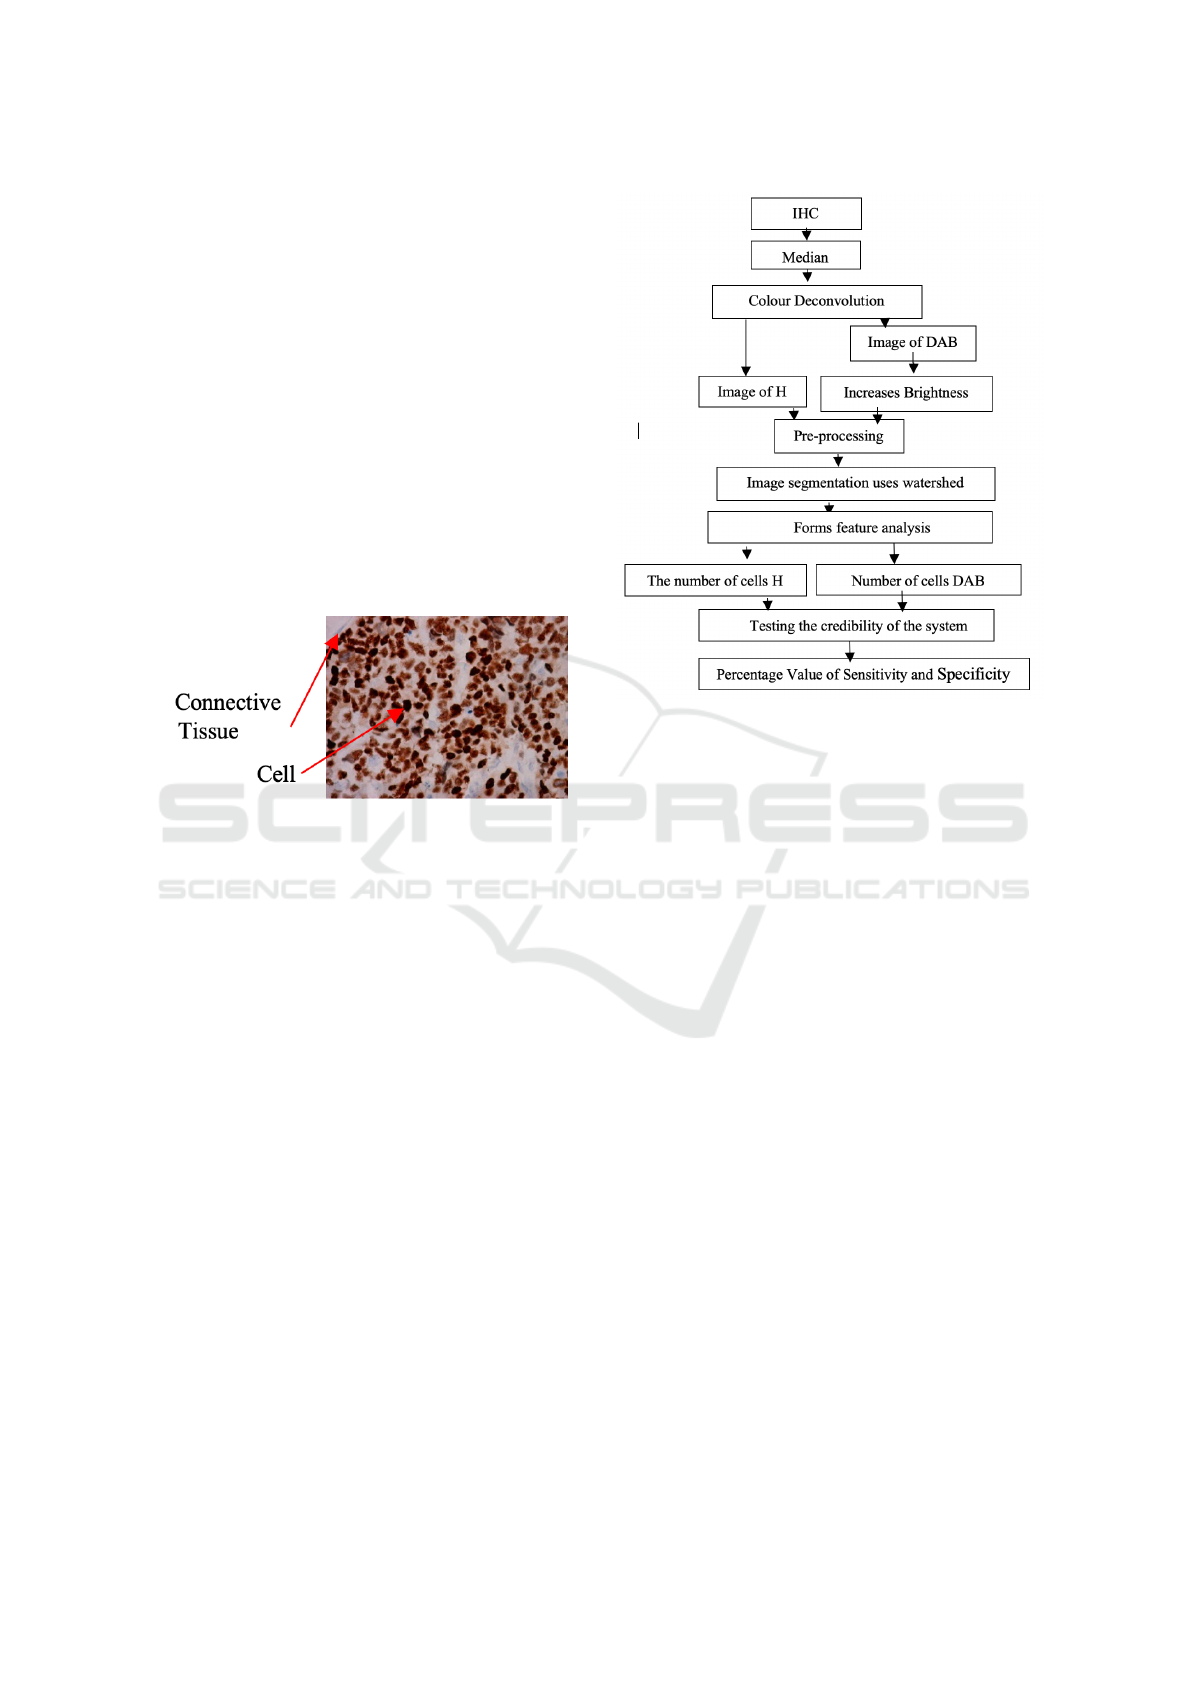
This study was able to indicate the status of ER /
PR and remove the stacked cell area however the con-
nective tissue cell that is not a nucleus cell counts as
ER / PR cell as shown in Figure 2. Our research will
make image improvements by removing connective
tissue that is not a nucleus cell which hopefully will
be able to calculate the number of ER / PR cells in
more detail.
Figure 2: IHC image positive estrogen receptors
2 RESEARCH METHOD
The first step is done by acquiring positive / negative
images of ER / PR in the lab Medicine Faculty of Ga-
jah Mada University. The phases of pre processing
the imagery are done by using the median filtering
method. The clean image of the noise, will enter the
segmentation stage to separate the blue area (negative
cell ER / PR) and brown area (positive cell ER / PR)
using colour deconvolution. The Color deconvolution
method can read the colors of each channel Red Green
Blue (RGB)(Ruifrok et al., 2001). Watershed is used
to separate the stacked cell area using color decon-
volution. The next step which is the most important
contribution in this study is to identify the connective
tissue that is not a cell. The shape feature will be used
to remove this connective tissue area. The next step
is to calculate the portion of positive cell and nega-
tive cell so that can be identified whether the image is
positive ER / PR or negative. Flow Chart of Research
Activities as shown in Figure 3.
Figure 3: Flow Chart of Research Activities
3 RESULT AND DISCUSSION
The phases of nucleus IHC breast cancer image seg-
mentation are shown in Figure 4. The input image
(a) is pre-processed using the median filter (b) then
color segmentation is done using color deconvolution
so that the image of channel 1 H (c) and channel 2
DAB Positive (d) The next step is to separate the ac-
cumulated cells in the H image and the positive DAB
image by using watershed marker segmentation. Fig-
ures 4 (e) and (f) are the results of the segmentation
so that it is expected that the number of cells can be
calculated.
Morphological reconstruction was carried out af-
ter the process in Figure 4 was completed. Mor-
phological reconstruction is a morphological transfor-
mation involving two images and one structural ele-
ment. The first image is the start point of transfor-
mation, commonly referred to as the marker and the
second image as a constraint, commonly referred to as
a mask. The process of morphological transformation
is based on the concept of pixel neighbors using struc-
tural elements (Gonzalez et al., 2002). Pixel neighbor
operation is an image processing operation to get the
value of a pixel that involves neighboring pixel values
and is mostly used for form analysis (Kadir, 2017).
The use of kernels of different sizes shows differ-
ences in the results of cell segmentation in connective
tissue. This study uses a kernel size of 3x3 and 1x1.
Image Segmentation of Nucleus Breast Cancer using Digital Image Processing
65

(a)
(b)
(c)
(d)
(e)
(f)
Figure 4: The Stage of IHC Nucleus Image Segmenta-
tion Stage of Breast Cancer (a) Image of estrogen recep-
tor (b) Image Resulted by Median filtering (c) Image H Re-
sulted by colour Deconvolution (d) Image DAB Resulted by
Colour Deconvolution (e) Image H Resulted by Watershed
(f) Image DAB Resulted by Watershed
(a) (b)
Figure 5: Image of the result of using (a) 3x3 Kernel Size
(b) 1x1 kernel size
Figure 5 is the result of cell segmentation in connec-
tive tissue using a 3x3 and 1x1 disk kernel. It is seen
that cells in the connective tissue are still counted as
many cancer cells while using a 1x1-sized kernel seen
in cells in the connective tissue there are not many
counts.
Based on the results seen in figure 5, the use of
3x3 and 1x1 kernels has indeed succeeded in remov-
ing cells in the connective tissue, but not all cells in
the connective tissue can be identified. This research
will be continued by using other methods to remove
cells in connective tissue. If this step has been com-
pleted, then the next process until cell count can be
done.
4 CONCLUSIONS
From the steps that have been done above, some re-
sults are obtained, namely stages of digital image pro-
cessing to read IHC breast cancer images to obtain
H cell counts and positive DAB cell numbers begin-
ning with the pre-processing process using Median
Filtering, then proceed with colour segmentation us-
ing Colour Deconvolution to obtain IHC H images
and positive DAB IHC images and followed by cell
segmentation using Watershed Markers. The use of
3x3 and 1x1 kernels has indeed succeeded in remov-
ing cells in the connective tissue, but not all cells in
the connective tissue can be identified. This research
will be continued by using other methods to remove
cells in connective tissue. If this step has been com-
pleted, then the next process until cell count can be
done.
ACKNOWLEDGEMENTS
High appreciation should be given to Universitas Is-
lam Riau (UIR) and Universiti Teknologi Petronas
(UTP) for their support in matching grant of this re-
search work.
REFERENCES
Akbari, H., Uto, K., Kosugi, Y., Kojima, K., and Tanaka, N.
(2011). Cancer detection using infrared hyperspectral
imaging. Cancer science, 102(4):852–857.
Calhoun, M. E., Chowdhury, S., and Goldberg, I. (2019).
Medical analytics system. US Patent 10,255,997.
Estrogen, S. C. I. R. Kanker payudara menggunakan marker
watershed.
Gonzalez, R. C., Woods, R. E., et al. (2002). Digital image
processing.
Kadir, A. (2017). Teori dan aplikasi pengolahan citra.
Kostopoulos, S., Cavouras, D., Daskalakis, A., Bougioukos,
P., Georgiadis, P., Kagadis, G. C., Kalatzis, I., Rava-
zoula, P., and Nikiforidis, G. (2007). Colour-texture
based image analysis method for assessing the hor-
mone receptors status in breast tissue sections. In 2007
29th Annual International Conference of the IEEE
Engineering in Medicine and Biology Society, pages
4985–4988. IEEE.
Labellapansa, A., Muhimmah, I., and Indrayanti (2016).
Segmentation of breast cancer cells positive 1+ and 3+
immunohistochemistry. In AIP Conference Proceed-
ings, volume 1718, page 110002. AIP Publishing.
Limsiroratana, S. and Boonyaphiphat, P. (2009). Computer-
aided system for microscopic images: application
to breast cancer nuclei counting. INTERNATIONAL
JOURNAL OF APPLIED, 2(1):69.
ICoSET 2019 - The Second International Conference on Science, Engineering and Technology
66

Ruifrok, A. C., Johnston, D. A., et al. (2001). Quantifi-
cation of histochemical staining by color deconvolu-
tion. Analytical and quantitative cytology and histol-
ogy, 23(4):291–299.
Yulianti, A., Muhimmah, I., and Indrayanti, I. (2014).
Segmentasi Citra Imunohistokimia Reseptor Estro-
gen Kanker Payudara menggunakan Marker Water-
shed. Seminar Nasional Informatika Medis (SNIMed),
0(5):1–10.
Image Segmentation of Nucleus Breast Cancer using Digital Image Processing
67
