
The Relationship between E-Service Quality and Customer
Satisfaction Evidence on Online Transportation Services in Indonesia
Ady Widjaja
1
, Widji Astuti
2
, Abdul Manan
2
1
Universitas Budi Luhur
2
Universitas Merdeka Malang
Keywords: GOJEK, Application, driver.
Abstract: To date, in Indonesia, online delivery service has become a new trend in selling transaction in the urban
community. The utilization of two-wheeled vehicle is the privilege for alternative service delivery, regardless
of whether it is conveying the merchandise or convey customer the proposed spot. PT. GOJEK is a company
that provides services for delivery-based android applications. Customers only need an internet connection to
use the service Gojek. This study examines the influence of customer satisfaction on customer loyalty against
PT GOJEK Indonesia. As for the methods used for the collection of data using simple random sampling and
to process data using Partial Least Square (PLS) as well as to review the analysis of the influential factors on
the E-Service Quality and Customer Satisfaction using Importance Performance Analysis (IPA). The results
of this research show that E-Service Quality is very effecting on customer Satisfaction PT. GOJEK Indonesia
so the PT GOJEK should retain customer satisfaction
1 INTRODUCTION
PT. GO-JEK Indonesia has been a pioneer and
pioneer organization occupied with e-commerce
based business in the industrial revolution. GO-JEK
provided services with many features in the
application. The nearness of internet business on GO-
JEK is relied upon to help address the community
needs and encourage the transportation of Indonesia
in completing day by day exercises. Now, two-
wheeled vehicle application or online taxi are being
well-known. Simple, cheap, safe, and quick are
offered by them that is needed by the community.
Particularly for transportation on the boulevards are
congested, altogether not to take additional time on
the outing, at that point an online arrangement.
Traditional taxi transportation with transport-taxi
online application has fundamental differences. They
also make it easy because everyone in Jakarta can get
the app with download it on their smartphone. By
using the application, it will be associated with a cab
driver on the web, online taxi, and the driver will go
to a customer in the predefined area to convey client
or request to the goal. It's very helpful to everyone.
They will tell the exact place where the driver needs
to pick up, and the application itself will calculate the
cost to be paid
2 LITERATURE REVIEW
2.1 Customer Satisfaction
In today situated business condition, it tends to be
said seemingly that the inquiry of how to fulfill clients
turns into a definitive worry of the majority of the
organizations in any sort of business. Customer
satisfaction is the evaluation after the purchase of the
selected alternative is at least equal or exceed
customer expectations, while dissatisfaction arose
when the result (result) does not meet expectations
(Engel, et al., 1995:187). We believe that feeling
pleasure or disappointment after comparing
perceived product is important, and the customer will
have disappointed if the performance is behind their
expectations and if not they will be satisfied, but if it
is more than that they would be happy and definitely
satisfied. Kotler and Keller (2012, 10) hold that
Satisfaction reflects the perceived product
performance assessment in conjunction with hope.
Widjaja, A., Astuti, W. and Manan, A.
The Relationship between E-Service Quality and Customer Satisfaction Evidence on Online Transportation Services in Indonesia.
DOI: 10.5220/0008931501830188
In Proceedings of the 1st International Conference on IT, Communication and Technology for Better Life (ICT4BL 2019), pages 183-188
ISBN: 978-989-758-429-9
Copyright
c
2020 by SCITEPRESS – Science and Technology Publications, Lda. All rights reserved
183
2.2 E-Service Quality
E-Service Quality is the expansion of the ability of a
web site for easy shopping, purchasing, and
distribution effectively and efficiently (Chase,
Jacobs, Aquilano &, 2006). Information Quality,
Security, Website Functionality, Customer
Relationship, and Responsiveness and Fulfilment are
the five dimension of how to measure e-servicee
quality. Each dimension can be explained as follows:
a. Information Quality is the available
information on the website is the main
component of the perceived quality of service.
Security with regard to how a proven
trustworthy website for customers. Online
services are done well, and fluently can build
trust and confidence to customers.
b. Dimensions of Website Functionality consists
of three aspects. Navigation is concerned with
how easy the users searching for information
on websites. It is considered a staple in terms
of the build quality of service. The second
aspect, access the website, refer to the user's
ability to access resources (including
information related to travel and service
features)
c. On the dimensions of the Customer
Relationship, a virtual community that
developed in a website can be considered a
social organization online to provide users and
customers with the opportunity to share
opinions and exchanging information among
the community of Gojek. View of Armstrong
and Hagel (2001) about the virtual community
it can be concluded that a virtual community
can unify information and society into a
relationship. Features of the services provided
by the website give the opportunity to the user
(users) to interact with other users. Two-way
communication helps users to search for
information, making buying decisions, and
giving feedback or input to the website. This
relationship can be developed through
interaction with an online community that
allows users to participate, learn, and interact
online.
d. Then the dimensions of Responsiveness and
Fulfilment is measured based on the timeliness
of a website that responds to the customer in an
online environment, such as how to answer
questions from customers with fast and
efficient or how needs and can respond to
customer complaints via email politely. These
problems conceptually are a component of the
dimension of responsiveness.
e. The dimensions of fulfillment refer to a
website's success in delivering products or
services and its ability to correct errors that
occurred during the transaction process. The
website seeks to minimize dissatisfaction with
service provided will achieve a higher level of
an evaluation of the quality provided by the
customer).
2.3 Partial Least Square (PLS)
As indicated by Imam Ghozali (2006:1) the technique
for Partial Least Square (PLS) is clarified as pursues:
Model-based fluctuation structure condition. To
measure the unmeasurable PLS latent variables has
been able to describe it and using the indicators for
the manifest variables. This model was created as an
option for circumstances where essential hypothesis
on structuring a model of weak or markers that are
accessible don't meet model estimations of reflexive.
2.4 Importance Performance Analysis
(IPA)
To know what could contribute to higher satisfaction
of users, we can use a method called Importance-
performance analysis (IPA) that can help to identify
important performance factor what must be
demonstrated by an organization. This was
introduced by John A. Martilla and John C. James
(1977). The results of the research quadrant Martilla
and James exemplified as follows:
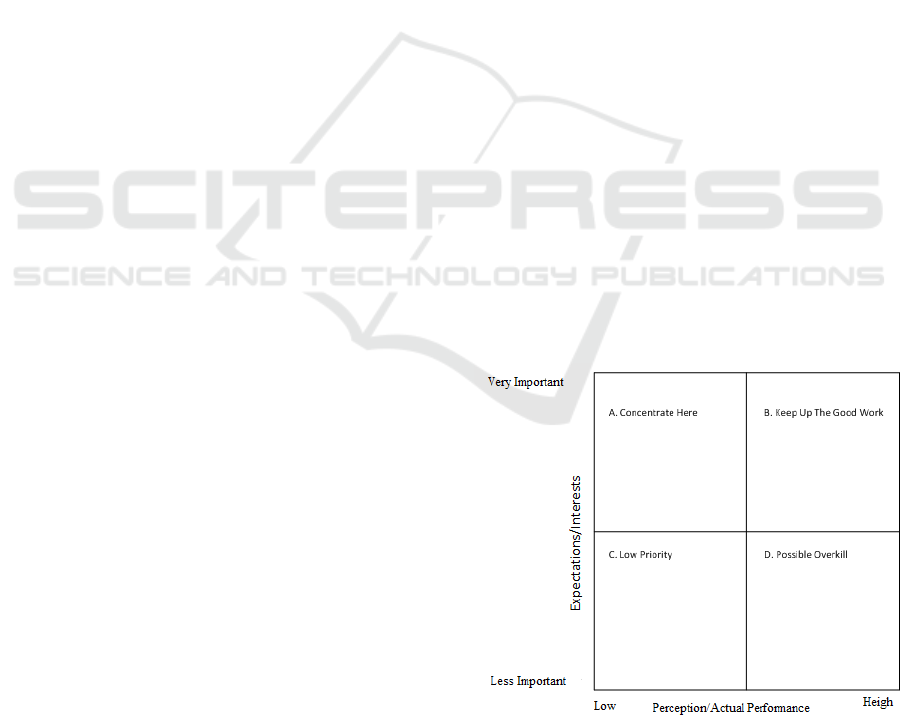
Figure 1: IPA MATRIX
A. Concentrate Here.
ICT4BL 2019 - International Conference on IT, Communication and Technology for Better Life
184
In this quadrant, ‘Concentrate Here' factor is an
important and a priority for improvement because we
know that in this quadrant the expectation of them is
high, but the actual performance of the product has
not been satisfactory, so the company is being liable
to improve the performance of a variety of factors.
B. Keep up with the good work.
Components that lie in this quadrant are viewed as
significant and expected as a supporting variable for
consumer satisfaction so the company will be obliged
to guarantee that the presentation of the
establishments can keep on keeping up the
accomplishments has been accomplished.
C. Low Priority.
In here, we know that actual performance levels are
low because the consumers also have a low
expectation, so they don't need to move their attention
to the factors.
D. Possibly Overkill.
Components that lie in this quadrant isn't considered
excessively significant, so the executives need to
distribute assets that are related with those variables
to different elements that have the higher taking care
of need still needs improvement, for example, in
quadrant B.
3 METHODOLOGY
Data collection was done through the survey by way
of spreading the questionnaire to respondents defined
by researchers that have enjoyed the service GO-
RIDE from PT. GO-JEK Indonesia. The responses
collected were 230 respondents in total, which using
the Simple random sampling technique. Of research
results are disseminated through the questionnaire
most users Gojek with the purpose to House 75
people with percentage of 37%, then the Office 77
people with 39% and the percentage of the Campus
as much as 15 people with percentage of 8% as well
as public places as many as 33 people with percentage
of 16%. Furthermore, the respondents were given the
opportunity to fill in statements such as that indicated
in the questionnaires by giving the sign of the cross
(X) in accordance with the opinion, judgment or
perception of the observations of the respondents. As
for the data-processing tools to use with Smart-
software PLS.
4 RESULTS AND DISCUSSION
4.1 Research Instrument
To do the research, we used the questionnaire as an
instrument in this study with some of the statement.
The method is a primary data that means it's a data
from a respondent that we feel perfect fit for this. In
total, we have 200 respondents to answer the
statement with a graphic rating scale. Here, the detail
in the research instrument:
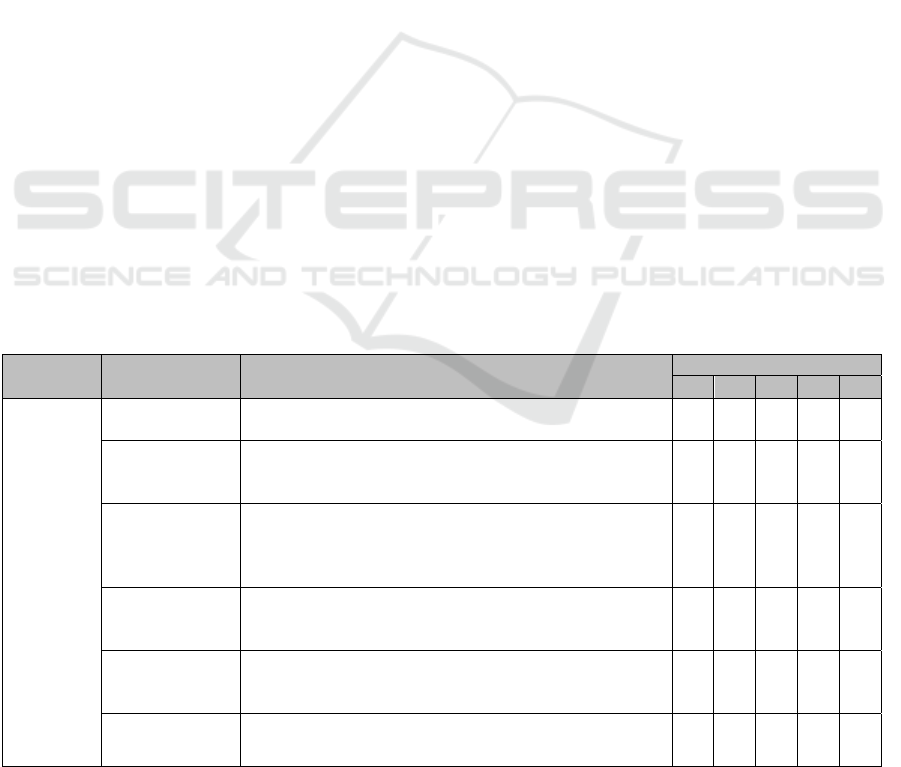
Table 1: Research Instrument Variable of E-Service Quality
Variabel Indicator Statement Item Score
1 2 3 4 5
E-Service
Quality
1. Information
Quality
a. Information in application is clearly
b. The content I visited is up to date
2. Security a. I believe that protecting the privacy of customers
b. PT. GO-JEK ensure the security of the personal data
of users of their online
3.Website
Function
a.application design can I operate
b.Application Gojek can be accessed at anytime
c.I get I am looking from the relationships between
pages in the application
4. Customer
Relationship
a.Driver's Gojek polite in serving passengers
b.Taxi driver online explains the information properly
regarding the location requested
5. Responsive
ness
a.Online taxi route information to clearly explain to
customers
b.The use of rating a driver help acceleration services
6.Fullfilment a.Drivers deliver to destination
b.Online taxi explains requested/destination
The Relationship between E-Service Quality and Customer Satisfaction Evidence on Online Transportation Services in Indonesia
185
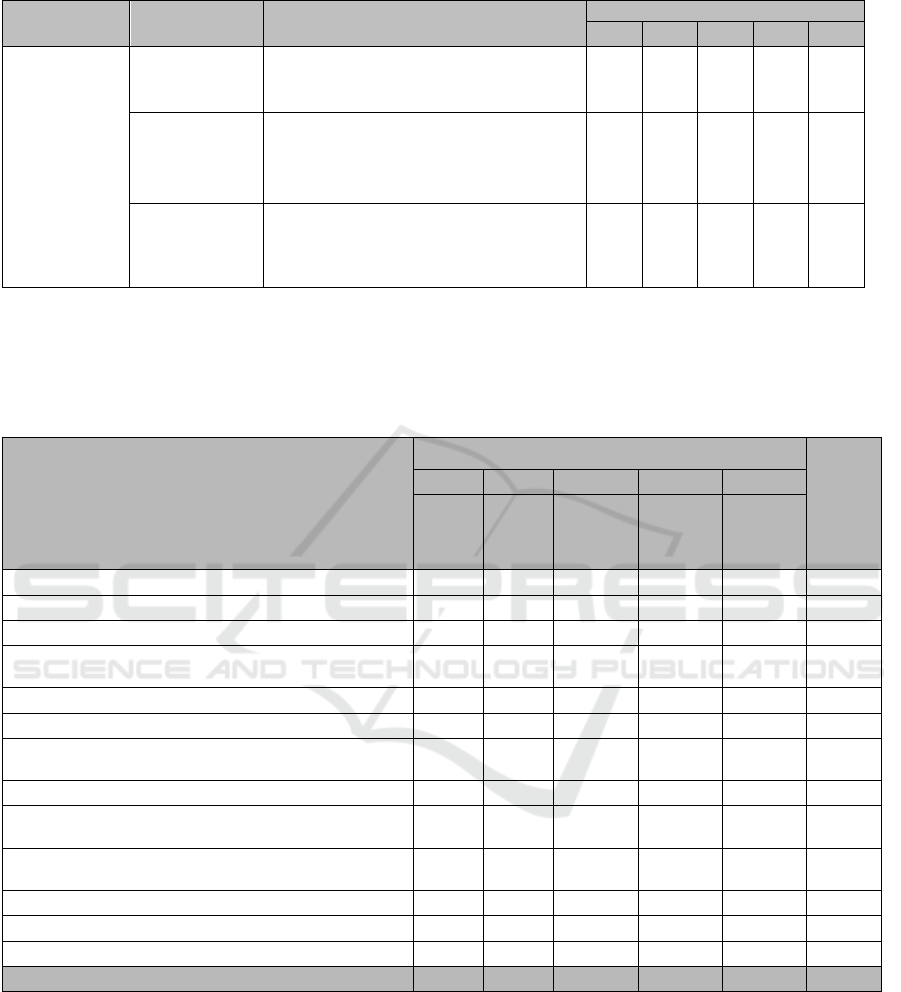
Table 2: Research Instrument Variable of Customer Satisfaction
Variable Indicator Statement Items Score
1 2 3 4 5
Customer
Satisfaction
1. Satisfy
Customer
Expectation
a. Ojek online alternative
transportation congestion
b. Ojek online escorted safely
2. Easy to
obtaining
a. Ojek online serving customers
for 24 hours.
b. I didn't wait for long time in
need of transportation ojek online
3.Willingness
to recommend
a. I invite a friend to use the ride
gojek
b. I Suggest my brother to use
ride-Gojek
4.2 Description of Analysis Results
a. Result Analysis Variable E-Service Quality
Table 3: Result Analysis Variable E-Service Quality
Statement
Scale
Mean
1 2 3 4 5
STS TS N S SS
Information in application is clearly
5 5 23 103 64 4.08
The content I visited is up to date
2 6 25 107 60 4.09
I believe that protecting the privacy of customers
2 12 49 105 32 3.77
PT. GO-JEK ensure the security of the personal data
of users of their online
2 10 47 102 39 3.83
application design can I operate 2 5 13 110 70 4.21
Application Gojek can be accessed at anytime 1 2 19 112 66 4.20
I get what am looking from the relationships between
pages in the application
1 4 20 134 41 4.05
Driver's Gojek polite in serving passengers
1 3 56 109 31 3.83
Taxi driver online explains the information properly
regarding the location requested
3 5 43 114 35 3.87
Online taxi route information to clearly explain to
customers
2 15 44 114 25 3.73
The use of rating a driver help acceleration services
1 14 42 116 27 3.77
Drivers deliver to destination
2 6 19 133 40 4.02
Online taxi explains requested/destination
2 10 42 109 37 3.85
Percentage & Average (%) 1.00 3.73 17 56.46 21.81 3.94
Notes :
STS : Strongly Disagree
TS : Not Agree
N : Neutral
S : Agree
SS : Very Agree
As we can see, from table 3.3 that the mean is 3.94 and they agreed for 56.46%, which means that E-servicee
quality provided by GO-JEK goes well.
b. Result Analysis Variable Customer Satisfaction
ICT4BL 2019 - International Conference on IT, Communication and Technology for Better Life
186
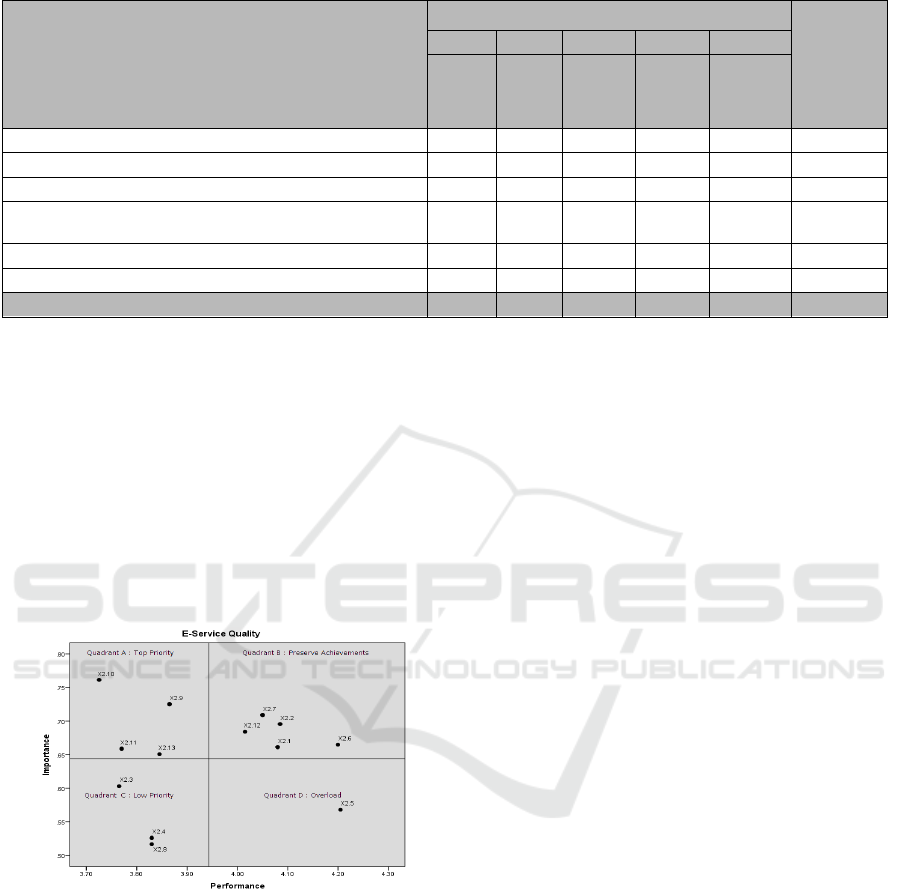
Table 4: Result Analysis Variable Customer Satisfaction
Statement
Scale
Mean
1 2 3 4 5
STS TS N S SS
Ojek online alternative transportation congestion
3 4 21 110 62 4.12
Ojek online escorted safely
7 8 33 88 64 3.97
Ojek online serving customers for 24 hours.
23 6 49 86 36 3.53
I didn't wait for long time in need of transportation ojek
online
3 16 64 87 30 3.63
I invite a friend to use the ride gojek
15 19 27 98 41 3.66
I Suggest my brother to use ride-Gojek
7 17 30 115 31 3.73
Percentage & Average (%) 4.83 5.83 18.67 48.67 22.00 3.77
Notes :
STS : Strongly Disagree
TS : Not Agree
N : Neutral
S : Agree
SS : Very Agree
From table 3.4 that percentage and the average agreed amounted to 48.67% which means that the customer
was satisfied against the drivers GOJEK.
4.3 Quadrant IPA
a. E-Service Quality
Figure 2: Quadrant IPA E-Service Quality
Variable E-Service Quality indicators X2.9 (Taxi
Driver online explains the information properly
regarding the location requested), X2.10 (online Taxi
route information to clearly explain to customers),
X2.11 (use of rating a driver help acceleration
Ministry) and X2.13 (Gojek describes the information
properly regarding the requested location) into A
Quadrant that is a top priority (Concentrate Here) so
that the indicator X2.9 (Taxi Driver online explains
the information properly regarding location asked),
X2.10 (online Taxi route information to clearly
explain to customers), X2.11 (use of rating a driver
help service acceleration) and X1.13 (Gojek describes
the information properly regarding the location
requested) that are considered important and or effect
on customer satisfaction, so that the parties are
companies need to concentrate on allocating its
resources to improve performance that goes on in this
quadrant. On indicators X2.1 (information on
application clear) X2.2 (the content of the application
that I visit up to date), X2.6 (application Gojek can be
accessed at anytime), X2.7 (I get I am looking from
the relationships between pages in the application)
and X2.12 (Driver deliver to destination) belonging
to the B Quadrant i.e. Preserve Achievements (Keep
Up The Good Work) so X2.1 (information on
application clear) X2.2 (the content of the application
that I visit up to date), X2.6 (application Gojek can be
accessed at anytime), X2.7 (I get my search of the ties
between pages in the application) and X2.12 (Drivers
accompany to goal) is an important indicator as a
supporting factor for customer satisfaction and the
company is obliged to maintain the achievement of
performance such. On indicators X2.3 (I believe that
protecting the privacy of their online customers),
X2.4 (PT. GO-JEK ensure the security of users
personal data online taxi) and X2.8 (Driver Gojek
polite in serving passengers) entrance Quadrant C low
priority (i.e. Low Priority) so that the indicator X2.3
(I believe that protecting the privacy of their online
customers), X2.4 (PT. GO-JEK ensure the security of
The Relationship between E-Service Quality and Customer Satisfaction Evidence on Online Transportation Services in Indonesia
187
users personal data online taxi) and X2.8 (Driver
Gojek polite in serving passengers) are not too
important so that companies do not need to prioritize
or to give more attention to the indicators. And on
indicator X2.5 (design applications can I run) into
quadrant D (Possibly Overkill) so that the indicator
X2.5 (I can operate the application design) are not too
important and less influence on satisfaction customer.
so the company better allocate resources related to
these indicators to the indicators of other more have a
higher priority level
b. Customer Satisfaction
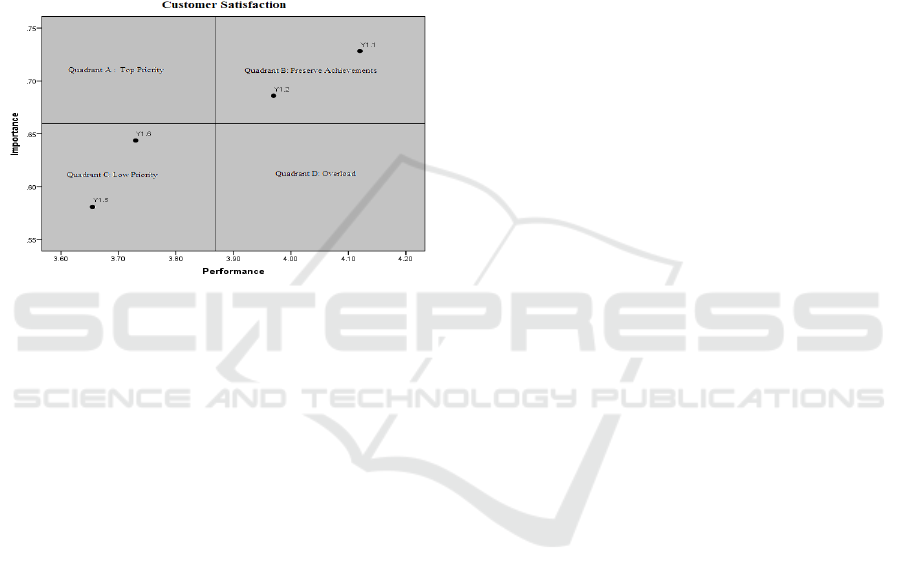
Figure 3: Quadrant IPA Customer Satisfaction
From IPA with customer satisfaction, the variable
Y1.1 and Y1.2 are in the same quadrant name
‘Preserve Achievement' or Keep up the good work,
meanwhile, the variable Y1.5 and Y1.6 are in the
quadrant ‘Low Priority.' It means that they need to
focus on Y1.1 and Y1.2 because those two variable
are two indicators to customers and the company
needs to maintain the performance accomplishment
and the others two factors is not too influential, so
they don't need to focus on those two.
5 CONCLUSION
After through the research, the influence of E-Service
Quality towards customer satisfaction the conclusion
to be drawn as follows: E-Service Quality influence
the customer satisfaction as we can look that t-test
statistic gives value for 6.041, Reliability test results
obtained from the value of the Cronbach's Alpha E-
Service Quality is 0.77 and customer satisfaction is
0.89 Means the variable reliable or consistent, From
the quadrants of IPA concerning E-Service Quality
can note that indicator X2.9, X2.10, X2.11 and X2.13
considered important and effect on customer
satisfaction, so that the parties need to concentrate
companies to allocate resources to improve its
performance in this quadrant, and from IPA, the
company need to focus on Y1.1 and Y1.2 to get the
maximum of customer satisfaction
REFERENCES
Chase, R. B., Jacobs, F. R., and Aquilano, N. J. 2006.
“Operations Management for Competitive Advantage”.
New York : McGraw-Hill
Engel, James F, Blackwell, Roger D., and Miniard, Paul
W.. 1995. “Consumer Behavior. 8th Editino”. Dryden
Press: Fort Worth
Ghozali, Imam, 2006, Structural Equation Modeling
Metode Alternatif dengan Partial Least Square, Badan
Penerbit Universitas Diponegoro, Semarang
Hagel, J. and Armstrong, A .1997. “Net Gain: Expanding
Markets through Virtual Communities”. Harvard
Business SchoolPress : Cambridge
Ho.C.I and Lee Y.L .2007. “The development of an E-travel
Service Quality Scale”. Tourism Management : 1434-
1449
Kotler, Philip., (2006), Marketing, 6th ed., Frencks Forest,
NSN: Pearson Education Australia.
Kotler, Philip, (2012), Marketing Management, 14th
Edition, Prentice Hall, New Jersey
Martilla dan John C. James. 1977. “Importance-
Performance Analysis.” Journal of Marketing, Vol. 41
No. 1 Januari 1977 : 77-79
Sudarmanto, R, Gunawan. 2005. Multiple Linear
Regression Analysis with SPSS. Yogyakarta : Graha
Ilmu
ICT4BL 2019 - International Conference on IT, Communication and Technology for Better Life
188
