
Analysis of the Relationship between Productivity and Technology
Content in MSMEs in Indonesia
Indah Rahayu Lestari, Rinny Meidiyustiani, Anita Wahyu Indrasti, Berlian Karlina
Universitas Budi Luhur
berlian.karlina@budiluhur.ac.id.
Keywords: Technology Innovation, Human Resources, Leadership, Information Technology, Technology Content,
Productivity.
Abstract: Entering the era of globalization, Indonesian MSMEs have experienced growth from years. With the
development of MSMEs, the use of information technology should not be just making financial reports.
Information technology can be used to increase business transformation in MSMEs, through speed, accuracy,
and efficiency of the exchange of information produced. This matter which caused the utilization of MSME's
technology, was still in a low level. Samples in this research are MSMEs in Indonesia. The results of this
study are technological innovation, human resources, leadership does not affect technological content, while
information technology affects technological content, and technological content affects productivity.
1. INTRODUCTION
Based on data from the Central Statistics Agency
(BPS), the development of MSMEs in Indonesia
entering the industrial era 4.0 continues to develop.
The estimated number of micro, small and medium
enterprises in Indonesia in 2018 is 58.97 million
business units, consisting of 58.91 million units of
small businesses, 59,260 units of micro businesses,
and 4,987 medium enterprises. With the development
of MSMEs, the use of information technology should
not be just making financial reports. Information
technology can be used to increase business
transformation in MSMEs, through speed, accuracy,
and efficiency of the exchange of information
produced. This matter which caused the utilization of
MSME's technology, was still at low level. According
to Smith (2007), the use of technology can be done
through four components, namely: technoware,
humanware, infoware, organware. Where the four
terms of the component are technology content.
2. LITERATURE REVIEW
Technology Innovation
In the development of technology, innovation must be
supported in order to meet the needs of the
community, so that an evaluation is needed at the
level of technological innovation used in a business.
There are five indicators of evaluation capabilities in
technology innovation: research and development
capabilities, innovation capabilities in decision
making, marketing capabilities, production
capabilities, and capital capabilities (Wang et al.,
2008).
Human Resources
Management of resources as technology operators
can optimize the use of existing technology.
Strategies that need to be done in managing human
resources affect all lines of business of the company.
Research on human resource management. The
measurement of competency from human resources
consists of knowledge, skill, ability (Ardiana et al,
2010).
Lestari, I., Meidiyustiani, R., Indrasti, A. and Karlina, B.
Analysis of the Relationship between Productivity and Technology Content in MSMEs in Indonesia.
DOI: 10.5220/0008930201130117
In Proceedings of the 1st International Conference on IT, Communication and Technology for Better Life (ICT4BL 2019), pages 113-117
ISBN: 978-989-758-429-9
Copyright
c
2020 by SCITEPRESS – Science and Technology Publications, Lda. All rights reserved
113

Leadership
Facing increased dynamic and growing business
competition, an effective and efficient management
system is needed so that the organization can be
viewed as an open system that can be responded to
and accommodated by external changes quickly and
efficiently. One of the important things in this regard
is leadership. Leadership is a process where a person
becomes a leader through continuous activities, so
that he can influence those who are led in order to
achieve the goals of an organization (Brahmasari,
2008).
The most significant factors that influence
leadership are bearers of change, communication,
leadership in work, networking, development of
others (Woworuntu, 2003).
Information Technology
The use of information technology is a user of
computer technology that deals with processing data
into information, and the limit of the process of
distributing data/information within a specific time
limit (Hamdani Harfan, 2012).
Information technology users support the
company's operational activities which are the
primary needs as one of the competitive strategies.
The use of information technology requires the
wearer to use the system to be able to achieve
company goals by utilizing information technology.
Apart from being computer technology to process and
store information, information technology also
functions as a communication technology for
information dissemination.
Information technology resources are an element
that is highly highlighted by Objective for
Information and Related Technology (COBIT)
Control, including fulfilling business needs for
effectiveness, efficiency, confidentiality, integration,
availability, policy compliance, and information
reliability (Anggraini, 2009).
Technology Content
Technology is a method or method and process that
results from the application and use of various
scientific disciplines that produce value for meeting
the needs, continuity, and improvement of quality of
life (Khalil, 2000).
Measurements from technology content are using
indicators, as follows: technoware, humanware,
infoware, orgaware (smith, 2007).
Productivity
Productivity is a comparison of the size of prices for
inputs and results, it is also the difference between the
aggregate amount of expenditure and the input
expressed in units (Sinungan, 2005).
Total productivity can be measured based on profit,
capital, energy, and raw materials so that it can
provide an overview of the development of actual
organizational productivity conditions (Hannula,
2002).
3. RESEARCH METHODOLOGY
In accordance with specific sample characteristics,
required MSMEs in Indonesia, this technique is
selected to ensure that only the samples have certain
elements. If the sample can be retrieved from data, it
can also be called convenience sampling (Sugiyono,
201 6: 85). The sample is part of the population used
to infer or describe the population. The sample in this
research is a food and beverage entrepreneur or kind
of Café or Restaurant in Indonesia as many as 70
MSMEs.
Researchers used the PLS method to analyze this
multivariate model. The models consist of four
exogenous latent variables, namely accounting
knowledge, comprehension accounting, owner of
education, owner experience, and application of
financial statements. The models proposed by the
researcher are analyzed using SmartPLS 3.2.1
application.
4. RESEARCH RESULT
The results of the tabulation of questionnaires that
have been inputted using Microsoft software are
exported to Smart PLS 3.2.1 application to be further
analyzed. The data used is the complete data. Out of
a total of 70 respondents. This 70 respondents data are
used for measurement models and structural model
analysis.
The measurement model for validity and
reliability tests, the model and path coefficient for
model equation coefficient of determination, can be
seen in the picture below:
ICT4BL 2019 - International Conference on IT, Communication and Technology for Better Life
114
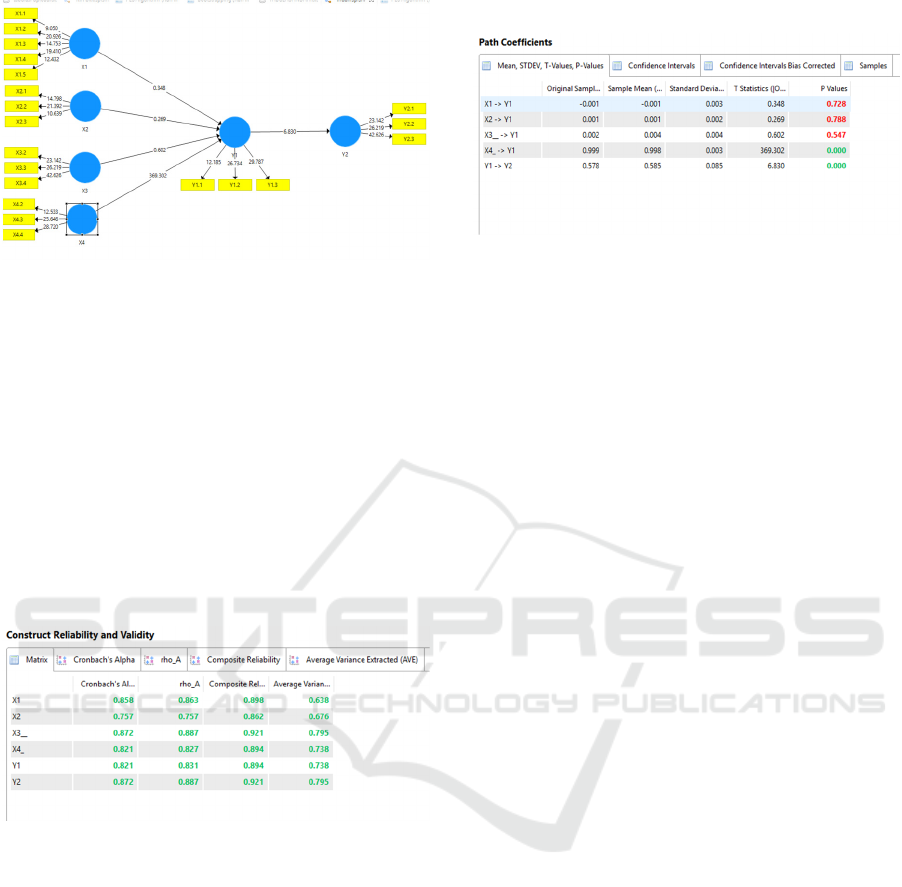
Figure 1. Result Display Picture of PLS Algorithm
Reliability Test
Data outer loading shows some indicators that have
values above 0.70, so the results are considered to
meet the standards and do not need iteration.
If traditional research uses Cronbach's alpha value as
a reference, then in PLS- use different sizes to
determine reliability. Composite reliability values are
used instead (Bagozzi & Yi, 1988). Hair (2014)
requires that the composite reliability value should be
above 0.70 or 0.60 if the study is exploratory.
Table 1. Reliability
The structural model in the PLS is evaluated by the
dependent variable and the path coefficient, which is
then assessed, whose significance is based on the
statistics of each path.
Hypothesis Testing
In testing the structural model, it can be seen from the
statistical values of the dependent variable in The
Path Coefficient table in the Smart PLS Output
below:
Table 2. Path Coefficients
T (2-tailed) test results with a 5% significance level
shown in the table above shows that:
1. Testing the first hypothesis
From the table above, the final sample estimate LS is
-0.001 with significance above 5% indicated by the
value of t statistics 0.348 bigger than the t-table value
of 2,0017. The original value of the sample estimate
positively indicates that technology innovation has a
negative effect on technology content. Based on the
results of the regression can be concluded that the first
hypothesis is rejected.
2. The second hypothesis test.
From the table above, the can be seen from the
original sample estimate LS is 0.001 with a
significance above 5% indicated by the value of t
statistics of 0.269 greater than the t-table value of
2.0017. The original value of the sample estimate
positively indicates that human resources have a
negative effect on c technology content. Based on the
results of the regression can be concluded that the
second hypothesis rejected.
3. The third hypothesis test
From the table above that can be seen from the
original sample estimate LS is 0.002 with a
significant above 5%, indicated by the value statistics
0.602 more significant than the t-table value of
2.0017. The original value of the sample estimate
positively indicates that leadership has a negative
effect on technology content. Based on the results of
the regression can be concluded that the second
hypothesis rejected.
4. Testing the fourth hypothesis
From the table above that can be seen from the
original sample estimate LS is 0.999 with a
significant below 5%, indicate by the value statistics
369.302 higher than the t-table value of 2.0017. The
original value of the sample estimate positively
indicates that technology information has a positive
effect on technology content. Based on the results of
the regression can be concluded that the fourth
hypothesis accepted.
5. Testing the fifth hypothesis
From the table above that can be seen from the
original sample estimate, LS is 0.578 with a
Analysis of the Relationship between Productivity and Technology Content in MSMEs in Indonesia
115
significant below 5%, indicated by the value statistics
6.830 more significant than the t-table value of
2.0017. The original value of the sample estimate
positively indicates that technology content has a
positive effect on productivity. Based on the results
of the regression can be concluded that the fifth
hypothesis accepted.
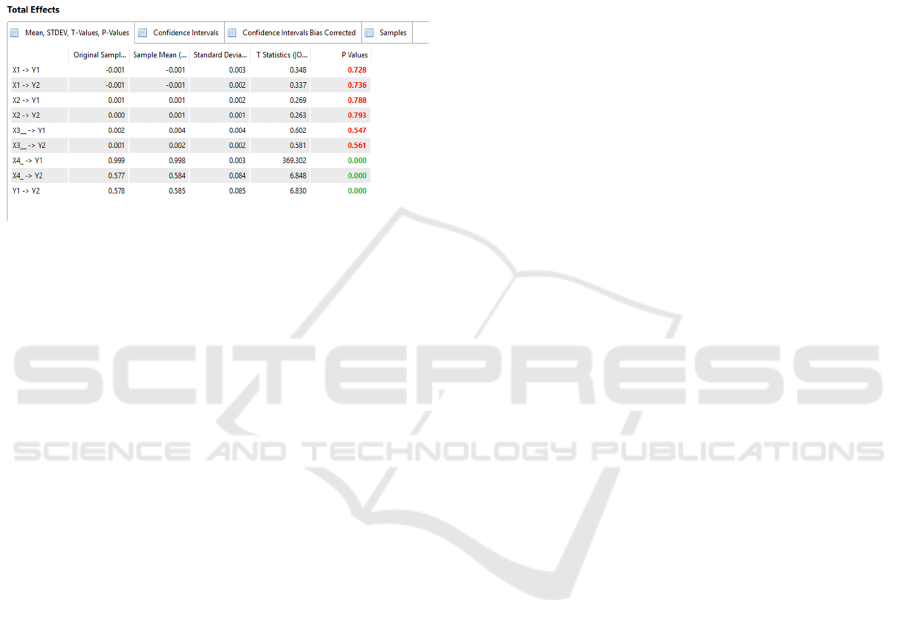
Total Effects
Table 3. Total Effects
Based on the table above, the relationship between
variables is as follows:
1. Relationship of technology innovation with
technology content with a significant value of
0.728, then product innovation does not have a
direct relationship with technology content.
2. Relationship of technological innovation with
productivity with a significant value of 0.736,
then product innovation does not have a direct
relationship with productivity.
3. Relationship between human resources and
technological content with a significant value
of 0.788, then human resources do not have a
direct relationship with technology content.
4. Relationship between human resources and
productivity with a significant value of 0.793,
then human resources do not have a direct
relationship with productivity.
5. Relationship between leadership and
technology content with a significant value of
0.547, information technology does not have a
direct relationship with technology content.
6. The leadership relationship with productivity
with a significant value of 0.561, then human
resources do not have a direct relationship with
productivity.
7. Relationship to technology information with
technology content with a significant value of
0,000, information technology does not have a
direct relationship with technology content.
8. Relationship between technology information
leadership and productivity with a significant
value of 0.000, human resources do not have a
direct relationship with productivity.
9. Relationship between technology content
productivity with a significant value of 0.000,
so human resources do not have a direct
relationship with productivity.
5. CONCLUSION
Based on the results of this study, the following
conclusions are obtained:
1. Variable technology innovation does not affect
on technology content.
2. Variable human resources do not affect on
technology content.
3. Variable leadership does not affect on
technology content.
4. Variable information technology positively
effects on technology content.
5. Variable technology content positively effects
on productivity.
REFERENCES
Anggraini. 2009. Implementation Audit of Biometrics
Fingerprints (System case studies
Attendance STIMIK Yogyakarta), National
Information Technology Application Seminar, June,
Yogyakarta.
Adriana, Brahmayanti, Subaedi, 2010, Competence of SME
HR and Its Impact
Against the Performance of SMEs in Surabaya, Journal
of Management and Entrepreneurship, Vol 12, No 1,
Maret, 42-55.
Badan Pusat Statistik Indonesia. 2018. Data Usaha Mikro
Kecil dan Menengah. Indonesia.
Bagozzi, Rp. Moreover, Y. Yi. 1988. On the Evaluation of
Structural Equation Models. Journal of the Academy of
Marketing Science 16, pp 74-94.
Brahmasari, Suprayetno, 2008, Effects of Work
Motivation, Leadership and Culture
Organization of Employee Job Satisfaction, and Its
Impact on Corporate Performance, Journal of
Management and Entrepreneurship, Vol 10 No 2,
Sepetember, 124-135.
Hair Jr. Et al. 2014. Essential of Business Research Method.
USA.
Hamdani Harfan. 2012. The Effect of Use of Information
Technology and User Skills on the Quality of
Accounting Information (Empirical Study on SKPD in
Padang). Journal of Uninversitas Negeri Padang.
Hannula, 2002, Total Productivity Measirement Based on
Partial Productivity Ratio, International Journal Of
Production Economics, 78, 57-67.
Khalil. 2000. Manajement Of Technology: The Key to
Competitiveness and Wealth
Creation, McGraw Hill, New York.
ICT4BL 2019 - International Conference on IT, Communication and Technology for Better Life
116

Smith, Sharif. 2007. Understanding And Acquiring
Technology Assets For Global
Competition, Technovation 27, pp 643-649.
Sugiyono. 2016. Combined Research Methods. Alfabeta,
Bandung.
Sinungan. 2005. Productivity, What and How Productivity,
PT Bumi Akasara.
Wang, Yuan Lu, Chen, 2008, Evaluating firm technological
innovation capability under uncertainty, Technovation
28, pp 349- 363.
Woworuntu. 2003. Determinants of Leadership, Makara,
Social Humanities, vol 7 No 2, December, hal 71-80.
Analysis of the Relationship between Productivity and Technology Content in MSMEs in Indonesia
117
