
Driving Cycle Development for Urban Bus using Principal
Component Analysis and DBSCAN Clustering: With the Case of
Haikou, China
Zhenzheng Yan
1, a
, Jihui Zhuang
1, b, *
, Xiaoming Cheng
1, c
and Ying Yan
2, d
1
School of Mechanical and Electrical Engineering, Hainan University, Haikou 992753, China
2
National Local Joint Engineering Research Center for Intelligent Vehicle-Road Coordination and Safety Technology,
Tianjin University of Technology and Education, Tianjin 300222, China.
Keywords: Driving cycle, cluster analysis, PCA, DBSCAN cluster, city bus.
Abstract: Driving cycles are an important means for new vehicle technology development and emission prediction
and evaluation. To establish a representative driving cycle for urban buses in Haikou city, in this paper, the
principal component analysis (PCA) and DBSCAN cluster algorithm are applied to develop the driving
cycle. Firstly, a large number of vehicle driving data are collected, which comprised of 12 characteristic
parameters. Next, the PCA is employed to extract main components from the characteristic parameters of
driving data and the DBSCAN cluster is used to select representative micro trips. Subsequently, several
most representative micro-trips were picked out to form the driving cycle. The effectiveness and uniqueness
of the developed driving cycle are verified via comparing the parameters with the real-world driving data
and the existing driving cycles, respectively.
1 INTRODUCTION
With the increase of car ownership, vehicle
emissions have become one of the important sources
of environmental pollution (X. Han, L. P. Naeher,
2006). The main purpose of a driving cycle is to
determine vehicle pollutant emissions and fuel
consumption in the test area (Ho, Sze-Hwee, Yiik-
Diew Wong, 2014). The construction of vehicle
driving cycle is based on the investigation of the
actual driving conditions of vehicles in the test area.
Based on the statistical theory, the test data collected
on typical roads are processed and analyzed, and the
representative driving conditions of the tested area
are constructed.
In recent decades, there have been many studies in
the world on driving cycles. Europe, the United
States and Japan have constructed three world-
famous working conditions (ECE15+EUDC, FTP75
and JPAN10) according to the actual traffic
conditions of various countries. Fotouhi A (A.
Fotouhi, M. Montazeri-Gh, 2013) established
Tehran's driving cycle by K-means clustering. Qin
(D. T. Qin, S. Zhan and Z. G. QI et al, 2016)
developed driving cycles via analyzing three typical
parameters of cycle block. Dai (Dai, Zhen, et.al,
2008) and Ma (Zhixiao Ma, et.al, 2005) constructed
driving cycles using Markov stochastic method and
Dynamic Clustering Method, respectively. Each
driving cycle is unique due to different traffic and
driving conditions, data collection and analysis
technique, and vehicle type considered in the study.
On the basis of the analysis above, considering
the PCA and DBSCAN cluster can be easily
implemented due to their rigorous research
mentality, in this paper, these two methods are
combined to apply to develop the driving cycle with
case of Haikou, China. The results show that the
DBSCAN clustering algorithm make the micro-trips
clearly classified, but also reflect the traffic situation
of Haikou City.
2 DRIVING CYCLE
DEVELOPMENT
2.1 Data Collection
In order to establish a representative driving cycle of
Haikou city buses truly and effectively. We did a
108
Yan, Z., Zhuang, J., Cheng, X. and Yan, Y.
Driving Cycle Development for Urban Bus using Principal Component Analysis and DBSCAN Clustering: With the Case of Haikou, China.
DOI: 10.5220/0008872201080113
In Proceedings of 5th International Conference on Vehicle, Mechanical and Electrical Engineering (ICVMEE 2019), pages 108-113
ISBN: 978-989-758-412-1
Copyright
c
2020 by SCITEPRESS – Science and Technology Publications, Lda. All rights reserved
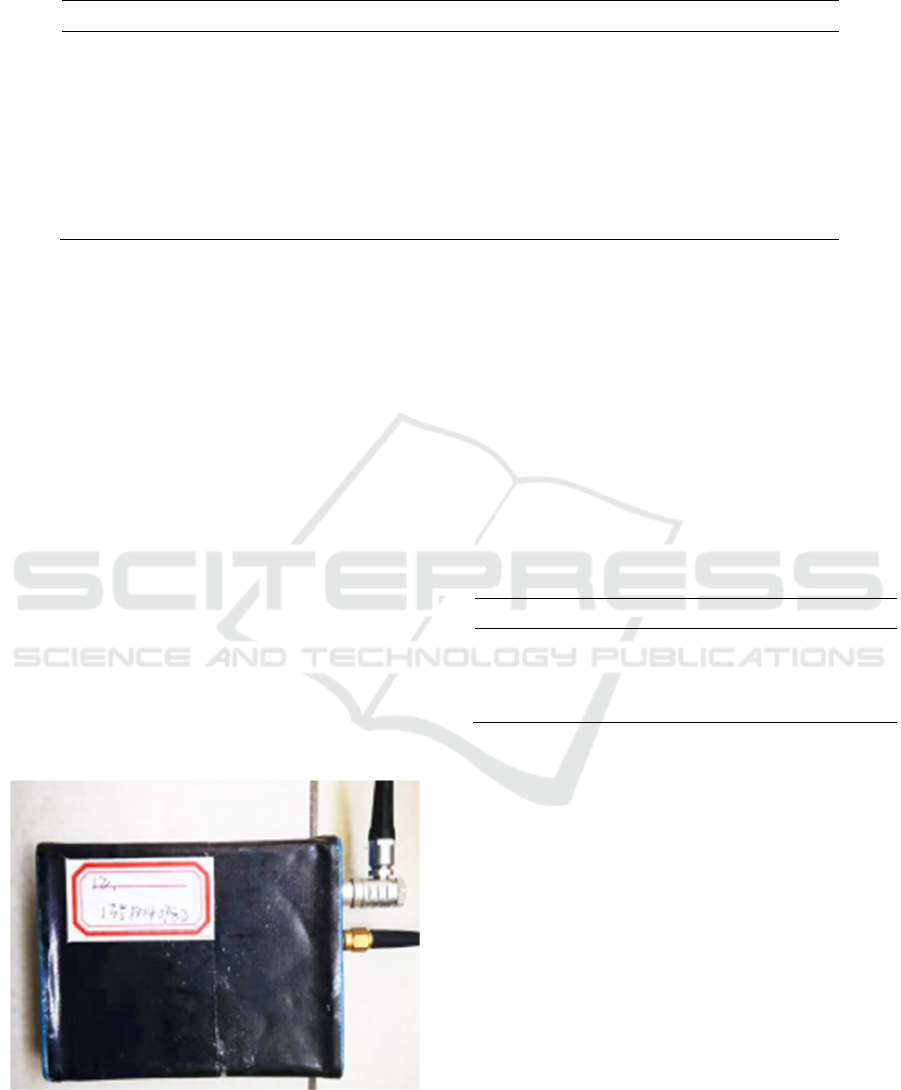
Table 1. Representative bus routes of Haikou.
Bus routes
Route length(km) Number of bus stops Covered road types
NO.1 bus
21.4 43 Trunk roads, sub-trunk roads
NO.5 bus
10.8
22
Sub-trunk roads
NO.16 bus
15.7
35
Highways, sub-trunk roads
NO.19 bus 16.2 31 Trunk roads, sub-trunk roads
NO.21 bus
30.6 35
Highways, Trunk roads, sub-
trunk roads
NO.43 bus 23.5 44 Trunk roads, sub-trunk roads
NO.59 bus 28.2 43 Trunk roads
survey about road type and traffic situation in
Haikou City. Seven representative bus routes were
selected (see Table 1). It can be seen from Table 1,
bus routes covered a wide range of areas, including
highways, urban trunk roads, sub-trunk roads, etc.
Then, the test data of buses are collected by the
cyclic route method (Q. H. Li, 2014). Moreover, in
order to consider the effect of the travel time and
traffic flow on the driving cycle, there is 15-day test
was conducted. The test period is from 6:30 a.m. to
22:30 p.m., and the test data included off-peak hours
and peak hours, covering non-working days and
working days.
The research data in this study came from the
On-board data acquisition terminal specified in this
project, as portrayed in Figure 1. The information of
city buses’ position, speed and acceleration can be
obtained from the terminal, and it will be transmitted
to the data monitoring platform through the
4G network for later data analysis and
processing. Figure 2 presents a flow chart of the
road test remote information system.
Fig 1. On-board data acquisition terminal.
2.2 Data Preprocessing
Vehicles may be influenced by various traffic
conditions that result in several start–stop operations
(Y. B. Zheng, 2014) throughout the process. In this
paper, the motion of a vehicle from one idle to the
next idle is defined as a micro-trip (S.H. Kamble,
et.al, 2009). The collected data were divided into
3423 micro-trips according to the Table2. To
facilitate the classification of 3423 micro-trips, the
selections of assessment criteria are picked out from
the following characteristic parameters in Table 3.
Table 2. Driving modes of micro-trips.
driving modes Description
Accelerate mode a≥0.15m/s2, v≠0
Cruise mode |a|≤0.15m/s2, v≠0
Deceleration mode a≤-0.15m/s2 , v≠0
Idle mode Engine working, v=0, a=0
2.3 Methodology
2.3.1 Principal Component Analysis (PCA)
Visually finding the pattern and the law is difficult
with high-dimensional data. Therefore, dimension
reduction was necessary in this study. Different
strength correlations were noted among of the 12
characteristic parameters used for classification, and
they were not independent of one another. The
principal component analysis (PCA) is a method for
reducing the size of a given collection of data while
keeping the information of the original data (Z. Jing,
et.al, 2017). Hence, in this paper, PCA was used to
reduce the dimension of these parameters first. The
PCA of 12 parameters was carried out by SPSS, and
the characteristic values and contribution rates of
each principal component were obtained, as shown
in Table 4.
Driving Cycle Development for Urban Bus using Principal Component Analysis and DBSCAN Clustering: With the Case of Haikou, China
109
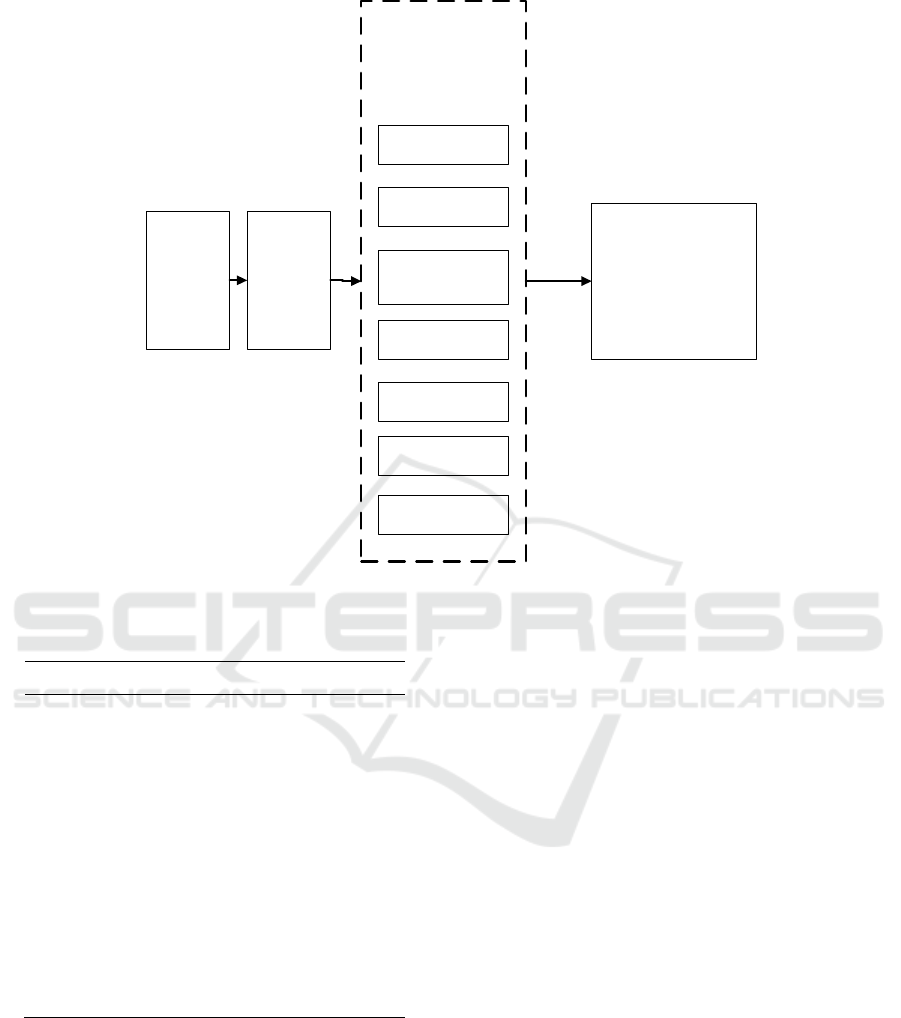
Fig 2. Data collection process.
Table 3. Characteristic parameters.
parameters Implication
Vm average speed (km/h)
Vmax maximum speed(km/h)
Vsd Standard deviation of
velocity(km/h)
Amax maximum acceleration(m/s
2
)
Amin minimum deceleration(m/s
2
)
Asd Standard deviation of
acceleration(m/s
2
)
Pa acceleration time ratio
Pd deceleration time ratio
Pi idle time ratio
Pcon constant time ratio
Am average acceleration(m/s
2
)
Amd average deceleration(m/s
2
)
As exemplified in Table 4, the cumulative
contribution rate of former 4 principal components
to total variation accounted for over 90%. It
indicates the first 4 principal components maintain
most of information of 12 characteristic parameters
mentioned earlier. Namely every micro-trip can be
described by 4 principal components instead of 12
characteristic parameters for further analysis. In
other word, the dimension of sample data is reduced
from 3423*12 to 3423*4, which can reduce the
difficulty of the analysis.
2.3.2 DBSCAN Clustering
DBSCAN (Density-Based Spatial Clustering of
Application with Noise) clustering algorithm is a
method of density-based unsupervised clustering
algorithm (Lizhao Han, et.al, 2018). Compared with
traditional K-Means algorithm, DBSCAN has the
advantage of clustering dense data sets of arbitrary
shape. At the same time, it can also find noise points
while clustering. It is undeniable that the clustering
effect of this algorithm is not ideal when facing
high-dimensional data sets. However, combined
with the role of PCA dimensionality reduction, we
can make up for this defect and get accurate
clustering results.
Two key parameters of DBSCAN algorithm
should be determined: one is the radius (Eps) which
represent the range of circular neighborhoods
centered on a given point P; the other is the number
of minimal points (MinPts) in the neighborhood
centered on point P. The flow of DBSCAN
algorithm is concluded in Figure 3.
vehicle
CAN
network
Data
monitoring
platform
engine speed
vehicle speed
accelerator pedal
depth
intake air flow
engine torque
GPS time
GPS location
4G
network
terminal
ICVMEE 2019 - 5th International Conference on Vehicle, Mechanical and Electrical Engineering
110
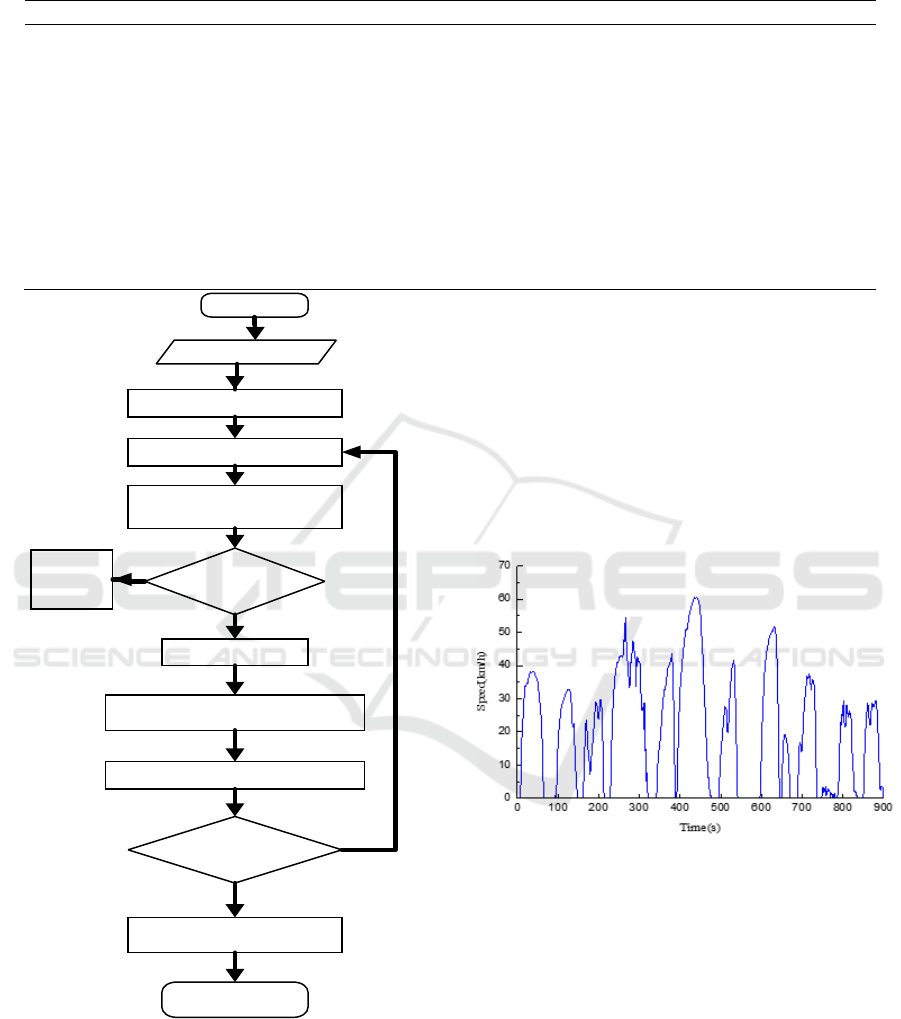
Table 4. Result of PCA.
Componen
t
Total Variance% Cumulative%
1 6.609 44.063 44.063
2 3.710 24.734 68.797
3 1.858 12.389 81.186
4 0.610 4.068 92.709
5 0.358 2.385 95.094
6 0.345 2.299 97.393
7 0.179 1.194 98.587
8 0.116 0.773 99.360
9 0.023 0.154 99.739
10 0.013 0.087 99.935
11 0.010 0.065 100.000
12 5.59E-9 3.72E-8 100.000
Fig 3. Process of DBSCAN clustering algorithm.
2.4 Composition of Driving Cycle
On the basis of the analysis above, DBSCAN
algorithm can be used to cluster sample data after
processed by PCA. Sample data was separated into
two classes by this algorithm: including 2471 micro-
trips belong to the first class while 952 micro-trips
were classified as the second class. According to the
time ratio of the two categories and the correlation
coefficient of candidate fragments (Q. Shi, D. Y.
Qiu and J. Y. Zhou, 2012), 11 micro-trips were
selected from the first category and 5 micro-trips
were selected from the second category, as shown in
Table 5. The representative driving cycle of Haikou
city buses was built by combining these selected
micro-trips (see Figure 4).
Fig 4. Driving cycle of Haikou city buses.
3 RESULTS AND DISCUSSION
3.1 Parametric Analysis
To confirm the efficiency of driving cycle as the test
cycle, in this paper, compare the driving cycle with
the 12 characteristic parameters of the real-world
driving data. The results are displayed in Table 6. It
can be observed in Table 6 that the average error of
these two sets of figures is 5.8%, which indicates the
Haikou driving cycle can reflect the real-world
traffic conditions.
Start
Input data set X
Set up Eps and MinPts
Select an unvisited point P
Joint Core points
no
yes
Find all border points whose
pn<MinPts but in P's Esp
Output clustering results
End
PN>MinPts
Calculate PN of P
neighborhood with Esp
Marked
as noise
point
Unvisite d points in X
Joint border points to core points
yes
no
Driving Cycle Development for Urban Bus using Principal Component Analysis and DBSCAN Clustering: With the Case of Haikou, China
111

Table 5. Driving parameters of 16 micro-trips.
Fragments 1 2 3 ... 16
Duration(s) 154 50 58 ... 54
Acceleration(s) 43 17 21 ... 13
Constant velocity(s) 75 7 11 ... 12
Deceleration(s) 27 21 11 ... 16
Idle time(s) 9 5 15 ... 13
Vmax (km/h) 58.61 42.34 39.44 ... 53
Vm (km/h) 29.35 22.18 19.41 ... 23.15
Vsd (km/h) 19.87 15.31 15.86 ... 16.12
Amax (m/s2) 1.32 1.14 1.23 ... 2.15
Am (m/s2) 0.40 0.68 0.51 ... 0.67
Amin (m/s2) -1.47 -1.18 -2.09 ... -2.08
Amd (m/s2) -0.59 -0.51 -0.90 ... -0.51
Asd (m/s2) 0.21 0.24 0.28 ... 0.27
3.2 Contrast with Typical City Driving
Cycles
To further evaluate the developed Haikou driving
cycle, comparison with the existing standard driving
cycles namely ECE15, FTP75 and JPAN10. The
comparison is based on key parameters as illustrated
in Table 7. It can be observed that, the driving cycle
of Haikou significantly differed from typical driving
cycles in terms of most parameters. Generally
speaking, the buses in Haikou city, compared with
other driving cycles, were in a low-speed state with
frequent acceleration and deceleration.
Table 6. Parametric analysis between two conditions.
Parameters
Real-
world
driving
data
Haikou
driving
cycle
Relative
error
(%)
Vm 24.13 22.43 7.04
Vmax 70.30 63.12 10.21
Vsd 12.21 13.25 8.51
Amax 2.89 2.75 4.84
Amin -2.78 -2.62 5.76
Asd 0.30 0.26 13.3
Pa(%) 30.35 31.17 2.7
Pd(%) 24.83 25.19 1.45
Pi(%) 18.20 17.23 5.33
Pcon(%) 26.62 26.41 0.79
Am 0.547 0.592 2.74
Amd -0.603 -0.537 4.31
4 CONCLUSIONS
In this paper, a methodology for development of
driving cycle using PCA and DBSCAN algorithm is
proposed. The driving cycle for the city of Haikou is
developed by this method and it is validated a highly
representative compared with the real-world driving
data. Besides, the developed driving cycle was
compared with the existing driving cycles, thus
highlighting the uniqueness of the traffic conditions
in Haikou. Namely, the buses in Haikou City are
maintained at low-speed for most of the time and
have frequent acceleration and deceleration actions.
Table 7. Contrast with typical city driving cycles.
Parameters
Haikou driving
cycle
ECE15 FTP75 JPAN10
Vm 22.43 34.1 18.4 17.6
Amax 2.75 1.44 0.81 0.81
Amin -2.62 -1.44 -0.81 -0.81
Pa(%) 31.17 32.4 21.5 24.3
Pd(%) 25.19 28.2 18.5 25.0
Pi(%) 17.23 17.9 30.8 27.2
Pcon(%) 26.41 21.5 29.2 23.5
Am 0.59 0.61 0.64 0.67
Amd -0.54 −0.7 −0.75 −0.65
ICVMEE 2019 - 5th International Conference on Vehicle, Mechanical and Electrical Engineering
112

REFERENCES
X. Han, L. P. Naeher, “A review of traffic-related air
pollution exposure assessment studies in the
developing world,” Environment international, Vol. 1
(2006), No. 32, p. 106-120.
Ho, Sze-Hwee, Yiik-Diew Wong, and Victor Wei-Chung
Chang. "Developing Singapore Driving Cycle for
passenger cars to estimate fuel consumption and
vehicular emissions." Atmospheric environment 97
(2014), p. 353-362.
A. Fotouhi, M. Montazeri-Gh, “Tehran driving cycle
development using the k-means clustering method,”
Scientia Iranica, Vol. 2 (2013), No. 20, p. 286-293.
D. T. Qin, S. Zhan and Z. G. QI et al., “Driving cycle
construction using K-means clustering method,”
Journal of Jilin University (Engineering and
Technology Edition), Vol. 2 (2016), No. 46, p. 383-
389.
Dai, Zhen, Deb Niemeier, and Douglas Eisinger. "Driving
cycles: a new cycle-building method that better
represents real-world emissions." Department of Civil
and Environmental Engineering, University of
California, Davis (2008).
Zhixiao Ma, Xichan Zhu, Mengliang Li, et al.
"Application of Dynamic Cluster to the Development
of Vehicle Real World Driving Cycle."Journal of
Wuhan University of Technology, Vol. 11 (2005), No.
27,p. 69-71.
Q. H. Li, “Analysis of Driving cycle of Road Vehicles in
Hefei,” Technology & Economy in Areas of
Communications, Vol. 3 (2014), p.100-103.
Y. B. Zheng, Q. Shi and S. L. Wang, “Research of
Automobile Driving Cycle in Hefei City,” Automobile
Technology, Vol. 10 (2014), p. 34-39.
S.H. Kamble, T.V. Mathew and G.K. Sharma,
“Development of real-world driving cycle: case study
of Pune, India,” Transport. Res. Part D Transp.
Environ, Vol. 2, no. 14 (2009), p.132-140.
Z. Jing, G. Wang and S. Zhang et al., “Building Tianjin
driving cycle based on linear discriminant analysis,”
Transportation Research Part D: Transport and
Environment, vol. 53(2017), p. 78-87.
Lizhao Han, Xuezhong Qian, Jing Luo, et al., “Multi-
density clustering algorithm DBSCAN based on
region division.” Application Research of Computers,
Vol. 35 (2018), No. 6, p.74-77, 91.
Q. Shi, D. Y. Qiu and J. Y. Zhou, “Driving Cycle
Construction and Accuracy Analysis Based on
Combined Clustering Technique,” Automotive
Engineering, vol. 2 (2012), no. 34, p. 164-169, 158.
Driving Cycle Development for Urban Bus using Principal Component Analysis and DBSCAN Clustering: With the Case of Haikou, China
113
