
Application of Grey Linear Regression Combined Model in
Predicting the Motor Oil Wear Particles for Passenger Cars
Chunjiang Bao
1, a, *
, Zhikuan Wang
1, b
, Lipeng Xu
1, c
1
College of Mechanical and Automotive Engineering, Liaocheng University, Liaocheng Shandong, China
Keywords: Passenger car, engine oil, particle content, grey linear regression combination model.
Abstract: A new model is established by combining the grey model and the linear regression model to synthesize the
advantages of the two models, and then the number of oil wear particles in passenger cars is predicted. The
three models are used to predict and compare the particle content of different levels of passenger car oil.
The prediction results of wear particles in the SJ oil for No.1 passenger car show that the prediction
accuracy of the grey linear regression combined model are higher than the linear regression model
(1.85%) and the grey model (0.29%), and for the SL oil are 1.34% and 0.45%, respectively. For No.2
passenger car, the prediction accuracy is increased by 2.86% in SJ oil and 1.28% in SL oil for the linear
regression model, and 0.12% in SJ oil and 2.62% in SL oil for the grey model. The results indicated that the
combined model has better prediction effect, and it can be applied to the prediction of oil wear particles in
passenger cars. Through the prediction of combined model and the judgment of cleanliness grade, it can
provide the basis for automobile to replacement oil by quality.
1 INTRODUCTION
As a result of the relative movement between the
friction pairs during operation, the oxidation
products produced by oil oxidation and the entry of
external gravel will accelerate the wear of the engine,
resulting in an increase in the number of wear
particles in the oil, which will accelerate the
deterioration of oil quality. In addition, oil
replacement prematurely will cause oil waste, and
oil replacement too late will make the number of
wear particles in the oil exceeding the standard,
accelerating the deterioration of oil quality. The
deterioration of oil has a great harm to the engine of
passenger cars, and the use of degraded oil for a long
time will accelerate the corrosion and wear of engine
parts, leading to serious mechanical faults, so the
problem of oil replacement according to the quality
has been widely concerned by people.
At present, there are many models currently used
for prediction, mainly including grey models, linear
regression models, time series models, and various
combined models. (Y. Wang, et al, 2013) adopted the
combined models based on the variance reciprocal
and the optimal weighting are applied to optimize
the forecasting model. The accuracy of forecast
models on passenger and freight traffic volume has
been improved, which provides a reasonable basis
for the planning and development of the
transportation system. (S.Z. Chen, et al, 2019).
Unbiased model and sliding GM (1, 1) model were
combined with BP neural network optimized by
genetic algorithm (GA), and a combined forecasting
model of GA-grey neural network was obtained,
which took into account the advantages of grey
theory, genetic algorithm and BP neural network.
Finally, the effectiveness of the proposed
combination model was verified with specific
examples. (H. Hao, et al, 2018). Presented a
combined prediction model consisting of a grey
model, exponential smoothing and an artificial
neural network optimized by the particle swarm
optimization (PSO) algorithm. The prediction of the
number of end-of-life vehicles to be recycled in this
paper will support the end-of-life vehicle recycling
industry in terms of recycling management and
investment decision-making and provide a reference
for the formulation and implementation of policies
relating to end-of-life vehicles. (Tobita, Mikio, et al,
2016)l combined the logarithmic and exponential
decay functions and developed methods for
obtaining global solutions using nonlinear least
squares calculations for such complex functions.
38
Bao, C., Wang, Z. and Xu, L.
Application of Grey Linear Regression Combined Model in Predicting the Motor Oil Wear Particles for Passenger Cars.
DOI: 10.5220/0008850800380049
In Proceedings of 5th International Conference on Vehicle, Mechanical and Electrical Engineering (ICVMEE 2019), pages 38-49
ISBN: 978-989-758-412-1
Copyright
c
2020 by SCITEPRESS – Science and Technology Publications, Lda. All rights reserved

Their models significantly improved the fitting
performance of the postseismic time series and the
prediction performance of the evolution of
postseismic deformation. (F.L. Ren, et al, 2018)
adopted the optimized multiple linear regression
model and grey GM(1,1)model to forecast the power
demands of Shaanxi Province in recent years and
obvioused that the prediction model has the high
accuracy. To improve the prediction accuracy of
bridge structure deformation. (J.Z. Xin, et al, 2018)
based on data mining and to accurately evaluate the
time-varying characteristics of bridge structure
performance evolution, this paper proposes a new
method for bridge structure deformation prediction,
which integrates the Kalman filter, Autoregressive
Integrated Moving Average Model (ARIMA), and
Generalized Autoregressive Conditional
Heteroskedasticity (GARCH). Finally, this paper
provides a new way for structural behavior
prediction based on data processing, which can lay a
foundation for the early warning of bridge health
monitoring system based on sensor data using
sensing technology. (Y. Han, 2016) used grey
prediction theory to construct the grey model GM (1,
1) and linear regression weighted combination
model, used to predict the settlement of subgrade.
The studies show that the model has a certain
practical application value and provides a new way
for the study of subgrade settlement prediction. (D.
Liang, et.al, 2014) verified the feasibility of this
combination model is verified through the example.
It can obtain higher prediction accuracy by
collecting relative little data. The combination model
has a lot of advantages in the machine tool sales
forecast. (K.P. Bi, et al, 2016) verified the gray-linear
regression combined model is proved to be valid and
more accurate forecasting method compare with
single forecasting model through practical example.
(B. Zeng, et al, 2013) used the inverse accumulation
generator of the original sequence, the non-
homogeneous exponential incremental sequence is
transformed into homogeneous exponential
incremental sequence, and then a DGM (1, 1) model
is established using the new sequence. Finally, two
examples are given to illustrate the simplicity,
practicability and operability of the model. (N. Tian,
Y. Wei. 2018) Based on the direct modeling of the
approximate non-homogeneous exponential discrete
grey model, this paper constructs a new grey
forecasting model, which not only improves the
modeling accuracy of approximate non-
homogeneous exponential sequences, but also
extends the application scope to such cases as the
combination of the increasing-decreasing sequence.
Finally, examples are employed to verify the
effectiveness and feasibility of the proposed method.
(Y.X. Jiang, Q.S. Zhang, 2015) Based on the recursive
solution to unbiased GM (1, 1) model, proposed the
method of time series piecewise representation. The
results show that the recursive model has higher
fitting precision, and also verify the effectiveness
and the practicability of the representation method of
time series based on the grey forecasting model.
(H.R.Zhao, X.Y.Han, S.Guo, 2018) presented a hybrid
annual peak load forecasting model (MVO-DGM (1,
1). The model uses the latest optimization algorithm
MVO (multi verse optimizer) to determine the two
parameters of DGM (1, 1) model, and then uses the
optimized DGM (1, 1) model to predict the annual
peak load. Taking the annual peak load of Shandong
Province from 2005 to 2014 as an example, the
analysis results show that the DGM (1, 1) model
parameter determination method based on MVO
algorithm has significant advantages over the least
square estimation method, particle swarm
optimization and Drosophila optimization algorithm.
In this paper, the CSI 5200 Three Vector Oil
Analyzer is used to detect and analyze the oil of
passenger cars of different grades, and the number of
wear particles in the oil is obtained, and then the
degree of deterioration of engine oil quality and the
wear condition of the engine are judged according to
the cleanliness grade. Because the analysis cost of
deterioration degree of passenger locomotive oil is
higher, the analysis period is longer, and the data
obtained is relatively less, the grey model is selected
to predict the deterioration degree of passenger
locomotive oil. The grey model is suitable for data
prediction in exponential form, which is not
consistent with the linear rule of actual data.
Therefore, this paper chooses the combination of
grey model and linear regression model to form a
new combination model for forecasting and analysis,
which can not only make up for the lack of linear
law in grey model, but also give full play to the
advantages of grey model, thus improving the
limitations of single model and improving the
accuracy of forecasting (J.F. Jing, K.C. Li, F.K. Deng,
et al, 2015). Due to the different temperatures, loads
and rotational speeds, the chemical composition of
the wear particles is likely to be not the same, which
also has an impact on the number of wear particles.
In this paper, the prediction of wear particles is
carried out under the same wear mechanism.
Application of Grey Linear Regression Combined Model in Predicting the Motor Oil Wear Particles for Passenger Cars
39

2 EXPERIMENTAL METHOD
2.1 Experimental Materials and
Instruments
The three vector oil analyzer (CSI 5200) is used to
detect and analyze the SVW71612BS type Shanghai
Volkswagen new santana sedan, which can quickly
obtain the number of wear particles in the oil. CSI
5200 three vector oil analyzer can carry out viscosity
measurement, dielectric constant measurement,
moisture measurement and particle count. Two
passenger cars (No.1 and No.2) equipped with CPD
engines are selected, and the oil selected by the
engines of the two passenger cars is the oil with a
viscosity rating of SAE 15W/40, a performance
rating of API SJ, a viscosity rating of SAE 10W/40,
and a performance rating of API SL. Two passenger
cars are in good condition and the road conditions
are flat. As the passenger cars used to take on the
driving training task, so the engine working
conditions are relatively bad. Typically, drivers of
passenger cars replace oil when their passenger car
mileage reaches about 5000 km. The passenger car
uses a special sampler to extract oil once per 1000
km of travel, and adds the same amount of new oil
to the same model. During the experiment, the oil is
heated to 40°C and the number of particles in the oil
is measured using the CSI 5200 three vector oil
analyzer.
2.2 Selection of Experimental Data
The trend of change in the number of 5~15μm wear
particles per milliliter in the oil of the No.1 and No.2
passenger cars measured by the experiment is shown
in Figure1.
In the process of oil circulation, large wear
particles will be filtered out by the oil filter, and
small particles will continue to flow with the oil,
when the number of particles increased to a certain
extent, it is necessary to replace the oil, otherwise
the oil passage will be blocked, leading to serious
accidents. As can be seen from Figure1a and
Figure1b, the change in the number of 5~15μm wear
particles per milliliter in No.1 and No.2 passenger
cars is more obvious, to some extent, which can
reflect the degree of deterioration of the engine oil
quality and the condition of engine wear. Therefore,
taking the number of 5~15μm wear particles per
milliliter in passenger car oil of two different grades,
SJ Grade and SL Grade as an example, the grey
linear regression combined model is used to predict
the deterioration degree of the engine oil quality.
(a) Passenger car No.1
(b) Passenger car No.2
Figure 1. Number of particles 5~15μm per milliliter in
different grades of engine oil.
2.3 Oil Cleanliness Analysis
Clean lubricating oil can extend the service life of
mechanical equipment, improve the operating
efficiency of equipment, different equipment have
different requirements on the cleaning degree of
lubricating oil, steam turbines and hydraulic systems
require high cleanliness of lubricants, while the
internal Combustion engines require relatively low
requirements. The relationship between the degree
of lubricating oil cleanliness required by different
equipment and the ISO 4406 cleanliness level is
shown in Table 1 (B. Chen, J.G. Wang , 2012;X. Xiao,
H. Guo, S. Mao, 2014). As the mileage of passenger
cars increases, changes in the ISO 4406 cleanliness
level for No.1 and No.2 passenger cars oil are shown
in Table 2 and Table 3.
20000
25000
30000
35000
40000
1000 2000 3000 4000 5000
Number of particles
/mL
Driven distance /km
SJ grade engine oil
SL grade engine oil
25000
30000
35000
40000
1000 2000 3000 4000 5000
Number of particles
/mL
Driven distance /km
SJ grade engine oil
SL grade engine oil
ICVMEE 2019 - 5th International Conference on Vehicle, Mechanical and Electrical Engineering
40

Table 1. Relationship between the cleaning degree of
lubricating oil required by different equipment and the
ISO 4406 cleanliness level.
Oil
product
Turbine
oil
Hydraulic
oil
Gear
oil
Internal
combustion
engine oil
12/9
very
clean
very
clean
-
-
14/11
very
clean
very
clean
very
clean
-
16/13
clean
clean
very
clean
very clean
18/15
dirty
dirty
very
clean
very clean
20/17
dirty
dirty
dirty
clean
22/19
dirty
dirty
dirty
dirty
24/21
dirty
dirty
dirty
dirty
Note: 22/19 means that if the number of particles
larger than 5 μm is within 20000~40000 per
milliliter of oil, the grade is 22; more than 15μm. If
the number is within 2500~5000, the rating is 19
Table 2. ISO 4406 cleanliness level for different grade
passenger car oils for passenger car No.1.
Grade
Driven distance /km
0
1000
2000
3000
4000
5000
SJ
grade
19/16
22/16
22/16
22/15
22/15
22/16
SL
grade
18/15
22/15
22/15
22/15
22/15
22/15
Table 3. ISO 4406 cleanliness level for different grade
passenger car oils for passenger car No.2
Grade
Driven distance/km
0
1000
2000
3000
4000
5000
SJ
grade
19/16
22/16
22/16
22/15
22/15
22/16
SL
grade
19/15
22/15
22/15
22/15
22/16
22/16
As can be seen from Table 2 and Table 3, the
cleanliness level of the new oil is between
18/15~20/17, indicating that the new oil is clean.
With the increase in mileage of No. 1 and No. 2
passenger cars, the ISO 4406 grade of two grades of
passenger car oil is between 18/15~22/19, and
according to the cleanliness level required by the
internal combustion engine, it is indicated that no
replacement oil is required when the passenger car
mileage reaches 5000km. According to Tables 1, 2
and 3, as well as the cleanliness grade, two different
grades of oil contain a large amount of wear
particles of about 5μm, which easily lead to engine
lubrication system blockage and siltation. This
means that when the oil flows through the oil filter,
some of the large particles will be filtered out and
the small particles will flow with the oil. When the
cleaning level of oil reaches 22/19, the oil should be
replaced in time.
3 GREY LINEAR REGRESSION
COMBIMATION MODEL
In 1982, Professor Deng proposed a new system
theory method for studying the problem of less data
and uncertainty of poor information, which is the
grey system theory (J.S. Wang, 2015). The core of
Grey system theory is grey model, and the grey
model is suitable for the prediction of the
development trend of the original series with
exponential growth, without considering the actual
situation with linear law, the prediction effect is
often poor. Linear regression model is only a linear
description of the future development trend, for the
change of large data prediction results are quite
different. The new model, which combines the grey
model with the linear regression model, is called the
grey linear regression combined model (Y.B. Zhou,
L.F. Jiao, 2008). The linear regression model is
combined with the grey model to avoid the
disadvantage of a single model and to draw on each
other's strengths, which can improve the prediction
accuracy of the model.
3.1 Model Establishment
The process of establishing a grey linear regression
combination model is as follows:
The original number be listed as:
))(,),2(),1((
000
0
nxxxX
(1)
Perform an accumulation of the original series
0
X
to get a new series:
))(,),2(),1((
1111
nxxxX
(2)
Wherein:
k
i
nkiXkX
1
01
),,2,1(),()(
,
Finding the first-order differential equation for the
new series:
bax
dt
dx
1
1
(3)
Application of Grey Linear Regression Combined Model in Predicting the Motor Oil Wear Particles for Passenger Cars
41

Among them, 𝑎 is he development coefficient,
which 𝑏 is the amount of grey action. When 𝑡
represents the unit time, the differential form of the
differential equation is equal to the differential form,
that is:
)()()1(
011
1
txtxtx
dt
dx
(4)
Therefore, the differential equation of the
)1,1(GM
model can be expressed as:
btaxtx )()(
10
(5)
The formula (5) is called the original form of the
)1,1(GM
model.
Find the solution of (3):
a
b
e
a
b
xtx
at
))1(()(
11
(6)
For convenience, record as:
21
1
)1(
ˆ
cectx
t
(7)
Linear regression equations such as
baxy
and exponential equations such as
x
cey
are used
to fit the cumulative sequence
)(
1
tX
, thus, a new
model sequence is generated, and seek its
undetermined coefficients. The new sequence is:
321
1
)(
ˆ
ctcectx
t
(8)
Wherein, c1, c2, c3 is the undetermined
coefficient. In order to obtain the parameters, the
sequence of parameters is:
11
( 1)
1 2 3 1 2 3
( ) ( 1) ( ) ( 1)
t
Z t X t X t ce c t c c e t c t c
21
)1( ceec
t
(9)
Wherein:
1,,2,1 nt
.And assume that:
1 1 1 1
ˆ ˆ
( ) ( ) ( 1) ( ) ( 1) ( )
m
X Z t m Z t X t m X t m X t X t
)1)(1(
1
eeec
mt
(10)
Transform equation (10):
)1)(1(
)1)(1(
)(
)1(
1
)1(
1
eeec
eeec
tX
tX
mt
mt
m
m
e
(11)
In order to obtain the solution
, the two sides
are derived:
)(
)1(
ln
tX
tX
m
m
(12)
When
m
takes different values, the
corresponding
value will be obtained, find the
average value of
of
, and use
as the
estimated value of
, thereby improving the
precision of
. The steps are as follows:
)1()2(2)3()1()2()1(
111
1
XXXZZX
1 1 1
1
1 1 1
1
(2) (3) (2) (4) 2 (3) (2)
( ) ( 1) ( ) ( 2) 2 ( 1) ( )
X Z Z X X X
X m Z m Z m X m X m X m
Determined by (12):
)1()1(
11
m
)2()1(
22
m
)3()1(
33
m
)1(
1m
The average value is obtained:
)1(
)(2
1
1
mm
j
m
i
im
j
i
(13)
Wherein: m=n-2. If
)exp( tL
t
, the equation (8)
can be transformed:
321
1
ˆ
ctcLcX
t
(14)
Using the least squares method, the estimated
values of
321
,, ccc
are obtained.
1
1
1
1
2
3
1
(1)
(1) 1 1
(2) 2 1
(2)
,,
( ) 1
()
x
L
c
L
x
X C c A
c
L n n
xn
(15)
Then
ACX
1
, the values of c1, c2, c3 are
obtained using the least squares method. Bring it
into equation (8) and get the prediction formula for
the combined model:
321
1
)( ctcectX
t
(16)
ICVMEE 2019 - 5th International Conference on Vehicle, Mechanical and Electrical Engineering
42

Wherein, c1, c2, c3 are the undetermined
coefficients.
3.2 Model Test
The combined model residuals is:
)(
ˆ
)()(
10
ixixiq
(17)
The Relative error is:
)(
)(
)(
0
ix
iq
i
(18)
The average relative error is:
n
i
i
n
avg
2
)(
1
1
)(
(19)
The model accuracy is:
%100))(1( avgp
(20)
It is generally believed that when
%90p
, the
accuracy is acceptable, that is, the model can be used.
The accuracy level is shown in Table 4 (
Y Zhou, Y
Luo, SM Jia, et al, 2014)
.
Table 4. Predictive model accuracy division.
Predictive model accuracy
level
P value
First grade
99%
Two grade
95%p99%
Three grade
90%p95%
Four grade
90%
4 APPLICATION OF GREY
LINEAR REGRESSION
COMBIMED MODEL
4.1 Linear Regression Model
Prediction
The linear regression model is an equation of the
form
baxy
. From the experimental data, the
prediction equations for the number of wear particles
of 5~15μm per milliliter in the different grades of
the No.1 passenger cars are:
1
3.77444 19193.08
SJ
yx
(21)
1
2.8827 24540
SL
yx
(22)
Similarly, the prediction equations for the
number of 5~15μm wear particles per milliliter in
different grades of the No.2 passenger car are:
2
SJ
0.9811 2499.60yx
(23)
2
0.4288 20496.19
SL
yx
(24)
The results of predicting the number of 5~15μm
particles per milliliter in different grades of oil
through the above equations are shown in Tables 5
and 6.
Table 5. Number of particles 5~15μm per milliliter in
different grades of motor oil on the 1st passenger car
(pieces).
Grade
Driven distance /km
1000
2000
3000
4000
5000
SJ
grade
22968
26742
30516
34291
38065
SL
grade
27422
30305
33188
36071
38954
Table 6. Number of particles 5~15μm per milliliter in
different grades of motor oil on the 2nd passenger car
(pieces).
Grade
Driven distance /km
1000
2000
3000
4000
5000
SJ
grade
25640
27655
29631
31572
35408
SL
grade
27988
30740
32344
34408
36719
4.2 Grey Model Prediction
The equation of the form
baey
x
is the grey
model equation. Using MATLAB for data fitting,
the prediction equations of the number of 5~15μm
wear particles per milliliter in different grades of oil
in No.1 passenger car are:
1 0.875
58374.5645 35142.4821
t
SJ
ye
(25)
1 0.684
45862.8695 19849.2547
t
SL
ye
(26)
Application of Grey Linear Regression Combined Model in Predicting the Motor Oil Wear Particles for Passenger Cars
43

Similarly, the prediction equations for the
number of wear particles per milliliter of 5~15μm in
the different grades of the No.2 passenger car are:
2 0.578
42178.75 17298.215
t
SJ
ye
(27)
2 0.854
53117.296 28832.795
t
SL
ye
(28)
Through the above formula, the number of
particles of 5~15μm per milliliter in different grades
of oil is predicted, and the results are shown in Table
7 and Table 8.
Table 7. Number of particles 5~15μm per milliliter in
different grades of motor oil on the 1st passenger car
(pieces).
Grade
Driven distance /km
1000
2000
3000
4000
5000
SJ
grade
23227
27008
30453
33561
36333
SL
grade
26991
29723
32858
36274
39042
Table 8. Number of particles 5~15μm per milliliter in
different grades of motor oil on the 1st passenger car
(pieces).
Grade
Driven distance /km
1000
2000
3000
4000
5000
SJ
grade
25740
27685
30421
32894
36841
SL
grade
25482
28156
31856
34258
38563
4.3 Combined Model Prediction
(1) Model establishment
The grey linear regression combined model is
established by using the number of 5~15μm particles
per milliliter in the SJ grade oil of No. 1 passenger
car as the original series:
3630435132319112549323742
0
X
After a cumulative increase:
152582116278811464923523742
1
X
When
1m
:
1
(1) (2) (1) 6418X Z Z
1
(2) (3) (2) 3221X Z Z
1
(3) (4) (3) 1172X Z Z
The solution:
01.1)2(,69.0)1(
11
.
When
2m
, Similarly, it can be obtained that:
1172)2(,3221)1(
22
XX
. From the formula, it
can be obtained that:
69.0
2
. It can be obtained
that
9.0
. From MATLAB, it can be obtained
that:
]89.3075486.201528.27521[C
The prediction formula for the number of
5~15μm particles per milliliter in the SJ grade oil of
No.1 passenger car can be obtained:
1 0.9
( ) 27521.28 2015.86 30754.89
t
SJ
X t e t
(29)
Similarly, the prediction formula for the number
of 5~15μm particles per milliliter in SL grade Oil of
No. 1 passenger car is:
1 0.6035
( ) 18963.41 5241.25 28756.95
t
SL
X t e t
(30)
According to the derivation of the above formula,
the prediction formulas for the number of particles
of 5~15 μm per milliliter in the different grades of
the passenger car of No. 2 passenger car are:
2 0.75
SJ
( ) 35274.52 4625 15247.12
t
X t e t
(31)
2 0.81
( ) 25874 3589 8952.86
t
SL
X t e t
(32)
From the prediction formulas (29),(30) and
formulas (31), (31), the number of particles of 5~15
μm per milliliter in different grades of oil can be
obtained. The results are shown in Table 9 and Table
10.
Table 9. Number of particles 5~15 μm per milliliter in different grades of motor oil on the 1st passenger car (pieces).
Grade
Driven distance /km
1000
2000
3000
4000
5000
SJ grade
23576
26788
30942
34789
36567
SL grade
25785
28952
32245
35365
37154
ICVMEE 2019 - 5th International Conference on Vehicle, Mechanical and Electrical Engineering
44

Table10. Number of particles 5~15 μm per milliliter in different grades of motor oil on the 1st passenger car (pieces).
Grade
Driven distance /km
1000
2000
3000
4000
5000
SJ grade
25425
27523
30425
33986
37425
SL grade
26895
28452
30487
33721
35154
(2) Model test
According to Table 9 and Table 10 and formulas
(17) and (18), the residuals and relative errors of the
5~15μm particles per milliliter and the predicted
values of the grey linear regression combination
model are obtained. The results are shown in Table
11 and Table 12.
From the data in equations (19), (20) and Table
11 and Table 12, the average errors of the grey linear
regression combined model of No.1 passenger car
are 2.1% and 4.61% respectively, and the accuracy
are 97.99%, 95.38%. The average errors of the grey
linear regression combined model of No.2 passenger
car are 1.3%, 2.08% respectively, and the accuracy
is 98.7%, 97.92%, respectively. According to the
classification of prediction accuracy in Table 3, the
prediction accuracy level of the number of 5~15μm
particles per milliliter in different grades of oil using
the combined model is level-2. The grey linear
regression combined model can be applied to the
prediction of oil wear particles in passenger cars.
4.4 Model Comparison
Through the prediction of three models, it can be
found that the prediction value of 5~15μm particles
per milliliter of different grades in passenger car oil
is obtained. Compared with the measured values, the
trend of the number of 5~15μm particles per
milliliter of different grades in No.1 and No.2
passenger cars is obtained, which is shown in Figure
2 and Figure 3.
Table 11. Residual and relative error of predicted values of passenger car combination model No.1.
Driven distance /km
1000
2000
3000
4000
5000
SJ
grade
Measured value
23742
25493
31911
31911
31911
Predictive value
23576
26788
30942
34789
36567
Residual
166
-1295
969
343
-263
Eerror/%
0.7
-5.08
3.04
0.98
-0.72
SL
grade
Measured value
24739
31084
35391
36882
37910
Predictive value
25785
28952
33245
35365
37154
Residual
-1000
2132
3146
1517
756
Error/%
-4.04
6.86
6.06
4.11
1.99
Table 12. Residual and relative error of predicted values of passenger car combination model No.2.
Driven distance /km
1000
2000
3000
4000
5000
SJ
grade
Measured value
25640
27655
29632
33542
37879
Predictive value
25425
27523
30425
33986
37425
Residual
215
132
-793
-444
454
Error/%
0.84
0.48
-2.68
-1.32
1.20
SL
grade
Measured value
27988
29940
30424
33542
34879
Predictive value
26895
28452
30487
33721
35154
Residual
1093
1488
-63
-179
-275
Error/%
3.91
4.97
-0.21
-0.53
0.79
Application of Grey Linear Regression Combined Model in Predicting the Motor Oil Wear Particles for Passenger Cars
45

(a) SJ grade engine oil
(b) SJ grade engine oil
Figure 2. Comparison of predicted values of 5~15μm particles per milliliter in different grades of passenger car No.1.
(a) SJ grade engine oil
(b) SL grade engine oil
Figure 3. Comparison of predicted values of 5~15μm particles per milliliter in different grades of passenger car.
According to the prediction results and the
cleanliness grade analysis of the combined model,
the number of 5~15μm particles per milliliter of
different grades in passenger car oil does not exceed
40000. At this time the oil is clean and does not need
to be replaced. While if the number of 5~15μm
particles per milliliter in the oil exceeds 40000, the
oil cleanliness has exceeded the passenger car
22000
27000
32000
37000
1000 2000 3000 4000 5000
Number of particles
/mL
Driven distance/km
Measured value
Linear regression model predictive value
Grey model prediction
Combined model prediction
22000
24000
26000
28000
30000
32000
34000
36000
38000
40000
1000 2000 3000 4000 5000
Number of particles
/mL
Driven distance/km
Measured value
Linear regression model predictive value
Grey model prediction
Combined model prediction
22000
24000
26000
28000
30000
32000
34000
36000
38000
40000
1000 2000 3000 4000 5000
Number of particles
/mL
Driven distance/km
Measured value
Linear regression model predictive value
Grey model prediction
Combined model prediction
22000
24000
26000
28000
30000
32000
34000
36000
38000
40000
1000 2000 3000 4000 5000
Number of particles
/mL
Driven distance/km
Measured value
Linear regression model predictive value
Grey model prediction
Combined model prediction
ICVMEE 2019 - 5th International Conference on Vehicle, Mechanical and Electrical Engineering
46
engine requirements of the cleaning degree of oil.
There are too many impurities in the oil, and it can
not continue to use. Otherwise, it will accelerate the
deterioration of oil quality, resulting in engine wear
failure, and the oil should be replaced in time.
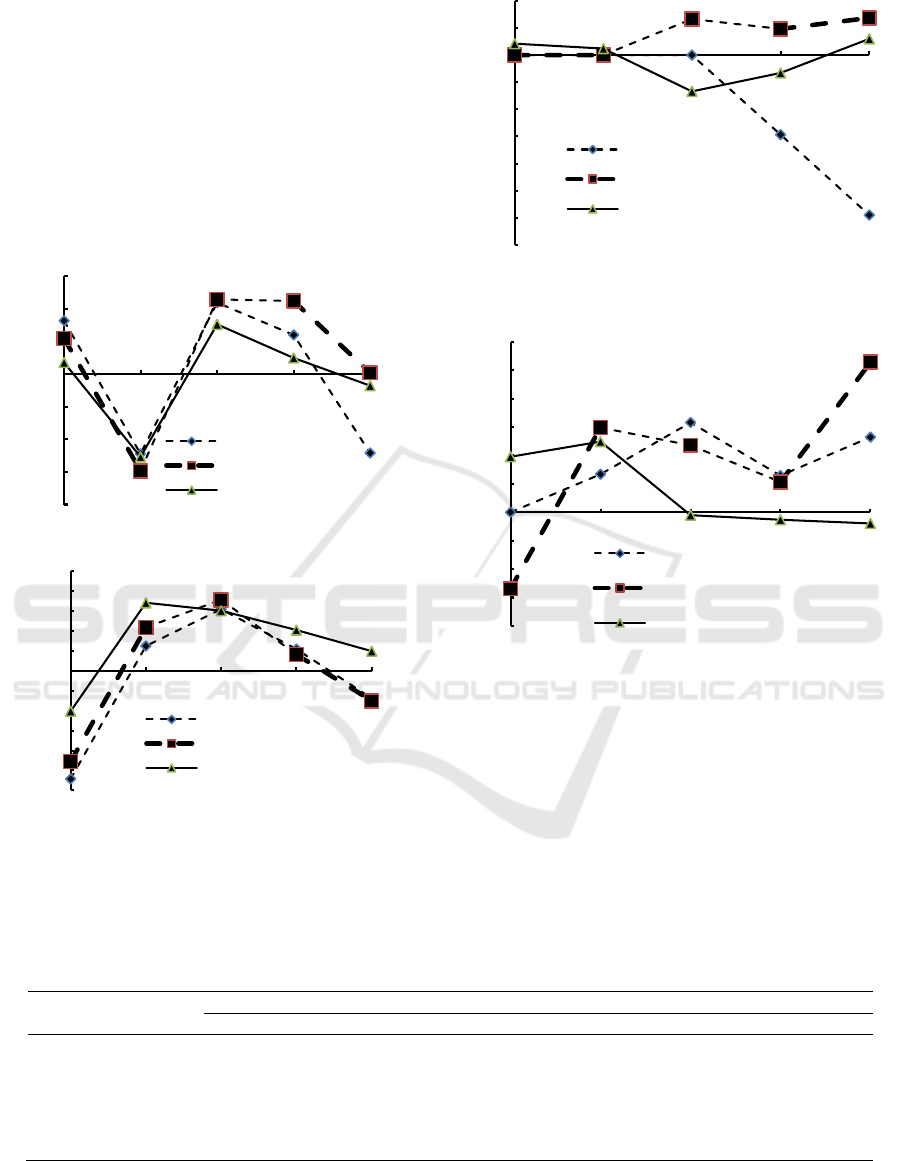
According to the experimental data and the
predicted values of three prediction models, the
relative error and average error of the predicted
value of 5~15μm particles per milliliter in different
grades of oil are obtained and shown in Table 8. The
changing trends of different relative errors are
shown in Figure 4 and Figure 5.
(a) SJ grade engine oil
(b) SL grade engine oil
Figure 4. Comparison of relative errors of predicted values
of 5~15 μm particles per millet in different grades of
motor oil of No.1 passenger car.
(a) SJ grade engine oil
(b)SL grade engine oil
Figure 5. Comparison of relative errors of predicted values
of 5~15μm particles per millet in different grades of motor
oil of No.2 passenger car.
Table 13. Relative error analysis of predicted values of 5~15μm particles per milliliter in different grades of passenger car
No.1.
Driven distance /km
SJ grade relative error/%
SL grade relative error/%
Linear
Grey
Combined
Linear
Grey
Combined
1000
3.26
2.17
0.70
-10.85
-9.10
-4.04
2000
-4.90
-5.94
-5.08
2.51
4.38
6.86
3000
4.37
4.57
3.04
6.22
7.16
6.06
4000
2.39
4.47
0.98
2.20
1.65
4.11
5000
-4.85
0.07
-0.72
-2.75
-2.99
1.99
Error/%
3.95
3.44
2.10
4.90
5.06
4.61
-8
-6
-4
-2
0
2
4
6
1000 2000 3000 4000 5000
Number of particles/mL
Driven distance/km
Linear regression model
Gray model
Combined model
-12
-10
-8
-6
-4
-2
0
2
4
6
8
10
1000 2000 3000 4000 5000
Number of particles/mL
Driven distance/km
Linear regression model
Gray model
Combined model
-14
-12
-10
-8
-6
-4
-2
0
2
4
1000 2000 3000 4000 5000
Number of particles/mL
Driven distance/km
Linear regression model
Gray model
Combined model
-8
-6
-4
-2
0
2
4
6
8
10
12
1000 2000 3000 4000 5000
Number of particles/mL
Driven distance/km
Linear regression model
Gray model
Combined model
Application of Grey Linear Regression Combined Model in Predicting the Motor Oil Wear Particles for Passenger Cars
47

Table 14. Relative error analysis of predicted values of 5~15 μm particles per milliliter in different grades of passenger car
No.2.
Driven
distance /km
SJ grade relative error/%
SL grade relative error/%
Linear
Grey
Combined
Linear
Grey
Combined
1000
0
0
0.84
0
-5.38
3.91
2000
0
0
0.48
2.67
5.96
4.97
3000
0
2.66
-2.68
6.31
4.71
-0.21
4000
-5.87
1.93
-1.32
2.58
2.13
-0.53
5000
-11.80
2.74
1.20
5.28
10.56
-0.79
Error/%
4.16
1.42
1.30
3.36
4.80
2.08
According to Table 13 and Table 14, it can be
found that the wear particles in the SJ oil for No.1
passenger car show that the prediction accuracy of
the grey linear regression combined model are
higher than the linear regression model (1.85 %) and
the grey model (0.29 %), and for the SL oil are
1.34 % and 0.45%, respectively. For No.2 passenger
car, the prediction accuracy is increased by 2.86% in
SJ oil and 1.28% in SL oil for the linear regression
model, and 0.12% in SJ oil and 2.62% in SL oil for
the grey model. According to the relative error
changes of the predicted values of each model, the
relative error of the predicted values of the
combined model are much smaller than those of the
grey model and the linear regression model. This
shows that the grey linear regression combined
model is better than the grey model and the linear
regression model. The grey linear regression
combined model can be applied to the prediction of
passenger car oil wear particles. According to Table
8 and the prediction of the grey linear regression
combination model, when the mileage of the
passenger car reaches 5000km, the number of
5~15μm particles per milliliter in the SJ grade and
SL grade oil does not exceed 40000, indicating that
the oil is clean at this time. The drivers of the
passenger cars generally perform oil replacement
when the passenger car's mileage reaches 5000km.
Combined with the predicted results, the oil is
replaced prematurely and the oil is still in a clean
state, resulting in a waste of oil. It is suggested that
when changing oil, the degree of deterioration of oil
quality should be considered, extend the oil
replacement period appropriately, realize the
replacement of oil according to quality, avoid the
waste of oil, and save the cost of use.
5 CONCLUSIONS
(1) With the increase of mileage in passenger cars,
the content of particles in oil also increases slowly.
The change trend of particle content of 5~15μm is
obvious and regular, which can be used as the main
index to monitor engine wear. If the cleanliness of
the oil reaches 22/19, the oil should be replaced.
(2) The grey linear regression combined model is
established by combining the grey model with the
linear regression model, which makes up for the
deficiency of the single model and improves the
prediction accuracy.
(3) The example shows that the prediction
accuracy of the grey linear regression combined
model is higher than the linear regression model and
the grey model. It indicated that the combined model
can be applied to the prediction of oil wear particles
in passenger cars.
(4) According to the cleanliness level, when the
mileage of passenger cars reaches 5000km, the oil
replacement is too early at this time and the oil is
still in a clean state. The oil replacement period
should be extended appropriately, and realizing the
replacement of oil according to quality.
ACKNOWLEDGEMENTS
This work was financially supported by the
Funding of National Science and Technology
Support Program (2015BAG02B01).
REFERENCES
B. Chen, J.G. Wang. Research on grey linear regression
combined model algorithm, Journal of Xi\'an
University of Arts and Science (Natural Science
Edition), 2012, 15(1): 82-85.
B. Zeng, S.F. Liu. Unbiased direct DGM (1, 1) model of
non-homogeneous exponential sequence and its
application in electric load forecasting. Statistics &
Information Forum, 2013,732-733.
D. Liang, Y.F. Hu, L.F. Ma, et al. Forecasting for Machine
Tool Sales Based on Grey Linear Regression Model.
Advanced Materials Research, 2014, 945: 2935-2938.
ICVMEE 2019 - 5th International Conference on Vehicle, Mechanical and Electrical Engineering
48

F.L. Ren, W.B. Li, T. He. Linear regression and grey
theory's application in the Power prediction, 2018.
H. Hao, Q. Zhang, Z.G. Wang, Forecasting the number of
end-of-life vehicles using a hybrid model based on
grey model and artificial neural network, Journal of
Cleaner Production, 2018, (202): 684-696.
H.R.Zhao, X.Y.Han, S.Guo. DGM (1, 1) model optimized
by MVO (multi-verse optimizer) for annual peak load
forecasting. Neural Computing and Applications,
2018, 30(6):1811–1825.
J.F. Jing, K.C. Li, F.K. Deng, et al. Grey line of corrosion
of oil and gas pipelines, Sexual regression combined
prediction model. Oil & Gas Storage and
Transportation, 2015, 34(12):1300-1304.
J.S. Wang. Standard of lubricating oil cleanliness and
detection of particulate pollution, Measurement and
testing technology, 2015, 42(5): 21-22.
J.Z. Xin, J.T. Zhou, S.X. Yang, Bridge structure
deformation prediction based on GNSS data using
Kalman-ARIMA-GARCH model, Sensors, 2018,
18(1) 298: 1-6.
K.P. Bi, G.H. Yan, H. Y. Zhang, et al, Research on
equipment failure rate forecasting based on gray-linear
regression combined model. 2016 Prognostics and
System Health Management Conference, 2016, 19-21.
N. Tian, Y. Wei Application Scope and extension of
approximate non-homogeneous exponential discrete
grey model. Statistics & Decision, 2018, 8: 126-132.
S.Z. Chen, S. Li, F. Xiao, Forecasting of asphalt pavement
performance based on GA-Grey neural network,
Journal of Chongqing Jiaotong University (Natural
Science), 2019, 159-164.
Tobita, Mikio. Combined logarithmic and exponential
function model for fitting postseismic GNSS time
series after 2011 Tohoku-Oki earthquake, Tobita
Earth, Planets and Space, 2016 68(41):1-12.
X. Xiao, H. Guo, S. Mao. The modeling mechanism
extension and optimization of grey GM (1, 1) model,
Applied Mathematical Modelling, 2014, 38(5): 1896-
1910.
Y.B. Zhou, L.F. Jiao. Standards and test methods of oil
cleanliness, Lubricating Oil, 2008, 23(1): 63-64.
Y. Han, Weighted grey linear regression combined model
and its application based on wavelet pretreatment,
Industrial Instrumentation & Automation, 2016, (06):
152-158.
Y. Wang, X.M. Chen, Y.H. Han. Forecast of passenger
and freight traffic volume based on elasticity
coefficient method and grey model, Procedia-Social
and Behavioral Sciences, 2013, (96): 136-147.
Y.X. Jiang, Q.S. Zhang. Recursive solution to
approximate non-homogeneous unbiased GM (1, 1)
model and its application. Control and Decision, 2015,
30(12):524-554.
Y Zhou, Y Luo, SM Jia, et al. Grey-linear regression
combination model for ritting and predicting layered
land subsidence in Beijing, Urban Geology, 2014,
9(4): 52-56.
Application of Grey Linear Regression Combined Model in Predicting the Motor Oil Wear Particles for Passenger Cars
49
