
Research on Vehicle Detection and Direction Determination based on
Deep Learning
Qianqian Zhu
1, a
, Hang Li
1
and Weiming Guo
1
1
Tianjin CATARC Data Co., Ltd., China Automotive Technology & Research Center Co., Ltd., Tianjin, China
Keywords: Deep learning; Convolutional neural network; Vehicle detection; Direction determination.
Abstract: With the increase of vehicle ownership in China, the number of auto insurance cases is also increasing. The
detection and direction determination of vehicles involved in auto insurance cases have important
applications in the field of intelligent loss assessment. In this paper, a model of vehicle detection and
direction determination based on ResNet-101+FPN backbone network and RetinaNet is built by using
convolutional neural network in deep learning. Then, the model is trained and tested on the labelled data set.
The model has a relatively high accuracy of prediction, in which the accuracy of vehicle detection reaches
98.7%, and the accuracy of the five directions determination of frontal, lateral-frontal, lateral, lateral-back
and back reaches 97.2%.
1 INTRODUCTION
With the development of Chinese economy. By the
end of 2018, the number of motor vehicles in China
had reached 327 million, and the scale of auto
insurance premiums exceeded 700 billion yuan,
accounting for more than 60% of the property
insurance business. With the increase of the number
of auto insurance cases, the traditional method of
manual damage assessment has presented great
pressure, and intelligent damage assessment has
become a demand. Intelligent damage assessment
refers to taking pictures, video or audio related to the
damage of the accident car on the spot after the
accident, then according to this information
automatically processing to determine the damage
situation of the accident vehicle and the
corresponding vehicle maintenance plan.
When a vehicle has an accident and takes
pictures of the damage, in most cases the damage of
the vehicle cannot be clearly judged by only one
picture, so it is often necessary to take pictures of the
vehicle from multiple directions and angles.
Intelligent damage assessment according to these
pictures to restore the damage of the vehicle.
Vehicle detection and direction determination can
determine the position and bearing of the vehicle in
the uploaded accident image, which will be helpful
to identify the damage of parts and give specific
maintenance plans.
To solve this problem: Firstly, The dataset of the
model is constructed by manual marking and data
augmentation. Secondly, we built the detection
model based on the deep convolutive neural network
and combining resnet-101 +FPN main trunk network
and RetinaNet. Thirdly, we carry out research on
vehicle detection and direction determination of the
directions of frontal, lateral-frontal, lateral, lateral-
back and back.
2 DATASET
2.1 Data Labeling
Since there is no publicly available picture
indicating the photo location of the accident car, this
paper constructs a dataset to study. First of all, 5,000
sets of accident photos are selected, each set
contains 5-10 photos, covering four common vehicle
types: car, SUV, MPV, cross passenger car (van), as
shown in Figure 1.
26
Zhu, Q., Li, H. and Guo, W.
Research on Vehicle Detection and Direction Determination based on Deep Learning.
DOI: 10.5220/0008849700260031
In Proceedings of 5th International Conference on Vehicle, Mechanical and Electrical Engineering (ICVMEE 2019), pages 26-31
ISBN: 978-989-758-412-1
Copyright
c
2020 by SCITEPRESS – Science and Technology Publications, Lda. All rights reserved
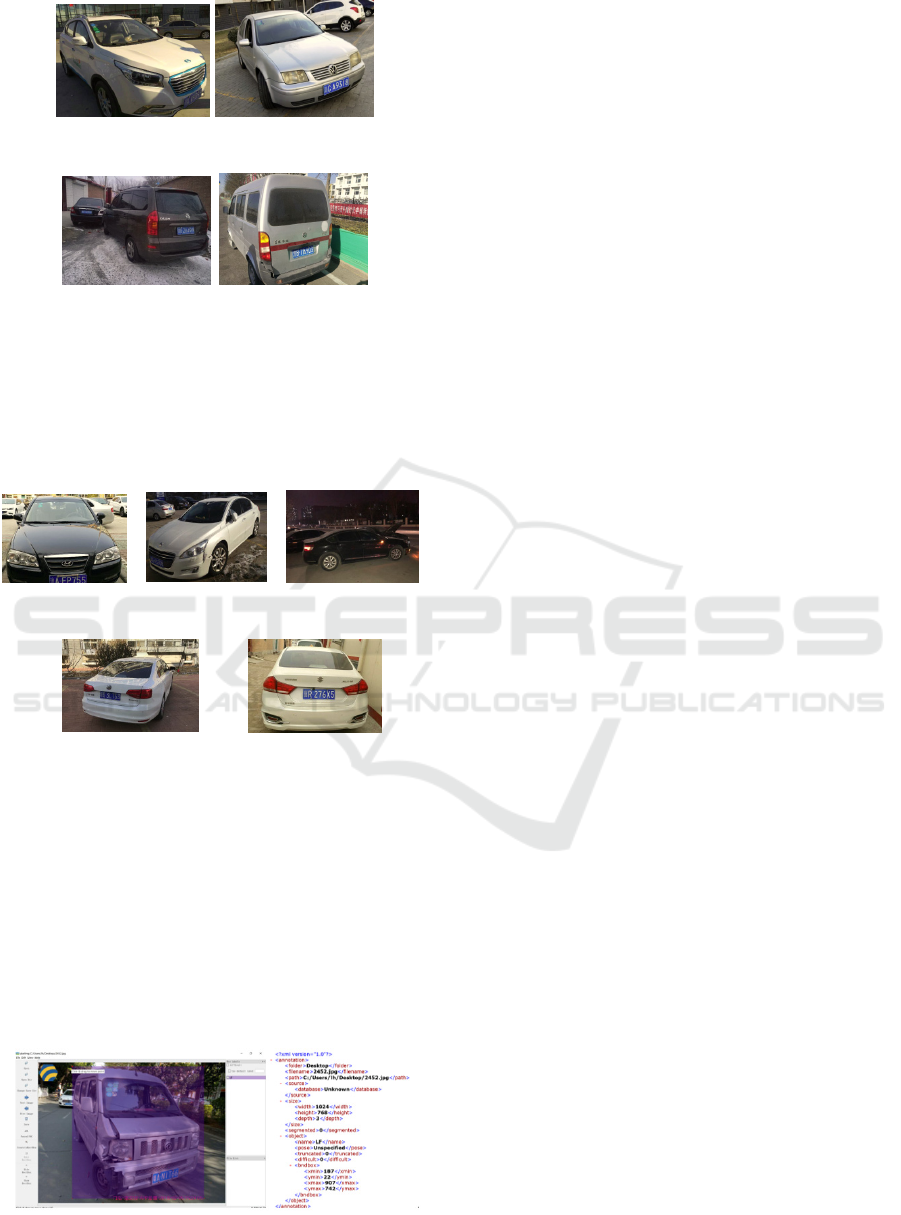
(a) CAR (b) SUV
(c) MPV (d) VAN
Figure 1. Diagram of vehicle type.
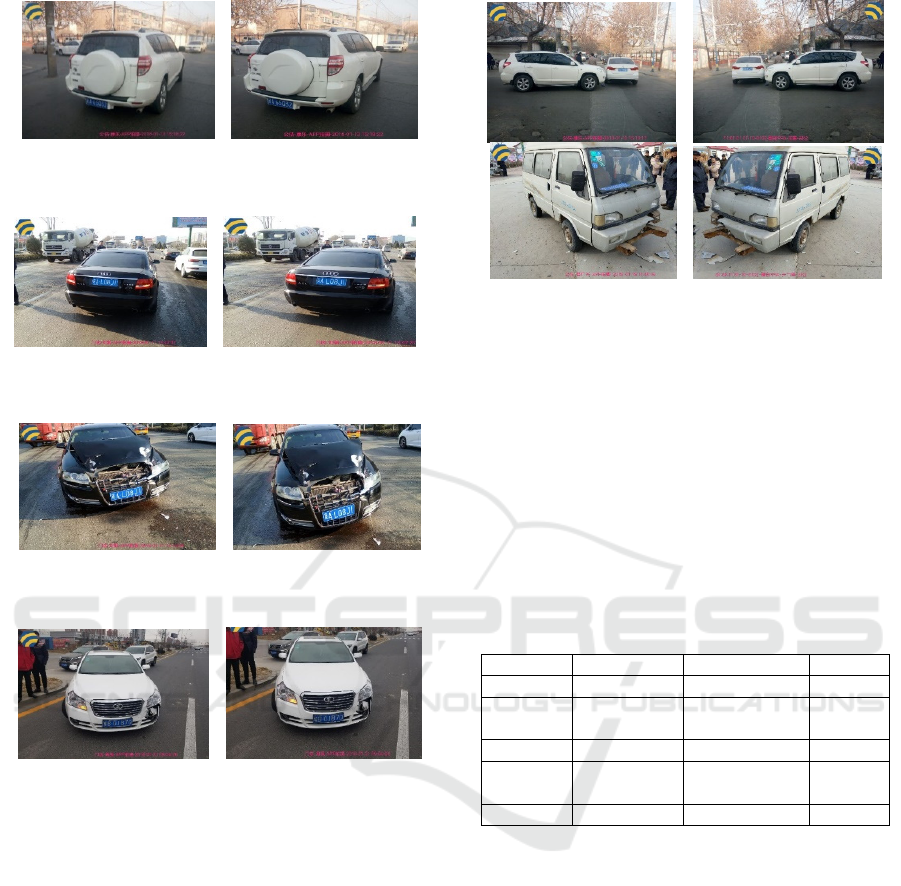
Photos are taken from five directions: frontal,
lateral-frontal, lateral, lateral-back and back. The
photos include near and far views, day, night and
various weather conditions, as shown in Figure 2.
(a) Frontal (b) Lateral-frontal (c) Lateral
(d) Lateral-back (e) Back
Figure 2. Diagram of vehicle direction.
After collecting the original photos, first screen
the photos: delete the blurred images that can't be
seen by human eyes, and the vehicles are not fully
displayed, then tag the remaining pictures. The
labeling tool selects labelImg and adopts rectangular
box to label. After labelling, each image generates a
corresponding XML file containing annotation
information, as shown in Figure 3.
Figure 3. Label and XML file.
Finally, a total of 6520 pictures were labelled.
According to the ratio of 8:1:1, 5216 pictures were
selected randomly as the training set of the model,
650 pictures as the validation set of the model, and
654 pictures as the test set of the model.
2.2 Data Augmentation
When the dataset of training model is small, in order
to save the cost of data construction and improve the
generalization ability of the model, datasets are often
augmented. The commonly used methods are: image
flipping, rotation, zooming and cropping.
In the application scenarios of vehicle detection
and direction determination, because of the camera
conditions, sometimes the target vehicle will appear
on the edge of the picture. The model needs to have
a good detection and recognition ability on the
picture of the vehicle at the edge. Therefore, image
cropping is selected to increase the number of edge
pictures. At the same time, due to the symmetrical
structure of the vehicle, the damage repair schemes
of the left and right parts of the vehicle are identical
when fixing the damage. Therefore, there is no need
to recognize the left and right directions of the
vehicle. Flip horizontal is also used to augmente the
data in this paper.
2.2.1 Image Cropping
Firstly, 1/3, 1738 pictures were randomly selected
from 5216 training set. Secondly for each picture,
randomly select one direction of the upper, lower,
left and right and one proportion of 0.5 to 0.75.
Delete the proportion of the width between the edge
of the picture and the edge of the marked vehicle in
this direction, to get the new picture after cropping.
Thirdly, the XML file of the original picture is
modified according to the clipping, and the
corresponding XML file of the new picture is
generated.
After image cropping, 1738 new pictures were
obtained. The image cropping situation is shown in
Figure 4.
Research on Vehicle Detection and Direction Determination based on Deep Learning
27
(a1) Picture before left cropping (a2) Left cropped
Picture
(b1) Picture before right cropping (b2) Right cropped
Picture
(c1) Picture before cropping below (c2) Below cropped
Picture
(d1) Picture before crop ping above (d2) Above cropped
Picture
Figure 4. Diagram of image cropping.
2.2.2 Flip Horizontal
Firstly, 1/2, 1739 pictures were randomly selected
from the remaining 3478 pictures after taking out the
cropping pictures. Secondly, for each picture, choose
the position of the central axis, and flip the image
horizontally along the central axis to get the new
picture. Thirdly, the XML file of the original picture
is modified according to the flip horizontal, and the
corresponding XML file of the new picture is
generated.
After flip horizontal, 1739 new pictures were
obtained. The flip horizontal is shown in Figure 5.
(a) Pictures before Flip horizontal (b) Flipped horizontal
pictures
Figure 5. Diagram of image flip.
After image augmentation, 3477 new pictures
were added, there are 8693 training model pictures
in total.
2.3 Data Distribution
In the end, we got 8693 training pictures, 650
validation pictures and 654 test pictures. The
direction distribution is shown in Table 1.
Table 1. Direction distribution of picture.
Training set Validation set Test set
Frontal 1232 92 87
Lateral-
frontal
2483 185 188
Lateral 2070 154 160
Lateral-
back
1656 131 129
Back 1252 88 90
3 MODEL BUILDING
Vehicle detection and direction determination
belong to the problem of target detection: firstly, the
accident vehicles should be identified among the
numerous contents of the pictures, then according to
the picture features obtained by the training, the
direction of the target vehicle is classified and the
position is determined.
The traditional image recognition is mainly
based on the shallow network structure model,
which has high requirements on the training set, and
requires tedious image processing, and the image
recognition ability is weak. To solve these problems,
scholars introduce deep learning into the field of
image recognition, and use more complex network
ICVMEE 2019 - 5th International Conference on Vehicle, Mechanical and Electrical Engineering
28
structure to extract image features. In addition, many
deep learning models are proposed, such as
Restricted Boltzmann Machine (RBM), Deep Belief
Networks (DBN) and Convolutional Neural
Networks (CNN). Among them, CNN is a multi-
layer neural network, which is the most popular and
effective network structure in the field of image
recognition. In this paper, a deep convolution neural
network based on Residual Neural Network
(ResNet) (Ren
S, He K, Girshick R, et al., 2015) and
Feature Pyramid Network (FPN) (Lin, 2017) as the
Network backbone, combined with RetinaNet, is
used to build the model.
3.1 Residual Neural Network (ResNet)
In the construction of convolutional neural network,
problems such as gradient diffusion and gradient
explosion occur in traditional deep neural network
structures, such as AlexNet, VGGNet and
GoogleNet. In order to solve these problems,
regularization initialization and intermediate
regularization layer are proposed. However, doing
so will lead to network degradation, so this paper
adopts deep residual network (ResNet) to extract
feature images.
When regularization is adopted to deal with the
gradient problem of deep network, its deep network
structure often becomes identity mapping, which
will degrade the deep network structure into shallow
network structure. However, it is difficult to
construct the network structure directly to fit these
potential identity mappings, namely, to construct
H(x) = x. It may also make it difficult for the
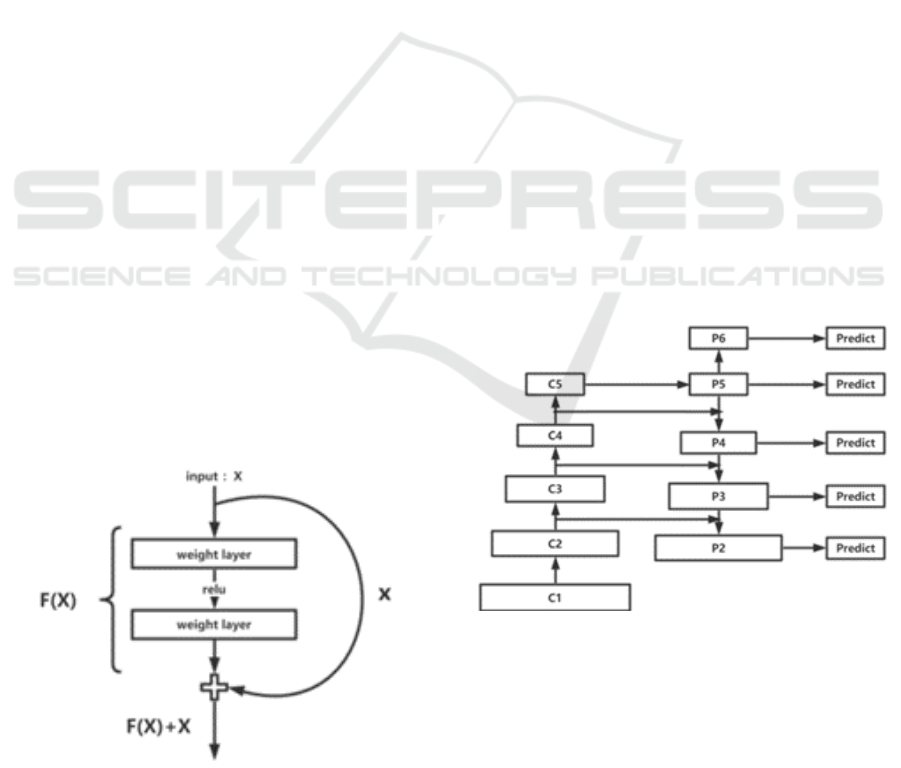
network to be trained. Therefore, the deep residual
network abandons fitting the identity mapping to fit
the residual. Its network structure is shown in Figure
6.
Figure 6. ResNet network structure.
ResNet constructs function F(x) through the
network, takes F(x) + x as the input value of the next
layer of network, uses F(x) + x to fit identity
mapping H(x): F(x) + x = H(x), then F(x) = H(x) - x.
So just set F(x) = 0 to fit this identity mapping. In
this paper, the ResNet network with 101 layers is
selected to extract image features.
3.2 Feature Pyramid Network (FPN)
After image features are extracted, general models
directly use the last layer of feature images of the
network, because the semantic information in the
last layer of feature images is strong, but the position
and resolving power in the last layer of feature
images are relatively low, and the position
information is more retained on the previous layer of
feature images. Therefore, this paper adopts feature
pyramid network (FPN), which makes use of feature
images of different levels, to process the features
obtained by ResNet.
FPN is to combine the characteristic image of
each layer of network output with the characteristic
image of one layer lower than it, and output the
characteristic image of fusion of several different
layers for prediction. In this way, different levels of
feature images are used to better analyze the location
information and semantic information. The structure
is shown in Figure 7. C1, C2, C3, C4 and C5 are
feature map of different levels output by resnet-101,
and P2 to P6 are feature map processed by FPN for
later prediction.
Figure 7. FPN structure.
3.3 RetinaNet
When the front and back scenes are judged by the
target detection, a large number of candidate boxes
are generated based on the randomly selected pixel
points in the picture. the candidate boxes are
classified to determine whether these candidate
Research on Vehicle Detection and Direction Determination based on Deep Learning
29
boxes belong to the detection target or the image
background. But since most of the content of the
image is background, this approach can cause
category imbalance problems. In order to solve the
problem of category imbalance, RetinaNet improved
the loss function and changed it into a dynamically
scaled cross entropy function, weight factor was
added to the loss to reduce the weight of samples
easy to classify and increase the weight of samples
difficult to classify.
RetinaNet loss function:
FL( ) (1 ) log( )
ttt t
ppp
Where
t
p
is the probability of true classification
of samples, The true classification of each sample is
different and the
t
is different.
t
is artificially given
weights on categories.
is a set of adjustment
parameters for a given setting.
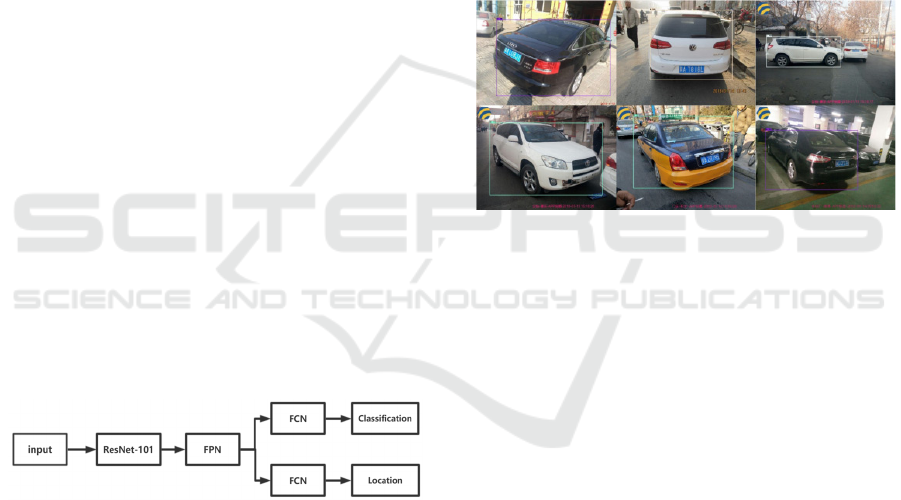
3.4 Overall Framework of the Model
The model as a whole can be divided into three
steps:
(1) Resnet-101: feature extraction is carried out
on the input images to extract 5 feature images of
different levels and scales.
(2) FPN: the obtained feature images are fused to
obtain 5 feature images of different sizes. The pixels
on the images are randomly selected to generate
multiple candidate boxes for identifying targets.
(3) FCN: input the candidate boxes obtained into
two networks with the same structure but different
parameters, then obtain the results of target detection
and target classification respectively.
Figure 8. RetinaNet model framework.
4 EXPERIMENTS AND RESULTS
ANALYSIS
We divided the labelled pictures into training set,
verification set and test set according to the ratio of
8:1:1, Using two GPUs : NVIDIA GEFORCECTX,
at Ubuntu16.04, based on the deep learning
framework: Caffe2, used 8693 pictures to train
model parameters and 650 pictures to adjust the
model and generate the model. The model was tested
with 654 pictures. During the test and training
stages, it was stipulated that when the IOU of the
prediction box and the real box was greater than 0.5,
the prediction area was correct. The AP of the test
set was 0.97.
After selecting the best threshold, output the
result of the test picture. Of the 654 test images, 646
pictures’ accident vehicle were identified, the
accuracy of vehicle recognition was 98.7%. Among
the 646 pictures, 628 pictures show that the position
of the accident car is consistent with the marked
position, with an accuracy rate of 97.2%. Vehicle
detection and direction determination model have
good effects. Under various circumstances, the
model can accurately identify the vehicle position in
the picture and give accurate direction
determination. The test results are shown in Figure
9.
Figure 9. Test results.
5 SUMMARY AND OUTLOOK
Firstly, we selected 5,000 sets of accident photos,
brushed the photos, labelled the position and
direction of the vehicle manually, and augmented
the data. A total of 9997 pictures were obtained, and
the training set, verification set and test set of the
model were constructed. Then, based on deep
learning, the vehicle detection and direction
determination model of resnet-101 +FPN main trunk
network combined with RetinaNet was built, and the
model was trained and tested. The test results show
that: the accuracy of vehicle detection is 98.7%, the
accuracy of vehicle direction is 97.2%.
From the output results of the training set, the
vehicle detection and direction determination model
can well complete the vehicle identification and the
determination of five kinds of direction. The model
will have a good application prospect in the field of
intelligent loss assessment of vehicles and intelligent
traffic.
ICVMEE 2019 - 5th International Conference on Vehicle, Mechanical and Electrical Engineering
30

REFERENCES
Lin T Y, Dollár, Piotr, Girshick R, et al., 2017. Feature
Pyramid Networks for Object Detection. In The IEEE
Conference on Computer Vision and Pattern
Recognition. 2117-2125.
Lin T Y, Goyal P, Girshick R, et al., 2017. Focal Loss for
Dense Object Detection. In IEEE Transactions on
Pattern Analysis & Machine Intellgence. PP
(99):2999-3007.
Ren S, He K, Girshick R, et al., 2015. Towards real-time
object detection with region proposal networks. In
Neural Information Processing Systems.
Research on Vehicle Detection and Direction Determination based on Deep Learning
31
