
Research on the Permitted Height of Combined Center of Gravity for
Railroad Cars
Chao Chen
1, a
, Ziji’an Wang
1, b, *
and Mei Han
1, c
1
School of Traffic and Transportation, Beijing Jiaotong University, Beijing 100044, China
Keywords: Railroad freight car, MBS, orthogonal experiment, combined center of gravity.
Abstract: Permitted height of combined center of gravity for railroad cars in China is studied. This study establishes a
MBS model of the railroad freight car, and then validates the model. Orthogonal experiment method is used
to find the worst operating condition. The factors’ levels are determined and used for designing orthogonal
experiment schemes. Extensive simulations are performed for the schemes. Statistics analysis is applied to
simulation results. The worst operating conditions for Grade I and III railroad are derived from objective
analysis. Based on the worst operating conditions, the permitted height of combined center of gravity for
railroad cars can be increased to 2500mm. The influence degree of each factor is derived by variance
analysis. Factor B is a significant factor for derailment coefficient, factor A and factor C have little effect on
derailment coefficient. But the three factors are significant factors for wheel unloading rate.
1 INTRODUCTION
Permitted height of combined center of gravity for
railroad cars is one of the basic technical standards
in China’s railroad. The height of combined center
of gravity cannot over 2000mm in current
Regulations on Loading and Securing of Railway
Goods, else the car must be running with a speed
limit to ensure safety, so the permitted height of
combined center of gravity for railroad cars is
2000mm in China.
This standard originated from Manchuria
railroad for several decades. Since the 1950s,
(Wenpu Yang, 1957) has focused on studies of the
height of combined center of gravity for railroad
cars. He derived the safety factor related to the
vertical force and unbalanced centrifugal force when
the car was passing through a curve. The results of
research have indicated that combined center of
gravity can exceed 2000mm and keep safety.
(Yuanhan Wang, 1979) studied the overturning
coefficient when the car is running on the curve and
stop on the curve. (Xiaoqiang Ding et al, 1982)
proposed models of overturning coefficient and
height of combined center of gravity based on the
vertical and lateral inertia force. (Renjun Wang et al,
1982) provided numbers of gondola car, flat car, box
car and tank car that had combined center of gravity
over 2000mm, but these cars were not running with
speed limit.
(Hongnian Yan, 1991) investigated the wheel
unloading rate when the combined center of gravity
was over high. (Haibo He, 1996) analyzed the
relationship between derailment coefficient, wheel
unloading rate, overturning coefficient and
combined center of gravity. It has been proposed
that the permitted height of combined center of
gravity for railroad cars should be over 2200mm.
(Mei Han et al, 2007) derived a derailment
model under the effect of the lateral force. They
found that the permitted height of combined center
of gravity for C64K gondola car was 2207mm when
the derailment coefficient was no more than 1.2.
(More recently Beijing Jiaotong University, 2007,
2008) devised and performed field tests specifically
to identify the permitted height of combined center
of gravity for tank car and double-deck container car.
Experiments results showed that the permitted
height of combined center of gravity for tank car is
2200mm and it is 2400mm for double-deck
container car.
The permitted height of combined center of
gravity for the car and load in North American
Railroad must be at 98 in. (2489.2mm) or less above
top of rail [10]. The permitted height in Russian
Railroad is 2585mm when the load does not have
lateral deviation (H.Г.,Г.П., Lusheng Chen, 1965).
Chen, C., Wang, Z. and Han, M.
Research on the Permitted Height of Combined Center of Gravity for Railroad Cars.
DOI: 10.5220/0008848801550164
In Proceedings of 5th International Conference on Vehicle, Mechanical and Electrical Engineering (ICVMEE 2019), pages 155-164
ISBN: 978-989-758-412-1
Copyright
c
2020 by SCITEPRESS – Science and Technology Publications, Lda. All rights reserved
155
They are much higher than 2000mm in China’s
railroad.
This paper describes work to analyze and
identify the permitted height of combined center of
gravity. A particular feature of the work is the use of
orthogonal experimental design and the railroad car
multibody system (MBS) modelling is conducted in
the SIMPACK environment, after which the
established model is validated using field test data.
The orthogonal experiment factors are confirmed
before designing of simulation schemes. The
railroad car MBS model in SIMPACK provides a
method to simulate all the schemes, the wheel
unloading rate and derailment coefficient can be got
from SIMPACK post processing. Aim at the
permitted height of combined center of gravity, the
most dangerous conditions are obtained by objective
analysis and variance analysis. This paper further
explores the significance level of each orthogonal
experiment factors.
2 MBS MODELLING AND
VALIDATION
2.1 MBS Model of the Railroad Car
The railroad cars used in China today mostly have
the same structure, the car-rail coupling system is
demonstrated in Fig.1.
Figure 1. Physical model of railroad car system: side view.
The car has one carbody (a lading in it), two
trucks and each truck has two wheelsets, two side-
frames, one bolster, and two cross bracing poles
(swing motion truck does not have). The suspension
supplies stiffness and damping between side-frames
and bolster in the longitudinal, lateral and vertical
directions. The stiffness is supplied by spring group,
and the damping is come from coil springs and
friction. Furthermore, there are several clearance and
block structures in the truck. First the force between
two parts is friction, then the block will stop the
movement of the parts after clearance disappeared.
So the truck is a nonlinear dynamic system. The
nonlinear force can be expressed as a spring that has
two-stage stiffness.
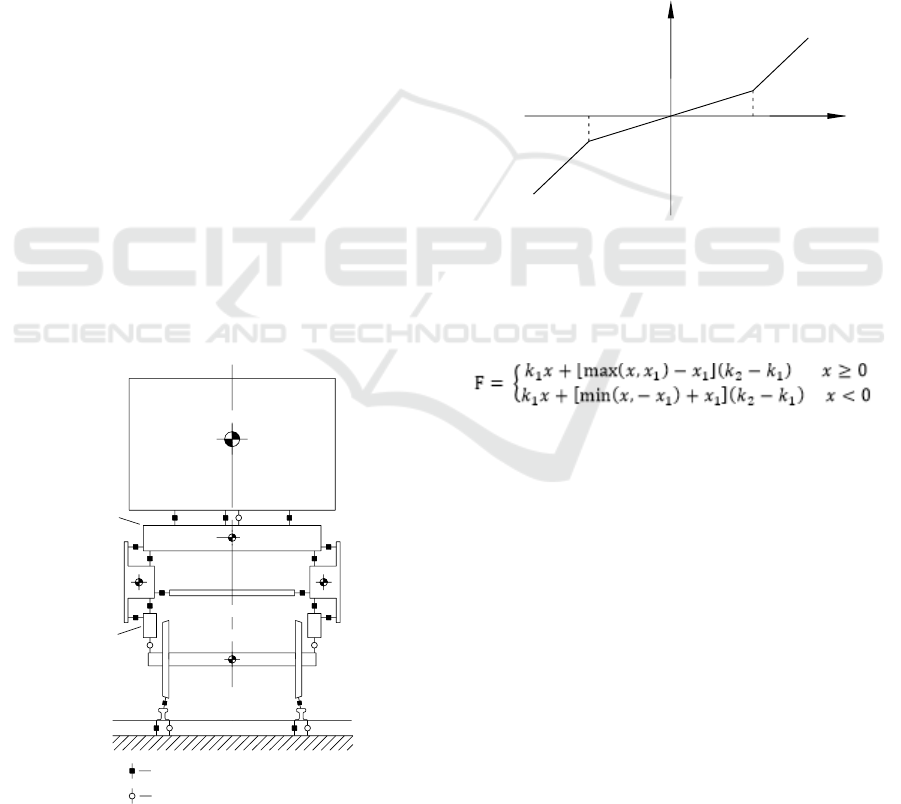
Figure 2. Force characteristic of two stage stiffness spring.
Figure.2 shows the two-stage stiffness spring
model, and it can be described by
(1)
Where x is the relative displacement of two parts,
k1, k2 are the two stage stiffness.
The total degrees of freedom (DOF) in the
railroad car system are listed in Table 1.
A MBS model of the car-rail coupling system is
established (Youm Y, 2005; Ahmed D. Shabana,
Jalil R. Sany. 2001; Jenkins H.H. 1974) in
SIMPACK environment based on the physical
model (Fig.1) and the DOF of it.
Carbody
Bolster
Side-frame
Axle-box
Wheelset
Cross Bracing
M
C
,I
C
Rail
Track-bed
M
W
,I
W
M
B
,I
B
M
SR
,I
SR
M
SL
,I
SL
force and damp
joint
x1
F
k1
k2
xo
-x1
ICVMEE 2019 - 5th International Conference on Vehicle, Mechanical and Electrical Engineering
156
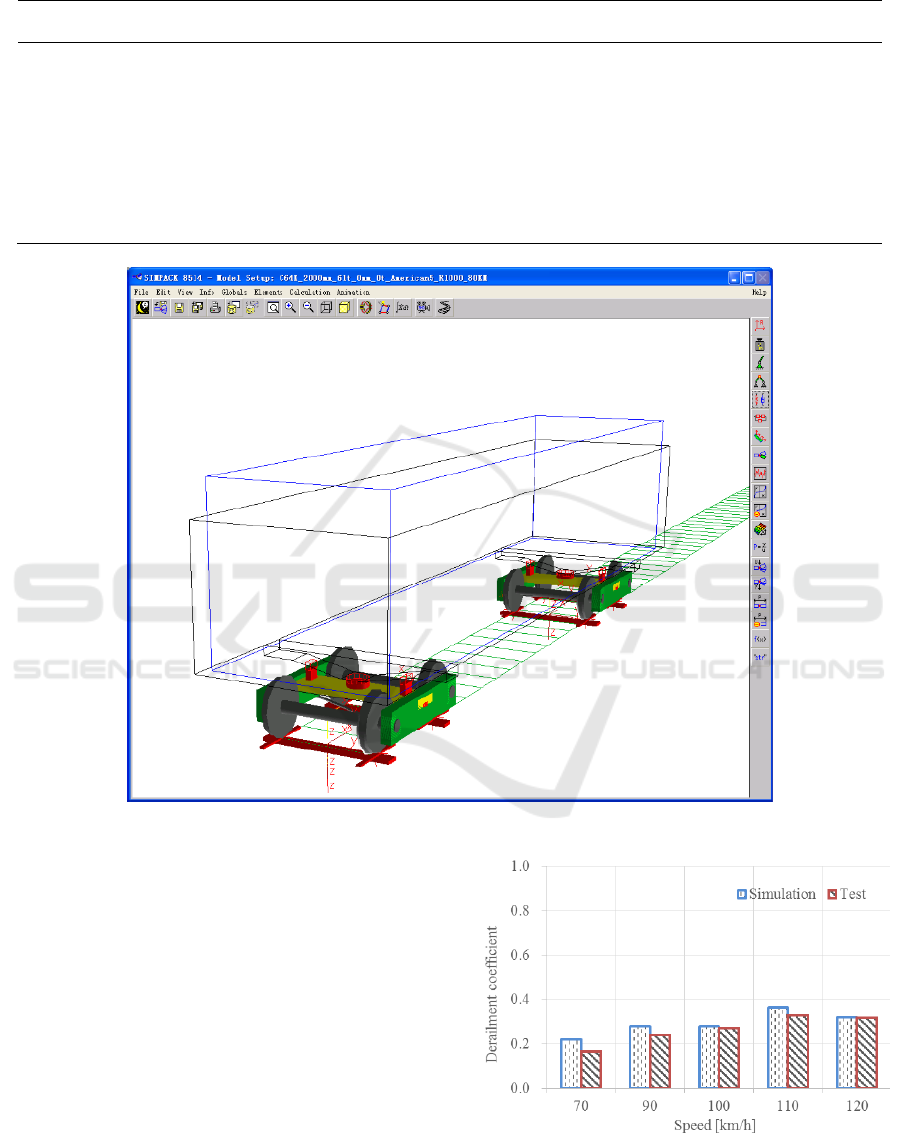
Table 1. DOF of railroad car system.
Number
Longitudinal
displacement
Lateral
displacement
Vertical
displacement
Roll
angle
Pitch
angle
Yaw
angle
Carbody
1
X
C
Y
C
Z
C
C
C
C
Lading
1
X
L
Y
L
Z
L
L
L
L
Bolster
2
X
B
Y
B
Z
B
B
B
B
Side-
frame
4
X
S
Y
S
Z
S
S
S
S
Axle-
box
8
X
A
Y
A
Z
A
A
A
A
Wheelset
4
X
W
Y
W
Z
W
W
W
W
Figure 3. MBS model of car-rail coupling system in SIMPACK.
Fig.3 shows the final MBS car-rail coupling
model in SIMPACK environment. The LM worn
wheel tread and 60kg/m Chinese standard rail profile
(TB/T 2341.3-93, 1993, TB/T 449-2003, 2003) are
used in the wheel rail contact model.
2.2 MBS Model Validation
The MBS model in SIMPACK needs a validation
before using it to analyze the permitted height of
combined center of gravity.
Figure 4. Derailment coefficient compare on tangent track.
Research on the Permitted Height of Combined Center of Gravity for Railroad Cars
157
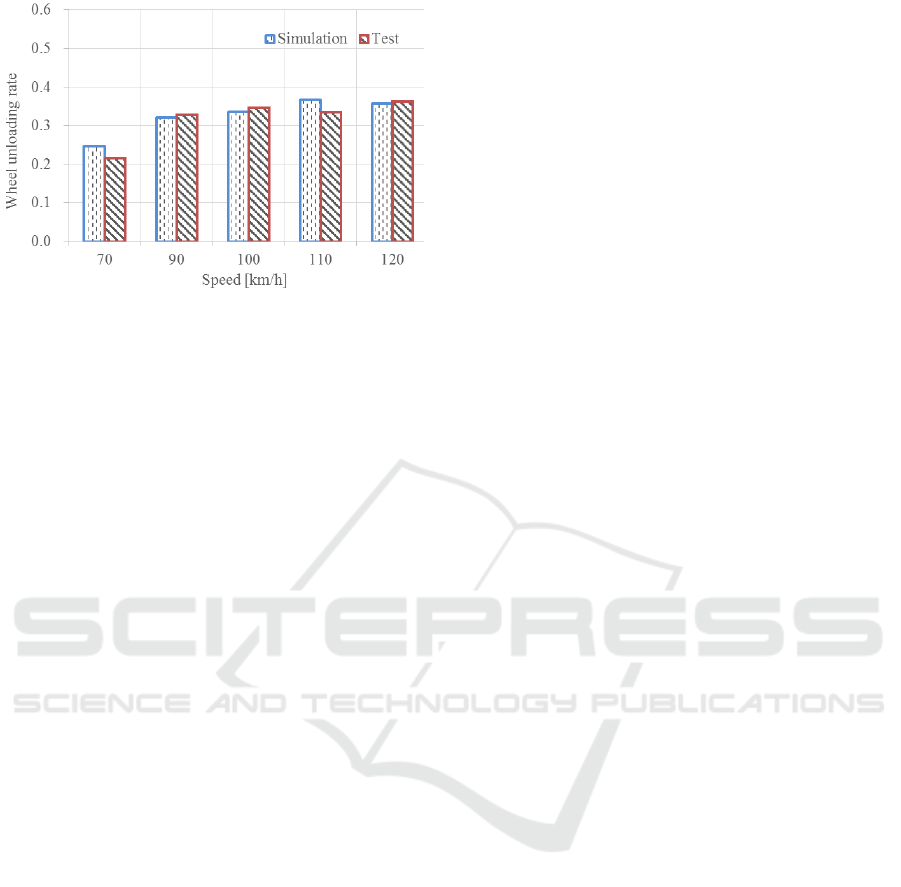
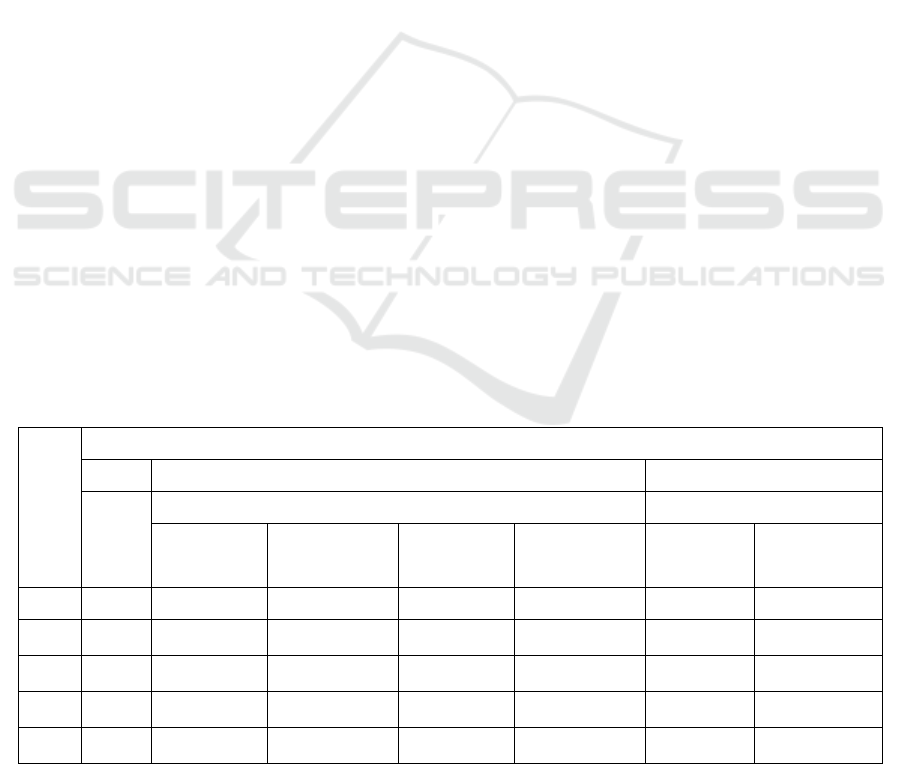
Figure 5. Wheel unloading rate compare on tangent track.
Figure.4 and Figure.5 show the derailment
coefficient and wheel unloading rate of the No.1
wheelset while the C70H car operates on a tangent
track at speed 70~120km/h. The data includes both
of the field test results and the simulation results.
The field test was conducted in the loop test line in
Beijing, and the simulation model has the same type
of car and loading status with the field test. Fig.4,
Fig.5 demonstrate that both of the field test results
and the simulation results have the same increasing
trend when the car speeds up, and they have small
difference. This difference may be come from the
actual track irregularity is more intense than the
AAR6 rail excitation that used in the simulation. The
mean relative errors for the derailment coefficient
and wheel unloading rate are 12.75% and 6.14%,
respectively, indicating that the simulation results
are accurate. A similar validation method is also
performed for C70H running on curves of R350m
and R600m, which show that the simulation model
has a good accuracy. So, the MBS model in
SIMPACK is validated accurate and effective for the
next work.
3 SIMULATION RESEARCH
3.1 Method
The permitted height of combined center of gravity
for railroad cars can be derived from the worst
operating condition. Thus, many conditions should
be simulated to find the worst operating condition.
Orthogonal experiment method (Nagesh, S, Murthy,
HNN, 2015) can be used to design simulation
schemes, then the number of simulation schemes is
decreased efficiently. Objective analysis and
variance analysis (Sivam, SP, Michaelraj, AL, 2014;
Saedon, JB, Jaafar, N, 2014) are carried out to get
the worst operating condition based on the
orthogonal experiment simulation results. Then,
different height of combined center of gravity are set
in the model and simulated to confirm the permitted
height.
3.2 Orthogonal Experiment Factors
The railroad freight car operating safety is affected
by height of combined center of gravity, lateral
deviation of lading’s center of gravity, track status,
loading status, railroad car performance, and so on
(Suarez, Berta, Felez, Jesus, 2013; Chen Chao; Han
Mei, 2012). All the factors can be divided into two
categories. One is the certain factors, includes the
height of combined center of gravity and lateral
deviation of lading’s center of gravity. The other is
the uncertain factors, includes the rest of factors.
The level of uncertain factors need to be analyzed
for orthogonal experiment schemes designing.
3.2.1 1st Factor-Railroad Car Level
The most general trucks used in Chinese railroad
freight car are K2, K4, K5, K6. K2 and K6 are cross
bracing trucks, but they have different axle-load.
The axle-load of K2 is 21t, and the axle-load of K6
is 25t. K4 and K5 are swing motion truck, and the
axle-load of K4 is 21t, and the axle-load of K5 is 25t.
The four types of trucks have different axle-load and
different structures, so each of them has unique
dynamic performance.
At the same time, many types of railroad car put
into operation, the general used mainly includes
gondola car, flat car, box car, tank car. Box car and
tank car have a maximum height of combined center
of gravity as the top are closed. So this paper does
not need to consider these two types of freight car.
After that, we can pay attention to the length of truck
centers. The freight cars equipped with the same
truck which has the longer truck centers has a good
dynamic performance (Taheri, Mehdi, Ahmadian,
Mehdi, 2015). The gondola car has a worse dynamic
performance than the flat car, as the length of truck
centers of gondola car which equipped with K2 or
K4 is 8700mm, and the length which equipped with
K5 or K6 is 9210. But the length of truck centers of
flat car which equipped with K2 or K4 is 9000mm,
and the length which equipped with K5 or K6 is
10920mm. From the study above, gondola car
equipped with four types of truck are the levels of
the 1st factor. The simulation railroad freight cars
are C64K, C64H, C70H and C70.
ICVMEE 2019 - 5th International Conference on Vehicle, Mechanical and Electrical Engineering
158
3.2.2 2nd Factor-Track Status and Speed
Level
Track status not only contains the track irregularity,
but also includes the curve radius and supper
elevation. Some of the existing railroad line in China
still keep the status as the Code for Design of
Railway Line in 1999 (GB 50090-99, 1999). The
railroad line in China is divided into three grades. In
this paper, four curves are selected from real railroad
line, two curves are from Grade I railroad in JingQin
line and the other two are from Grade III railroad in
JingCheng line. The four curves are R450m,
R1200m in JingQin line and R350m, R600m in
JingCheng line, the supper elevation for them are
80mm, 100mm, 120mm and 80mm.
The speed when running through a curve is
connect to the radius and supper elevation as the
centrifugal force. Balanced speed is the best, but
passenger train and freight train operating together
in the same line, so the supper elevation for different
speed is less balanced or over balanced. With the
curve radius, five levels for each railroad line are as
follows,
Grade I railroad in JingQin line: (R450m,
20km/h), (R450m, 77km/h), (R1200m, 40km/h),
(R1200m, 120km/h), (tangent track, 132km/h).
Grade III railroad in JingCheng line: (R350m,
20km/h), (R350m, 70km/h), (R600m, 20km/h),
(R600m, 70km/h), (tangent track, 70km/h).
3.2.3 3rd Factor-Loading Status Level
Regulations on Loading and Securing of Railway
Goods has a rule about the positon of lading’s center
of gravity on railroad freight car. In the longitudinal,
the load difference of two trucks must not exceed
10t, and for each truck load must not exceed half of
the car load limit. The average static load of the car
is not the same based on different types of goods.
The average static load of the car for timber is about
the same as car load limit, the average static load of
the car for cotton is 10t less than the car load limit
and for industrial machinery is 20t less than the car
load limit. So the loading status has three levels,
includes load and the longitudinal position of
lading’s center of gravity, (car load limit, center),
(10t less than car load limit, center), (10t less than
car load limit, 10t difference truck load), (20t less
than car load limit, center), (20t less than car load
limit, 10t difference truck load).
3.3 Schemes and Simulation Results
The orthogonal experiment in this paper has three
factors, railroad car has four levels, track status and
speed has five levels for each railroad line grade,
loading status has five levels. So this is an
orthogonal experiment at different levels (Khajeh,
MAZ; Shokrollahi, H, 2015). Quasi-level is
presented to converse the 4-5-5 different levels to 5-
5-5 equal-level (Bangxing Shen, Changjun Wen,
2005). The factors and levels are listed in Table 2.
Then we can use
)(L
6
25
5
orthogonal table to
design simulation schemes, column 4, 5, 6 are left
vacant as this orthogonal experiment only has three
factors (Chengjun Zhang, 2009). All the schemes are
defined in the MBS model and simulated in
SIMPACK.
Table 2. Factor levels for orthogonal experiment.
Level
No.
Factor
A
B
C
Car
Track status and speed
Loading status
Grade I
Radius(m)
Grade I
Speed(km/h)
Grade III
Radius(m)
Grade III
Speed(km/h)
Weight(t)
Truck load
difference(t)
1
C
64K
450
20
350
20
P
L
0
2
C
64H
450
77
350
70
P
L
-10
0
3
C
70H
1200
40
600
20
P
L
-10
10
4
C
70
1200
120
600
70
P
L
-20
0
5
C
70
Tangent
132
Tangent
70
P
L
-20
10
Research on the Permitted Height of Combined Center of Gravity for Railroad Cars
159
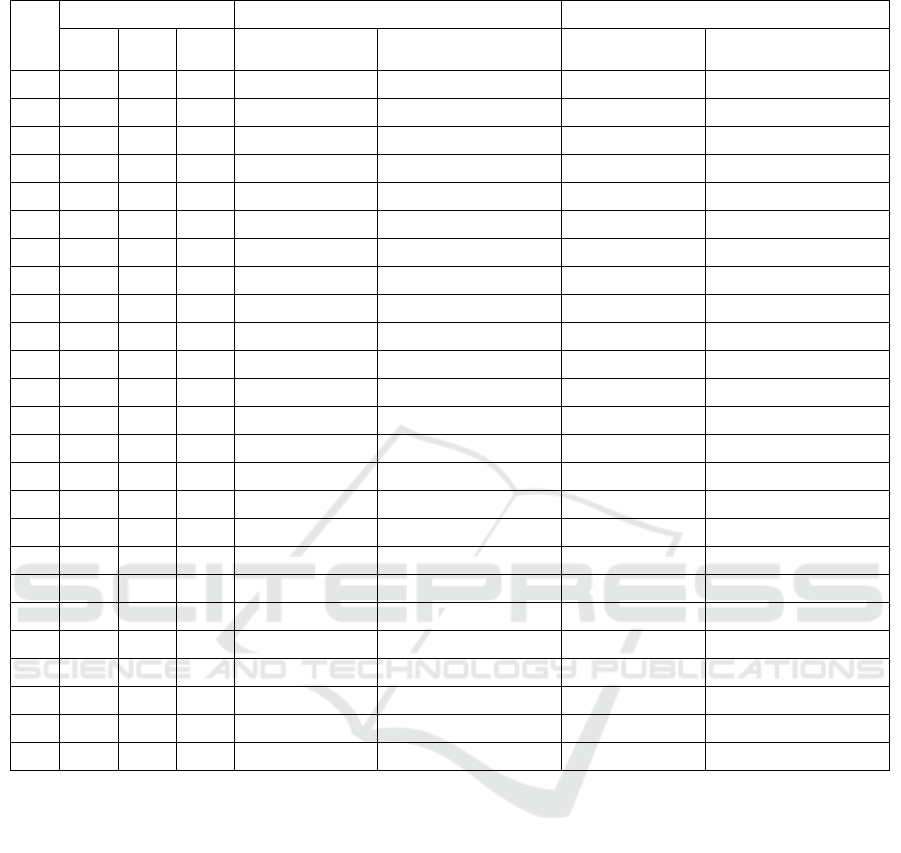
Table 3. Simulation results.
No.
Factors
Grade I
Grade III
A
B
C
Derailment
Coefficient
Wheel
Unloading Rate
Derailment
Coefficient
Wheel
Unloading Rate
1
1
1
1
0.344
0.258
0.482
0.294
2
1
2
2
0.227
0.201
0.41
0.267
3
1
3
3
0.266
0.259
0.372
0.338
4
1
4
4
0.326
0.356
0.456
0.285
5
1
5
5
0.377
0.445
0.323
0.308
6
2
1
2
0.368
0.351
0.515
0.384
7
2
2
3
0.245
0.33
0.323
0.364
8
2
3
4
0.273
0.33
0.382
0.399
9
2
4
5
0.274
0.494
0.384
0.381
10
2
5
1
0.223
0.279
0.312
0.217
11
3
1
3
0.373
0.349
0.502
0.394
12
3
2
4
0.249
0.308
0.349
0.337
13
3
3
5
0.282
0.334
0.395
0.408
14
3
4
1
0.323
0.287
0.452
0.268
15
3
5
2
0.223
0.298
0.312
0.227
16
4
1
4
0.376
0.261
0.526
0.321
17
4
2
5
0.272
0.196
0.41
0.268
18
4
3
1
0.234
0.188
0.328
0.237
19
4
4
2
0.327
0.268
0.31
0.199
20
4
5
3
0.337
0.378
0.372
0.202
21
5
1
5
0.401
0.299
0.561
0.368
22
5
2
1
0.27
0.122
0.378
0.196
23
5
3
2
0.241
0.205
0.391
0.259
24
5
4
3
0.35
0.328
0.49
0.223
25
5
5
4
0.303
0.298
0.346
0.191
Table 3 lists the simulation results of derailment
coefficient and wheel unloading rate for Grade I and
Grade III railroad line.
3.4 Statistics Analysis
Derailment coefficient and wheel unloading rate are
different kinds of indexes to evaluate railroad car
operating safety. The correlation coefficient between
these two indexes are calculated and the value are as
follows, the correlation coefficient for Grade I and
Grade III railroad line are 0.4021 and 0.3896. These
two values show that the derailment Coefficient and
wheel unloading rate have a poor correlation, which
indicates that the worst operating condition should
be confirmed based on derailment coefficient and
wheel unloading rate separately.
Aimed at the worst operating condition, Table 4
shows the objective analysis.
t1~ t5 are the average value of each level No.,
they can demonstrate the influence of each factor
level. R is the range, the first column’s range is
R=max{t1,t2,t3,t4}-min{t1,t2,t3,t4} and the 2nd and
3rd columns’ range is R=max{t1,t2,t3,t4,t5}-
min{t1,t2,t3,t4,t5}. The worst operating condition
can be got for each grade of railroad line from
objective analysis.
Objective analysis is a qualitative analysis
method, but variance analysis is a quantitative
analysis. The factors contribution rate can be
calculated by quantitative analysis. Take the
derailment coefficient of Grade I railroad line as an
example, we can derive the contribution rate as
follows.
ICVMEE 2019 - 5th International Conference on Vehicle, Mechanical and Electrical Engineering
160
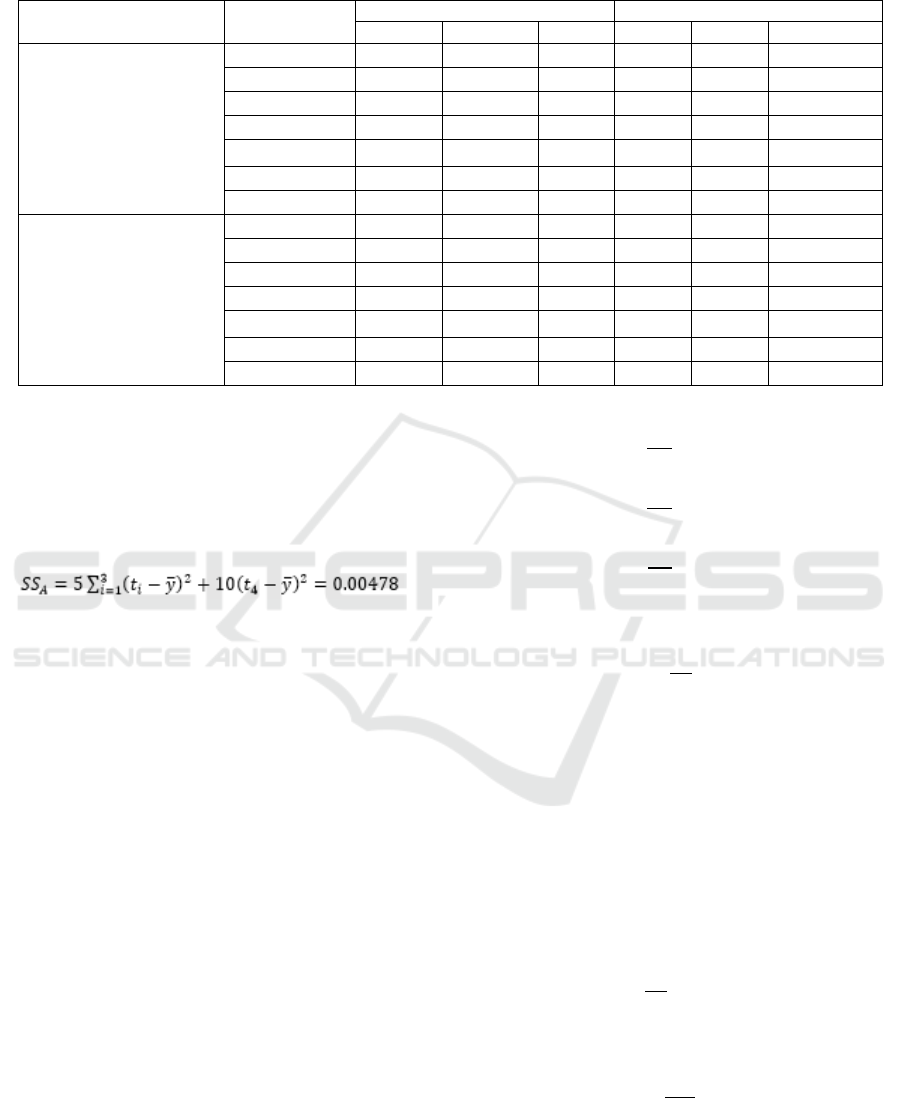
Table 4. Objective analysis.
Index
Item
Grade I
Grade III
A
B
C
A
B
C
Derailment Coefficient
t
1
0.308
0.3724
0.2788
0.4086
0.5172
0.3904
t
2
0.2766
0.2526
0.2772
0.3832
0.374
0.3876
t
3
0.29
0.2592
0.3142
0.402
0.3736
0.4118
t
4
0.3111
0.32
0.3054
0.4112
0.4184
0.4118
t
5
-
0.2926
0.3212
-
0.333
0.4146
R
0.0345
0.1198
0.044
0.028
0.1842
0.027
worst scheme
A
4
B
1
C
5
A
4
B
1
C
5
Wheel Unloading Rate
t
1
0.3038
0.3036
0.2268
0.2984
0.3522
0.2424
t
2
0.3568
0.2314
0.2646
0.349
0.2864
0.2672
t
3
0.3152
0.2632
0.3288
0.3268
0.3282
0.3042
t
4
0.2543
0.3466
0.3106
0.2464
0.2712
0.3066
t
5
-
0.3396
0.3536
-
0.229
0.3466
R
0.1025
0.1152
0.1268
0.1026
0.1232
0.1042
worst scheme
A
2
B
4
C
5
A
2
B
1
C
5
(1) Derailment coefficient dispersion square sum
Total dispersion square sum:
(2)
Factor dispersion square sum:
(3)
(4)
(5)
Error dispersion square sum:
(6)
(2) Degree of freedom
Total degree of freedom, factor A, B and C
degree of freedom:
(7)
(8)
(9)
Error degree of freedom:
(10)
(3) Average dispersion square sum
The average dispersion square sum of factor A,
B and C:
(11)
(12)
(13)
The average dispersion square sum of Error:
(14)
,
shows that the
influence from factor A and factor C is less than
factor B, so the average dispersion square sum and
degree of freedom of factor A and factor C are
added to error. The error’s new parameters are as
follows.
(15)
(16)
(17)
(4) F-test
(18)
From F critical value table,
,
, obviously,
, so factor B is a very significant factor for
Research on the Permitted Height of Combined Center of Gravity for Railroad Cars
161
derailment coefficient based on the significance
level . Factor A and factor C only have little
effect on derailment coefficient.
(5)Contribution rate
The sum of squares of factors B is
, so the contribution rate of
factor B is,
(19)
The rest contribution rate is come from factor A,
factor C and error.
Similar statistic method is performed for wheel
unloading rate and Grade III railroad line. No matter
the railroad line grade is, factor B is a very
significant factor for derailment coefficient, factor A
and factor C only have little effect on derailment
coefficient. But the three factors are very significant
factors for wheel unloading rate.
From the objective analysis, the worst operating
conditions for Grade I railroad are as follows,
(1) When use derailment coefficient, C70
gondola car, loaded 50t and 10t difference between
two trucks, R450m curve with an 80mm supper
elevation, the speed is 20km/h.
(2) When use wheel unloading rate, C64H
gondola car, loaded 41t and 10t difference between
two trucks, R1200m curve with a 90mm supper
elevation, the speed is 120km/h.
The worst operating conditions for Grade III
railroad are as follows,
(3) When use derailment coefficient, C70
gondola car, loaded 50t and 10t difference between
two trucks, R350m curve with a 120mm supper
elevation, the speed is 20km/h.
(4) When use wheel unloading rate, C64H
gondola car, loaded 41t and 10t difference between
two trucks, R350m curve with a 120mm supper
elevation, the speed is 20km/h.
3.5 The Permitted Height of Combined
Center of Gravity
The limit of derailment coefficient and wheel
unloading rate in China are 1.2 and 0.65 (GB 5599-
85, 1985). To confirm the permitted height of
combined center of gravity for railroad car, the
operating safety indexes must both under the limit.
In all the orthogonal experiment schemes, the height
of combined center of gravity is 2000mm. For the
convenience of work on site, the height of combined
center of gravity of the worst operating conditions
are set as 2100mm, 2200mm, 2300mm, 2400mm,
2500mm, 2600mm.
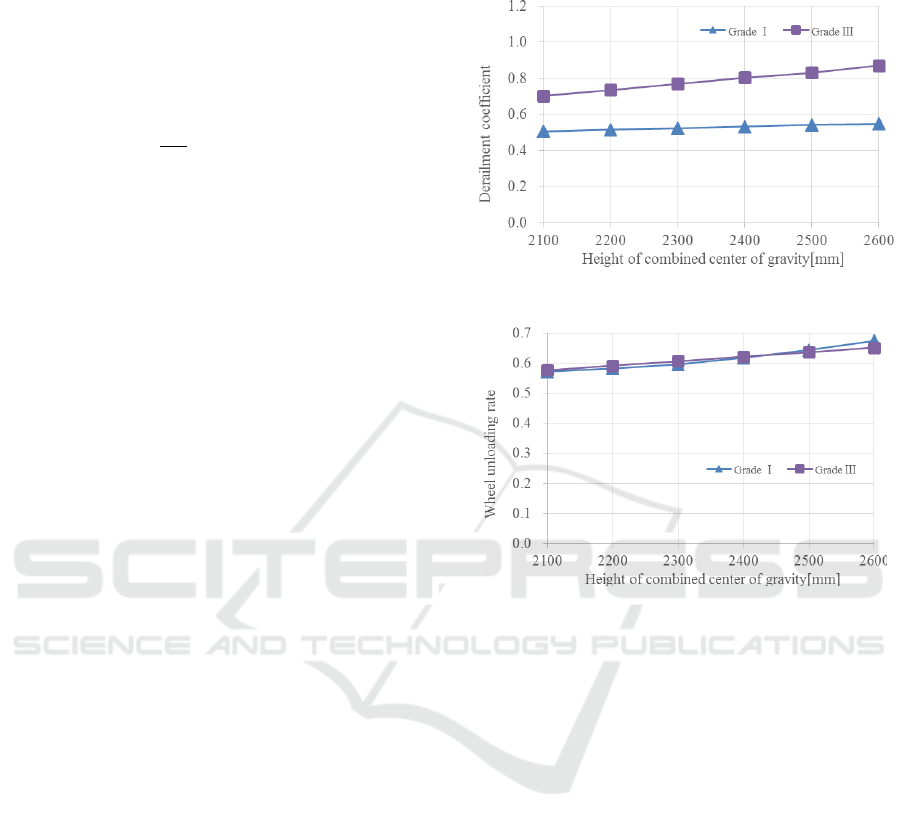
Figure 6. Derailment coefficient trend.
Figure 7. Wheel unloading rate trend.
Figure.6 and Figure.7 demonstrate the derailment
coefficient and wheel unloading rate of each height
of combined center of gravity for Grade I and Grade
III railroad line. Figure.6 shows that the derailment
coefficient does not exceed 1.2 even the height of
combined center of gravity is 2600mm. Figure.7
shows that the wheel unloading rate is over 0.65
based on the worst operating condition of Grade I
railroad line. But when the height of combined
center of gravity is 2500mm, they all under the limit.
So, the permitted height of combined center of
gravity for railroad cars is 2500mm in China.
4 CONCLUSION
A review of the literature in the field of the height of
combined center of gravity for railroad cars revealed
that the concepts of increase the permitted height is
possible. And this study can enhance the railroad
freight transportation capacity.
The factors that affect railroad car operating
safety can be divide into two categories, the certain
ICVMEE 2019 - 5th International Conference on Vehicle, Mechanical and Electrical Engineering
162

factors and the uncertain factors. The orthogonal
experiment method was used for analyzing the
uncertain factors. So the three uncertain factors are
studied and the levels of each factor are determined
for orthogonal experiment.
MBS model was used to simulate the railroad
freight car dynamic performance. The model was
validated by simulation and field test result
comparison. The operating condition are include
tangent track, R350m and R600m curves, they all
showed that the simulation model has a good
accuracy.
The worst operating conditions for Grade I
railroad and Grade III railroad were derived from
objective analysis. The variance analysis showed the
factors’ influence degree. Factor B is a very
significant factor for derailment coefficient, factor A
and factor C only have little effect on derailment
coefficient. But the three factors are very significant
factors for wheel unloading rate.
Based on the worst operating conditions and the
limit of derailment coefficient and wheel unloading
rate in China, we can simulate the different height of
combined center of gravity and get the permitted
height of combined center of gravity for railroad
cars can be increased to 2500mm in China.
Further work is underway to extend the MBS
modelling approach to deal with train simulation and
the braking and accelerating during operating. The
field test will be conducted to confirm the permitted
height of combined center of gravity for railroad
cars at last.
ACKNOWLEDGMENTS
This research was financially supported by the
National Key Research and Development Program
of China (Project No. 2018YFB1201402).
REFERENCES
AAR Open Top Loading Rules Manual (SECTION 1
General Rules for Loading All Commodities). (2010):
The Association of American Railroads.
Ahmed D. Shabana, Jalil R. Sany. (2001): A survey of rail
vehicle track simulations and flexible multibody
dynamics. Nonlinear Dynamics. Vol.26, pp.179-212.
Bangxing Shen, Changjun Wen. (2005): Experimental
design and engineering application. Beijing: Chinese
Metrology Press.
Chen Chao; Han Mei. (2012): Study of Railway Freight
Vehicle Body's Dynamic Model Based on Goods
Loading Technical Standards. International Workshop
on Information and Electronics Engineering, pp.3572-
3577.
Chengjun Zhang. (2009): Experimental Design and Data
Processing. Beijing: Chemistry Industry Press.
Field test about the permitted height of combined center of
gravity for double-deck container car. Beijing Jiaotong
University. 2007.
Field test about the permitted height of combined center of
gravity for tank car. Beijing Jiaotong University. 2008.
GB 50090-99. (1999): Code for design of railway line.
The ministry of China railways.
GB 5599-85. (1985): Railway vehicles-specification for
evaluation the dynamic performance and accreditation
test.1st ed. Beijing: National Bureau of Standard.
Haibo He. (1996): The relationship between height of
combined center of gravity of loaded car and operating
safety. Doctor Degree thesis. Beijing: Northern
Jiaotong University.
H.Г., Г.П., Lusheng Chen. (1965): Theory and methods of
loading and securing of railroad freight. Beijing:
China railway publishing house.
Hongnian Yan. (1991): Study of increasing the height of
combined center of gravity of loaded car. Doctor
Degree thesis. Beijing: Northern Jiaotong University.
Jenkins H.H. (1974): The effect of track and vehicle
parameters on wheel/rail vertical dynamic forces.
Railway Engineering Journal. Vol.3, pp.2-16.
Khajeh, MAZ; Shokrollahi, H. (2015): Study on the effect
of sol-gel parameters using the Taguchi technique to
achieve the optimal crystallite size and magnetic
properties of cobalt ferrite powders. Journal of sol-gel
science and technology. Vol.76, pp.271-278.
Mei Han, Yanling Wang, Liang Pang. (2007): Gravity
center height limit of loaded wagon based on safety
criteria for derailment coefficient. China Railway
Science. Vol.28, pp.106-110.
Nagesh, S, Murthy, HNN. (2015): Influence of nanofillers
on the quality of CO2 laser drilling in vinylester/glass
using Orthogonal Array Experiments and Grey
Relational Analysis. Optics and Laser Technology.
Vol.69, pp.23-33.
Renjun Wang, Jihua Chen, Hengchun Wang. (1982):
Problems about the center of gravity of loaded cars.
Sichuan: Railway society of Sichuan.
Saedon, JB, Jaafar, N. (2014): Multi-objective
optimization of titanium alloy through orthogonal
array and grey relational analysis in WEDM. 2nd
International Conference on System-Integrated
Intelligence - Challenges for Product and Production
Engineering. pp. 832- 840.
Sivam, SP, Michaelraj, AL. (2014): Statistical multi-
objective optimization of electrical discharge
machining parameters in machining titanium grade 5
alloy using graphite electrode. Proceedings of the
Institution of Mechanical Engineers Part B-Journal of
Engineering Manufacture. Vol.228, pp.736-743.
Suarez, Berta, Felez, Jesus. (2013): Sensitivity analysis to
assess the influence of the inertial properties of
railway vehicle bodies on the vehicle's dynamic
Research on the Permitted Height of Combined Center of Gravity for Railroad Cars
163

behavior. Vehicle System Dynamics. Vol.51, pp.251-
279.
Taheri, Mehdi, Ahmadian, Mehdi. (2015): Investigation of
parameters influencing hunting performance of a
railway vehicle with three-piece trucks. Proceedings of
the ASME joint rail conference.
TB/T 2341.3-93. (1993): 60kg/m rail type dimension. The
ministry of China railways.
TB/T 449-2003. (2003): Wheel profile for locomotive and
car. The ministry of China railways.
Wenpu Yang. (1957): Study of the height of combined
center of gravity of loaded car. Proceedings of 2nd
scientific symposium of Beijing Railroad Institutes
(Railroad transportation). pp.36-46.
Xiaoqiang Ding, Wentai Wu. (1982): The relationship
between height of combined center of gravity of
loaded car and overturning safety. Beijing: Beijing
Jiaotong University.
Youm Y. (2005): Multibody dynamics of closed, open,
and switching loop mechanical systems. Journal of
Mechanical Science and Technology, Vol. 19, pp.237-
254.
Yuanhan Wang. (1979): Research of the height of
combined center of gravity of loaded car in China.
Journal of Harbin railroad science. pp. 7-12.
ICVMEE 2019 - 5th International Conference on Vehicle, Mechanical and Electrical Engineering
164
