
Classification of Traditional and Modern Music
usin
g
NCC and k-NN
Elizabeth Nurmiyati Tamatjita
1
, Aditya Wikan Mahastama
2
1
Teknik Informatika, PTK, STMIK Widuri,
1
Jl Palmerah Barat No. 353, Jakarta 12210, Indonesia
2
FTI, Teknik Informatika, UKDW, Jl. Dr. Wahidin Sudirohusodo No. 5-25, Yogyakarta 55224, Indonesia
Keywords: Traditional Music, Modern Music, Time Domain, NCC, k-NN.
Abstract: Music is a means of interaction between humans which is transmitted as a presentation of feelings through
acoustic sensation. Music consists of instruments played ensemble, occasionally with vocal, to form a
harmony. The presence of certain instruments can be used to identify the genre of a music, and in turn its
origin. This research conducted classification of traditional, local contemporary, and foreign music – from
Indonesian point of view – according to instruments and beats. Genres chosen to represent the music in this
research, fall into six categories: Balinese, Javanese, Sundanese (traditional), Keroncong (local
contemporary), Classical and Latin (foreign). 180 pieces of music are used for training, and the same number
of pieces are used for testing; using samples of pieces with instruments only and also instruments with vocal.
To extract its features, each music pieces are cut into 30ms slices, then a representative vector of 3 time-
domain features is taken from every piece. Classification of test data is then conducted using Nearest Centroid
Classifier (NCC) and k-Nearest Neighbour (k-NN) with k=3 and k=5. Best results are obtained using k-NN
with k=3, generating the maximum 96.6% accuracy for Balinese, with an all-genre average of 73.89%. The
lowest accuracy rate belongs to Classical category, in which from the three tests, it is consistently rated under
50% with average of 36.67%.
1 INTRODUCTION
The identity of a nation is known through its
cultural tradition. Aside from its native language,
writing system and custom, tradition also live in folk
songs and music. This research’s topic is focused on
several genres of Indonesian traditional music,
contemporary local music, and foreign music, in
respect of Indonesian tradition.
What is called traditional music are music which
lives through generations of people from a certain
culture, maintained as means of entertainment or as
an integral element of the culture itself. Three
elements are affecting the continuity of a traditional
music: artists, the music itself, and its listeners. These
elements have to be together in motion to preserve
traditional music. The obvious problem is that the
tradition itself today are not taught widely in families
as years before, so that the artists and listeners
themselves may have difficulties in identifying
whether a song they are creating or listening are
belong to a genre of traditional music. This
degradation has caused traditional music to lose their
economic value – as not many people understand its
values anymore – thus in turn make them less and less
known, and rarely played outside traditional
ceremonies.
The identity of Indonesia traditional music is
formed during the Bronze Age, when continental
cultures emigrated to the Indonesian archipelago in
the third and second century B.C.E. This identity
remains in how Indonesian traditional music heavily
used percussion instruments such as kendang and
gong. Several regions also developed their own
musical instruments using whatever available locally,
for example the Sasando from Rote, Angklung from
Sunda, and various orchestral instruments like the
Gamelan from Javanese and Balinese cultures.
Contact with arriving foreign cultures also create
several kind of music which are specific to Indonesia,
such as Keroncong which comes from the contact of
many music elements from the island of Java with
Portuguese music. These kind of music are what we
regard as contemporary local music. Keroncong is
locally Indonesian, but it does not have a specific
cultural root to a certain culture of Indonesia. What
112
Tamatjita, E. and Mahastama, A.
Classification of Traditional and Modern Music using NCC and k-NN.
DOI: 10.5220/0008527301120117
In Proceedings of the 1st International Conference on Intermedia Arts and Creative Technology (CREATIVEARTS 2019), pages 112-117
ISBN: 978-989-758-430-5
Copyright
c
2020 by SCITEPRESS – Science and Technology Publications, Lda. All rights reserved
we are trying to achieve through this research is the
possibility to identify genres of music using
numerical features and computer algorithms, mainly
to identify Indonesian traditional music against
several other genres. From above we chose Javanese,
Balinese and Sundanese music as examples of
traditional music genres, Keroncong as an example of
contemporary local music genre, and two foreign
music genre: Classical and Latin.
Classical music is chosen because it comes from
another tradition: the so-called Western tradition and
it is widely spread throughout Europe during the 9
th
century up until now in the 21
st
century, nearly as a
common European identity. It has its root in Christian
and orchestral music, and aside from that, every
Classical composition has its own conformity of
notation, tempo, metrum, individual rhythm and
expressions which limits the room for improvisation
and ad-libitum ornamentation available in Asian
traditional music for example Japanese and Indian
traditional compositions.
Latin music, are music which have similarities to
traditional music from Portugal and Spain, which
termed música latina. This is a very wide “genre”,
covering a variety of rhythm and beats, and may come
from either the Iberian Peninsula or the “Ibero-
America”, sung in one of both languages. Even the
American music industry (RIAA) uses the term
“Latin” for any music or songs performed in Spanish
and distributed in the U.S. It is chosen because aside
from not having particularly clear features, the
biggest market for Latin music is Spain, Brazil,
Mexico and United States, and it is having foreign
elements compared to Indonesian traditional music.
This research is using time-domain features
classified with Nearest Centroid Classifier (NCC) and
k-Nearest Neighbour (k-NN) to identify 6 genres of
music: Traditional Javanese, Traditional Balinese,
Traditional Sundanese, Keroncong, Classical and
Latin.
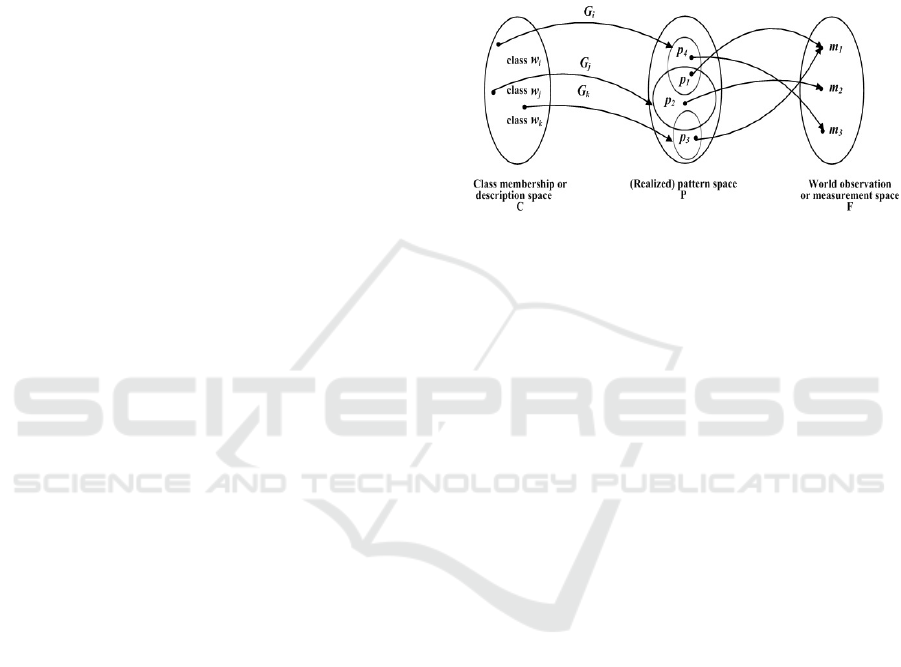
Pattern recognition may be characterized as an
information reduction, information mapping, or
information labeling process. An Abstract view of the
PR classification/description problem is shown in
Figure 1. We postulate a mapping between class-
member space, C, and pattern space, P. This mapping
is done via a relation, G
i
, for each class, and may be
probabilistic. Each class, w
i
, generates a subset of
‘patterns’ in pattern space, where the ith patter is
denoted p
i
. Note, however, that these subspaces
overlap, to allow pattern from different classes to
share attributes. Another relation, M, maps patterns
from subspaces of P into observations or measured
pattern or featured, donated m
i
. Using this concept,
the characterization of many PR problems is simply
that, given measurement mi, we desire a method to
identify and invert mappings M and G
i
for all
i
.
Unfortunately, in practice, these mappings are not
functions. Even if they were, they are seldom 1:1,
onto or invertible. For example, Figure 1 shows that
identical measurement or observations may result
from different p
i
, which in turn correspond to
different underlying classes. This suggests a potential
problem with ambiguity. Nevertheless, it seems
reasonable to attempt to model and understand these
processes, in the hope that this leads to better
classification/description techniques (Schalkoff,
1992).
Figure 1: Mappings in an abstract representation of
pattern generation/classification/interpretation systems
NCC calculates the centroid of every feature sets
form each class of genre, then the features obtained
from the test data is compared in terms of Euclidean
distance to each feature centroids. The test data is
then classified as the nearest class. k-NN employs the
similar distance measurement, but applied not against
class centroids. The distances are calculated from test
data against every class members, and then it is voted.
The new data belongs to the class with the highest
vote. For this vote to be successful, it has to be held
in odd numbers, e.g. k=3, k=5, and so on to avoid
truce. When there is no dominant class, a random
class is assigned, opt to be classless (not correctly
classified), or the class of the nearest member is
chosen.
Attempts to combine the benefits of these two
algorithms has been conducted by many, for example
Li et.al (2017), named KNCN (k-Nearest Centroid
Neighbor) classification, and its variants.
Experimental results on twelve real data sets obtained
from UCI machine learning repository show that the
new classifiers are effective algorithms for the
classification tasks, owing to their satisfactory
classification performance and robustness over a wide
range of k. (Li et al., 2017). Due to practical reasons,
this research is employing separate k-NN and NCC
for classification.
Features extracted from the music files are three
time-domain features in vector space model: Zero
Crossing Rate (ZCR), Average Energy (E) and Silent
Ratio (SR). The audio files of the music used as
training and test data are in waveform audio format
(WAV) to maintain sound quality. The uncompressed
Classification of Traditional and Modern Music using NCC and k-NN
113

data rate increases as more bits are used for
quantization of the stereo information, as opposed to
mono. It doubles the amount of bandwidth (in bits per
second) needed to transmit a digital audio signal (Li
& Drew, 2004). These files are obtained from
commercial music CD samples, which implies that an
efficient source selection has been implemented at a
primary stage (Gouyon et al., 2000).
2 FEATURE EXTRACTION
The time-domain features of an audio are selected for
this research, due to the goal of not seeking to
distinguish instruments or notes within the music
itself, but to obtain the beat and dominant amplitude
occurring at a certain pattern in the music. Time-
domain features are also easier to obtain, since they
can be extracted directly while reading the digital
samples of an audio file. The target is to extract
parameters from a relatively short signal (in terms of
duration), indicative of percussion beat and
significant noise (which may generated by any actual
noise, a sudden loudness or instruments played at the
same time) (Gouyon et al., 2000). Therefore Zero
Crossing Rate (ZCR), Average Energy (E) and Silent
Ratio (SR) are chosen as representative features for
the aforementioned purpose.
2.1 Data Collection and Selection
We collected and purchased audio CDs for the 6
genres used in this research and rip the audio into
stereo WAV files. The audio CDs are obtained from
several music stores and a radio station. This step is
taken to make sure that we have correctly label the
audio files to the correct genre before experiment
started, and that the music we obtained are from the
correct required genre.
After that we hand-picked the titles from the
collection to 360 titles, from which 180 are used to
train the system and 180 are used as the test data. All
30 titles are then processed using the program we
create for the research to extract the audio features,
and then processed further for the classification.
These music are not limited to those with instruments
only, pieces containing vocals are also included in the
selected set.
2.2 Audio Features
1. Zero Crossing Rate (ZCR)
ZCR is used to detect sign change in a successive
audio sample. The rate at which ZCR occur can be
used as a simple measure of the frequency content of
a signal. This can be used to detect stress in speech,
for example the voiced and voiceless pronunciation
of phonemes in certain language. Shete, et al. (2014)
used this to detect voicing in Devanagari phonemes
pronunciation, in which if ZCR rate is high, it is
voiceless, otherwise it is voiced.
ZCR indicates the frequency of sign-changing in
the signal, where a successive sample has a different
algebraic signs. A “positive” sample has the sign of
1, and a “negative” sample has the sign of -1. Every
sample is compared to the previous sample through
difference. All differences in absolute are then
summed and divided by two times of the number of
sample to form the final ZCR value (Lu, 1999).
Similar research to Shete, et al. (2014) have been
performed and the results are positive that ZCR is a
simple yet efficient way to detect voiced and non-
voiced pronunciation (Sharma & Talukdar, 2016).
Thus in this research, it is supposed to be able to
detect beat.
2. Average Energy
Average Energy (E) indicates the average amplitude
of a successive sample. It is normalized by the means
of square, because due the nature of waveform, a
sample may have a “negative”
amplitude value while emitting the same amount of
sound energy.
The value of Ē for a sample of certain duration is
formed by summing the square of each sample value
and then divided by the number of samples (Lu,
1999). This feature is used in this research to indicate
dominant amplitude value of a music piece.
3. Silence Ratio (SR)
SR indicates the time of silence compared to certain
duration of music sample, or in discrete term, the
amount of silent samples compared to all samples in
test. Silence here is a defined silence; it means that a
threshold is used to determine that a sample’s value is
small enough to be considered silent.
The value of SR is obtained by dividing the
number of silent samples with the number of total
sample. SR can be used to detect speech against not
speech, since a speaking person pauses a lot
compared to a song or a machine sound for example
(Lu, 1999). For this research, this feature is also
indicative of beat or tempo.
2.3 Experiments
Experiments are conducted in two parts: training and
testing process. For training, these steps are done after
the whole experimental data is collected and selected:
CREATIVEARTS 2019 - 1st International Conference on Intermedia Arts and Creative
114
1. Preprocess the data for feature extraction:
180 audio files for training are cut using the tool
we built into sample slices, each 30 milliseconds
in length.
2. For each file, three features (ZCR, E, SR) are
extracted from every 30ms slices and then
averaged and stored as single representative
feature vector for every audio file.
3. Each feature vector are labelled according to its
original genre from the audio file title and stored.
4. Training data set finished and genre class data has
formed.
5. Each class data’s centroid are calculated and
stored (for NCC calculation).
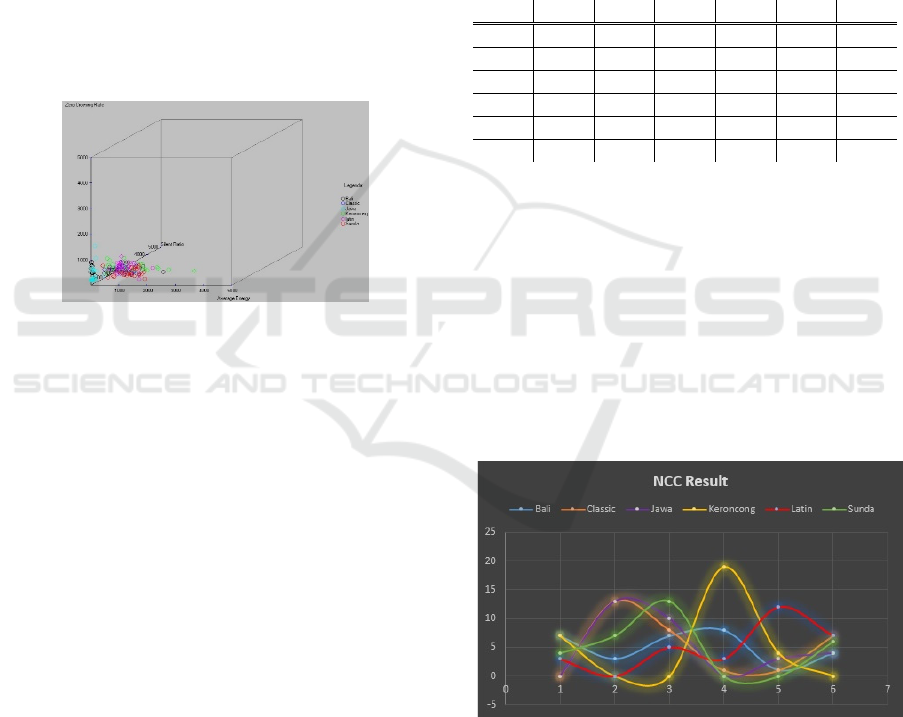
The result of the training process as feature vector
points in 3-dimensional vector space are shown in
Figure 2.
Figure 2: Training data in vector space model
For testing, these steps are taken:
1. Preprocess the data for feature extraction:
180 audio files for testing are cut using the tool we
built into sample slices, each 30 milliseconds in
length.
2. For each file, three features (ZCR, E, SR) are
extracted from every 30ms slices and then
averaged and keep in memory as single
representative feature vector for every test audio
file.
3. The obtained feature vector are compared into
existing genre class data:
- Using k-NN, it is compared to all stored data
and voted, genre class which got the most
data member voted (having the most nearest
member to the test data) are assigned as the
test data’s class
- Using NCC, it is compared to all stored genre
class centroid data, the class of the nearest
centroid are assigned as the test data’s class
4. Testing finished and the results are displayed on
screen.
Testing are conducted using NCC once and k-NN
twice, with k=3 and k=5 respectively.
2.4 Results
Experiment results using NCC are shown in Table 1
as a confusion matrix. Vertical axis is showing the
original genre of test data, horizontal axis showing the
resultant genre class.
Table 1 Confusion matrix of test using NCC
BC JK L S
B7378 1 4
C 0138 1 1 7
J 0 13 10 0 3 4
K70019 4 0
L3053 12 7
S 4 7130 0 6
Legend B : Balinese traditional
C : Classical
J : Javanese traditional
K : Keroncong
L : Latin
S : Sundanese traditional
Figure 3 shows the results in histogram of
classification result for each genre respectively, from
left to right: Balinese traditional, Classical, Javanese
traditional, Keroncong, Latin and Sundanese
traditional. The test data are colour-coded as curves.
Figure 3: Classification results with NCC
The correct classification rate using NCC are for
Balinese traditional: 23.33%, Classical: 43.33%,
Javanese traditional: 33.33%, Keroncong: 63.33%,
Latin: 40%, and Sundanese traditional: 20%.
Classification of Traditional and Modern Music using NCC and k-NN
115
Experiment results using k-NN with k=3 are shown
in Table 2 as a confusion matrix. Vertical axis is
showing the original genre of test data, horizontal axis
showing the resultant genre class. This experiment
shows a better result than using NCC.
Table 2 Confusion matrix of test using k-NN, k=3
B C J K L S
B 29 0 0 0 0 1
C 3 11 8 1 4 3
J 0 2 27 0 1 0
K 3 0 0 25 2 0
L 1 1 4 3 21 0
S 4 3 1 0 2 20
Legend B : Balinese traditional
C : Classical
J : Javanese traditional
K : Keroncong
L : Latin
S : Sundanese traditional
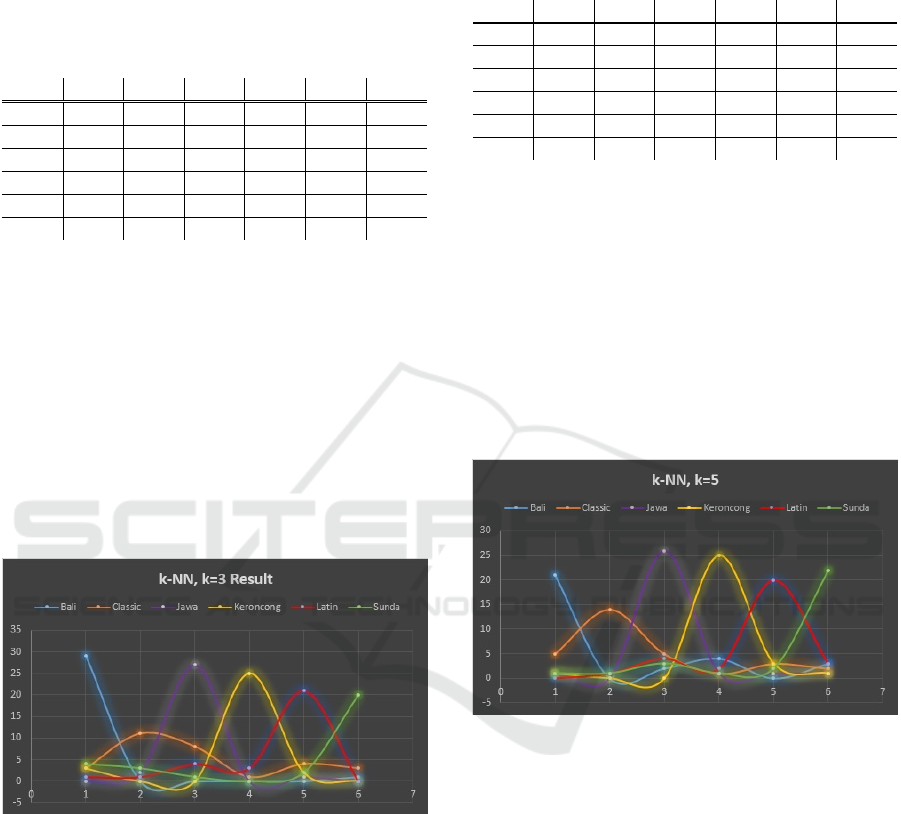
Figure 4 shows the results in histogram of
classification result for each genre respectively, from
left to right: Balinese traditional, Classical, Javanese
traditional, Keroncong, Latin and Sundanese
traditional. The test data are colour-coded as curves.
Figure 4: Classification results with k-NN, k=3
The correct classification rate using k-NN with k=3
are for Balinese traditional: 96.67%, Classical:
36.67%, Javanese traditional: 90%, Keroncong:
83.33%, Latin: 70%, and Sundanese traditional:
66.67%.
Experiment results using k-NN with k=5 are shown
in Table 3 as a confusion matrix. Vertical axis is
showing the original genre of test data, horizontal axis
showing the resultant genre class. This experiment
shows a better result than using NCC, but comparable
to k-NN with k=3.
Table 3 Confusion matrix of test using k-NN, k=5
BC JK L S
B210 2 4 0 3
C 5145 1 3 2
J 1 0261 1 1
K10025 3 1
L0142 20 3
S1131 2 22
Legend B : Balinese traditional
C : Classical
J : Javanese traditional
K : Keroncong
L : Latin
S : Sundanese traditional
Figure 5 shows the results in histogram of
classification result for each genre respectively, from
left to right: Balinese traditional, Classical, Javanese
traditional, Keroncong, Latin and Sundanese
traditional. The test data are colour-coded as curves.
Figure 5: Classification results with k-NN, k=5
The correct classification rate using k-NN with
k=5 are for Balinese traditional: 70%, Classical:
46.67%, Javanese traditional: 86.67%, Keroncong:
83.33%, Latin: 63.33%, and Sundanese traditional:
73.33%.
The results shown that there is no significant
difference between k=3 and k=5, since some classes
are showing a raise in figures in k=5 compared to k=3,
but other classes’ rate are decreasing, except for
Keroncong which displays exactly the same figures
for both k=3 and k=5. So either way, it is improper to
say that employing k=3 is better than k=5 or
otherwise.
CREATIVEARTS 2019 - 1st International Conference on Intermedia Arts and Creative
116

3 CONCLUSIONS
The choice of using time-domain features to classify
music genres in this research shows varying results.
When classification is performed using NCC, these
correct classification rates are obtained: Balinese
traditional: 23.33%, Classical: 43.33%, Javanese
traditional: 33.33%, Keroncong: 63.33%, Latin: 40%,
and Sundanese traditional: 20%. Generally, there are
no classification rate exceeding 63.33% for all genres
using NCC.
Classification using k-NN are better in figures,
with the lowest being Classical (36.67% with k=3 and
raised to 46.67% with k=5) with other genres varying
from 63.33% to 96.67% but having inconsistent
figure movement between k=3 and k=5, which is
decreasing for Balinese, Javanese traditional and
Latin, increasing for Classical and Sundanese
traditional, and stagnant for Keroncong.
Although the average correct classification rates
are 73.89% for k-NN=3 and 70.55% for k-NN with
k=5 compared to 37.22% for NCC, this doesn’t
simply conclude that k-NN with k=3 has the best
result. The significant difference of k-NN which
represents the spread of a class and NCC which
represent the centre of each class may be an indicator
of these:
1. Not every class has compact spread of its
members. There are too many variations of music
titles which can be regarded as belong to the same
class, or at least each class has a significant
amount of outliers. This is shown by the great
distance between outmost members, thus creating
a centroid which may be far in the centre, and
causing a nearby class which is more compact to
have a nearer centroid to the test data.
2. The time-domain features used may be strong for
some class, but weak for others. A clear example
is for the genre Classical. The features used in this
research, although proven strong for Classical
against other contemporary genres in other
research, it is very weak against traditional and
local music genres (especially Balinese, Javanese
and Keroncong), which made many Classical test
files being ended in other classes instead on its
own. This may conclude that traditional and local
music has stronger beats and rhythms than
Classical music.
ACKNOWLEDGEMENTS
The authors would like to express their gratitude to
LPPM PTK – STMIK Widuri which has funded this
research from the Penelitian Internal scheme. We
would also thank all entities who have helped in
providing data and genre labels for this research.
REFERENCES
Gouyon, F., Pachet, F., Delerue, O., 2000. Proceedings of
the COST G-6 Conference on Digital Audio Effects
(DAFX-00), Verona, Italy, December 7-9. On The Use
Of Zero-Crossing Rate for An Application of
Classification of Percussive Sounds,
Available at:
http://mtg.upf.edu/files/publications/dafx00-
gouyon.pdf, accessed January 7, 2019.
Lu, G., 1999, Multimedia Database Management Systems,
Artech House Inc. London, 1
st
edition.
Li, P., Gou, J., Yang H., 2017. Journal of Information
Hiding and Multimedia Signal Processing, ISSN 2073-
4212. Ubiquitous International Volume 8, Number 3,
May. The Distance Weighted K-nearest Centroid
Neighbor Classification,
http://bit.kuas.edu.tw/~jihmsp/2017/vol8/JIH-MSP
2017-03-011.pdf, accessed January 7, 2019.
Li, Z. N., Drew, M. S., 2004. Fundamentals of Multimedia,
Pearson, Prentice Hall, Upper Saddle River. New
Jersey, 1
st
editon.
Schalkoff, R. J., 1992, Pattern Recognition: Statistical,
Structural and Nural Approaches, John Wiley and Sons,
Inc. New York, 1
st
edition.
Sharma, B., Talukdar, P.H., 2016. International Journal of
Scientific & Engineering Research, Volume 7, Issue 12,
December-2016
402 ISSN 2229-5518 IJSER - Zero Crossing Rate Of
The Voice And Unvoiced Speech Signal Of Assamese
Words, https://www.ijser.org/researchpaper/Zero-
CrossingRate-Of-The-Voice-And-Unvoiced-Speech-
Signal-Of-Assamese-Words.pdf, accessed January 12,
2019.
Shete, D.S., Patil, S.B. and Patil, S.B. 2014. OSR Journal
of VLSI and Signal Processing (IOSR-JVSP), Volume
4, Issue 1, Ver. I (Jan. 2014), PP 01-05e-ISSN: 2319 –
4200, p-ISSN No. : 2319 –419. www.iosrjournals.org.
Zero crossing rate and Energy of the Speech Signal of
Devanagari Script,
https://pdfs.semanticscholar.org/1eef/24d79d7fa8dadb
869f62aecdd261258fddf1.pdf, accessed January 10,
2019.
Classification of Traditional and Modern Music using NCC and k-NN
117
