
M-Commerce Service and Application to Enhance Repurchase
Intention
Anis R. Amna and Supangat
Department of Informatics Engineering, University of 17 Agustus 1945 Surabaya, Jln. Semolowaru No. 45, Surabaya,
Indonesia
Keywords: Retail M-Commerce Service and Application, Consumer’s Purchase Intention, Stimulus Theoretical
Framework
Abstract: Rapid development of M-Commerce application (M-Commerce apps) and highly competitive market
encourage business to create innovative applications. Development of E-Marketplace in Indonesia increase
competition among business due to application benefits in enhancing bonding between existing customers
and the new one. In order to ensure repurchasing intention from customers, M-Commerce apps should be able
to satisfy particular needs and to enhance customers shopping experience. This study aims to evaluate the M-
Commerce application to enhance repurchasing intention using the apps. The data will be collected from 100
users and analysed using Partial Least Square – Structural Equation Modeling (SEM-PLS). The result shows
that application features drive customer to perceive ease of use, while perceived of ease of use (PEoU) and
information security are important factors to motivate users to use the mobile apps for repurchasing products.
1 INTRODUCTION
Vast growth of internet and mobile device penetration
in Indonesia make this country become the largest e-
commerce market in South East Asia (Priansa, 2016).
Whilst E-Commerce channels are continually
growing, nearly 75% of those transactions come
through mobile devices (Social and Hootsuite, 2018).
The large population of mobile users drives
massive development of online shopping technology,
business model, and ecosystems through mobile
applications. Customer loyalty program such as
rewards, gamifications, and advertisement through
the applications considered very important features to
create customers’ online behaviours (Hsu and Chen,
2018). This result is in line with previous studies that
revealed the importance of gamifications and rewards
for enhancing customers’ intention to install mobile
apps (Hwang and Choi, 2019) and strengthen
customers commitment to consume products
continuously (Leclercq, Hammedi and Poncin, 2018).
In Indonesia, retail stores are one of the most
affected business sector influenced with the
situations. The growth of online shopping channel
such as Lazada, Tokopedia, and Bukalapak truly
inspire small-medium business to broaden their
business digitally. In addition, enormous supports
from government and potential benefits from M-
Commerce apps motivate them for joining E-
Commerce apps to develop their own program. Most
of SMEs’ retail believe that adopting M-Commerce
apps is a key for business to retain their relationship
with customers through providing rewards, sharing
their shopping experiences, and yield particular
services as users need anytime anywhere (Iyer,
Davari and Mukherjee, 2018; Wang, Ou and Chen,
2019).
However, even though m-commerce apps is
considerably beneficial for both retailer and
customers, but highly investment and lack of
customers responses make this application need to
evaluated to make sure that customers are willing to
use application continuously (Onn Lee and Soon
Wong, 2016). Thus, this study will focus on
investigating what factors influence people to use M-
Commerce apps, if the apps can motivate users to
repurchase products using the channel, and whether
customer is willing to use M-Commerce apps
continuously.
R. Amna, A. and Supangat, .
M-Commerce Service and Application to Enhance Repurchase Intention.
DOI: 10.5220/0008433105150519
In Proceedings of the 2nd International Conference on Inclusive Business in the Changing World (ICIB 2019), pages 515-519
ISBN: 978-989-758-408-4
Copyright
c
2020 by SCITEPRESS – Science and Technology Publications, Lda. All rights reserved
515
2 LITERATURE REVIEW
M-Commerce apps concepts and development of
internet technology bring enormous impact to Retail
Small Medium Enterprise (SME’s). While in the past
people have bigger trust to brick-and-mortar shop,
recently they tend to shop online through their fingers
(Hew et al., 2016).
M-Commerce apps users are continuously
increase and have significant impact to business
performance since the apps offering people new
experience on shopping and browsing information
quickly. Digital service delivery channel, E-Payment,
and gamification are some attractive services for
customers. However, study from (McLean, Al-
Nabhani and Wilson, 2018) showed that instead of
utilitarian factors of technology, enjoyment and
screen size of mobile apps are also influence users to
continue using m-commerce apps in the future.
Another studies had performed to analyse
customer behaviour during mobile applications
usage. Some factors related to the use of technology
framework, such as Technology Acceptance Model
(TAM), Unified Theory of Acceptance and Use of
Technology (UTAUT) have been developed to
respond customer behaviour within online
environment (Taherdoost, 2018).
Structural Equation Modelling (SEM) through its
Partial Least Square (PLS) is a good method for
testing prediction-oriented goal as well as to provide
evaluation procedure for complex model structures
(Carlson et al., 2017). PLS enable users to construct
reflective and formative models, conduct concurrent
analysis and develop hypothesis as well as investigate
the relationship between variables in the same time
(Hair Jr et al., 2016). In marketing research, PLS-
SEM considered as very supportive method for
assessing the success of certain target constructs as
well as for estimating, monitoring, and benchmarking
particular key drivers of the model (Hair, Ringle and
Sarstedt, 2011).
3 METHODOLOGY
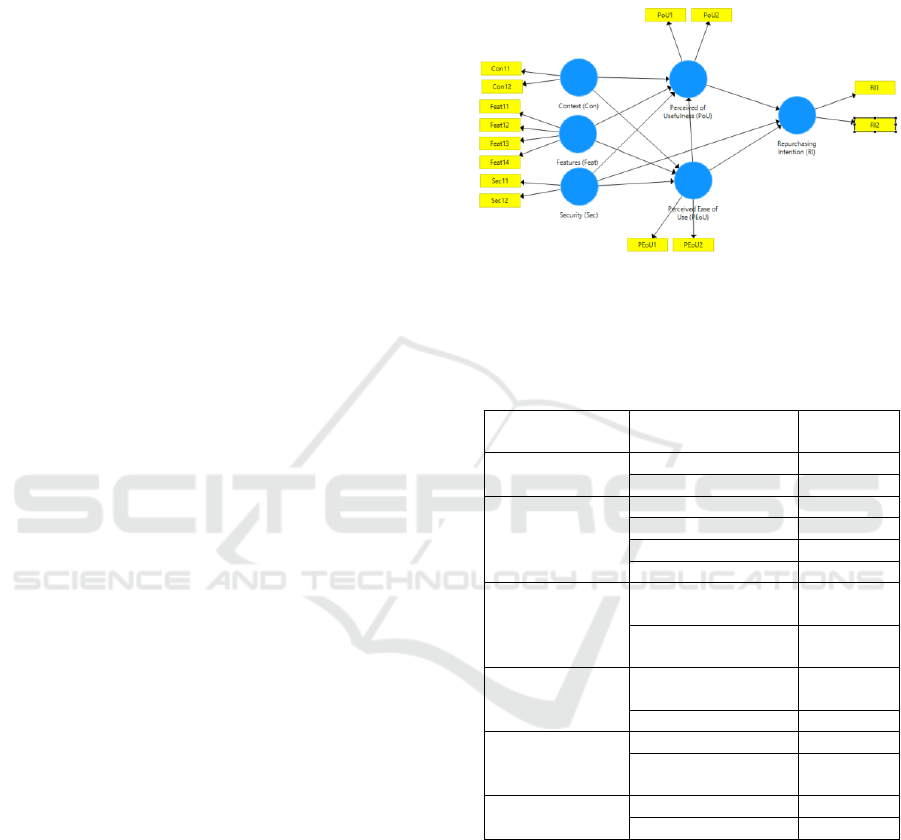
First, a research model based on Stimulus Theoretical
Framework (Lai, 2016) with context as an additional
latent factor is constructed (figure 1). The additional
dimension is included because it considered having
correlation with customer loyalty and their intention
for repurchasing products.
Afterwards, a set of close answer questionnaire
was given to 150 of M-Commerce users and it
succeed to collect 66.67% respond rate (100 data). To
measure the repurchasing intention using M-
Commerce apps, the five Likert-scale was used to
represent degree of answers, start from 1 that
represents strongly disagree to 5 that represents
strongly agree.
Figure 1: The Research Model
Dimensions and indicators that are used to
construct the model are listed as follow:
Table 1: Dimensions, Indicators, and Instrument Items
Dimensions
Indicators
Instrument
Items
Context (Con)
Advantages
Con11
Good Idea
Con12
Information Quality
Feat11
Features (Feat)
Service Benefits
Feat12
Convenience
Feat13
Easy to Use
Feat14
Security (Sec)
Information
Security
Sec11
Data Privacy
Guarantee
Sec12
Perceived of
Usefulness
Fast Response
PoU1
(PoU)
Real Time
PoU2
Perceived Ease
Efficiency
PEoU1
of Use (PEoU)
Customers’
Satisfactions
PEoU2
Repurchasing
Continuity
RI1
Intention (RI)
Commitment
RI2
In order to obtain influential factors on
repurchasing intention, following hypotheses were
constructed:
H1: Context of information (Con) affects
positively to perceived of usefulness (PoU)
H2: Context of information (Con) affects
positively to perceived ease of use (PEoU)
H3: M-Commerce features (Feat) affects
positively to perceived of usefulness (PoU)
H4: M-Commerce features (Feat) affects
positively to perceived ease of use (PEoU)
ICIB 2019 - The 2nd International Conference on Inclusive Business in the Changing World
516
H5: M-Commerce data and information security
(Sec) affects positively to perceived of usefulness
(PoU)
H6: M-Commerce data and information security
(Sec) affects positively to perceived ease of use
(PEoU)
H7: M-Commerce data and information security
(Sec) affects positively to repurchasing intention (RI)
H8: Perceived ease of use (PEoU) affects
positively to perceived of usefulness (PoU)
H9: Perceived ease of use (PEoU) affects
positively to repurchasing intention (RI)
H10: Perceived of usefulness (PoU) effects
positively to repurchasing intention (RI)
The data were analysed using Partial Least Square
software after it passed reliability analysis to ensure
model sufficiency. Composite reliability score in this
research is more than or equal to 0.7 and Cronbach
Alpha value should be more than 0.7 (Larasati,
Widyawan and Santosa, 2017).
Our surveys get feedback from 100 M-Commerce
apps users, where 50% of them are women and 35.3%
are men. Regarding to the age, users who are willing
to response dominantly ranging from 36 to 40
(35.3%) followed by age around 31 to 35 that
represent 23.5% respondents. Among 100 users,
94.1% of them has experience to shop online using
M-Commerce apps from Bukalapak (41.2%) and
Shopee (35.3%).
4 RESULT AND DISCUSSION
Before deciding influential factors of repurchasing
intention behaviour, sets of reliability and validity
testing have been conducted. To obtain a valid model,
loading factor of AVE for each latent variable should
be above 0.5 (Ghozali, 2014). Table 2 show that the
value of each latent variable is above 0.5, so each
variable indicates qualified for the model.
Table 2: Latent Variable AVE Value
Dimension
AVE
Context (Con)
0.776
Features (Feat)
0.687
Security (Sec)
0.890
Perceived Ease of Use (PEoU)
0.609
Perceived of Usefulness (PoU)
0.770
Repurchasing Intention (RI)
0.788
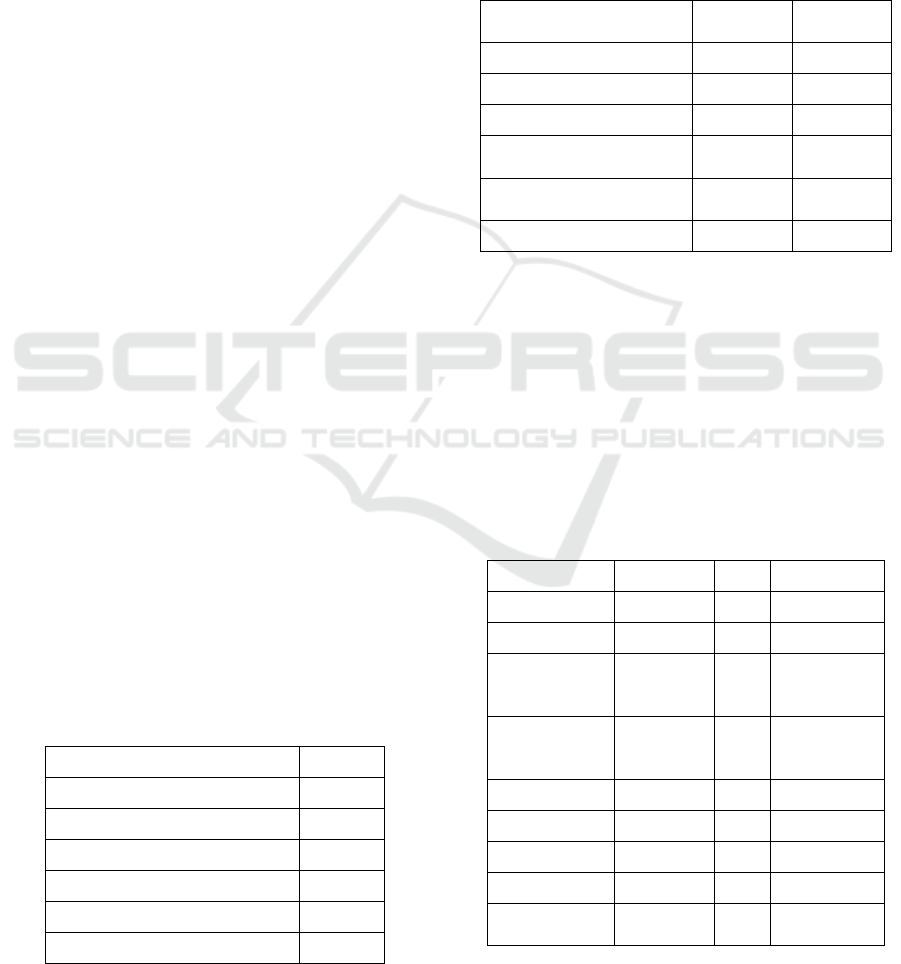
In order to measure reliability, composite
reliability and Cronbach’s alpha value should be
above 0.7 for explanatory research (Hair, Ringle and
Sarstedt, 2011). Table 3 shows that composite
reliability of each latent variable is above 0.7. That
means that in terms of composite reliability test, all
dimension in the model is reliable. However, the
value of PEoU’s Cronbach’s alpha is below 0.7.
Therefore, PEoU is not reliable to the model.
Table 3: Composite Reliability of Each Latent Variable
Dimension
Cronbach's
Alpha
Composite
Reliability
Context (Con)
0.712
0.874
Features (Feat)
0.846
0.897
Security (Sec)
0.877
0.942
Perceived Ease of Use
(PEoU)
0.574
0.754
Perceived of Usefulness
(PoU)
0.701
0.870
Repurchasing Intention (RI)
0.736
0.881
Structural model testing was conducted to
investigate latent variables relationship in the model.
It is started by calculating t-value of lanes coefficient
and T-value by using two-tailed test. By comparing
the value of lanes coefficient and T-Value, we can
conclude whether the hypothesis among the lines
were accepted or rejected. Minimum value of
accepted T-Value according to t-table is 1.96. So, t-
value below 1.96 will be rejected.
Table 4: Lanes’s Coefficient, T-value, and Hypothesis
Explanation of Each Latent Variable
Lanes
Lanes' Coef.
T-Val
Explanation
Con → PoU
0,102
0,610
Insignificant
Con → PEoU
0,251
1,623
Insignificant
PoU →
Repurchasing
Intention
0,117
1,135
Insignificant
PEoU→
Repurchasing
Intention
0,333
3,394
Significant
PEoU → PoU
0,248
1,999
Significant
Feat → PoU
-0,051
0,331
Insignificant
Feat → PEoU
0,277
1,984
Significant
Security → PoU
0,369
2,898
Significant
Security →
PEoU
0,207
1,390
Insignificant
M-Commerce Service and Application to Enhance Repurchase Intention
517
Security →
Repurchasing
Intention
0,396
3,132
Significant
From the table 4 it is shown that repurchasing
intention behaviour is influenced significantly by
perceived of ease of use (PEoU), while in the same
time perceived of ease of use (PEoU) and information
security as well as data privacy guarantee also trigger
user to believe that the apps is useful. Meanwhile,
user perception about application simplicity is closely
related to information quality, service, convenience,
and easiness that should be represented in the
features.
To evaluate the validity of structural model,
variance of endogenous latent variables’ should be
high depends on particular research discipline. For
customer behaviour study, high level of variance is
represented by R-square >= 0.2. In this research,
endogenous latent variables that should meet the R-
square requirement are Perceived of Usefulness
(PoU), Perceived of Ease of Use (PoU), and
Repurchasing Intention. The result from table 5
shows that R-square value of each endogenous latent
variable is above 0.2, therefore the model is sufficient
to show customer behaviour.
Table 5: R
2
value of Endogenous Latent Variable
Endogenous Variable
R-Square
Perceived of Ease of Use (PEoU)
0,419
Perceived of Usefulness (PoU)
0,342
Intention to Repurchase
0,521
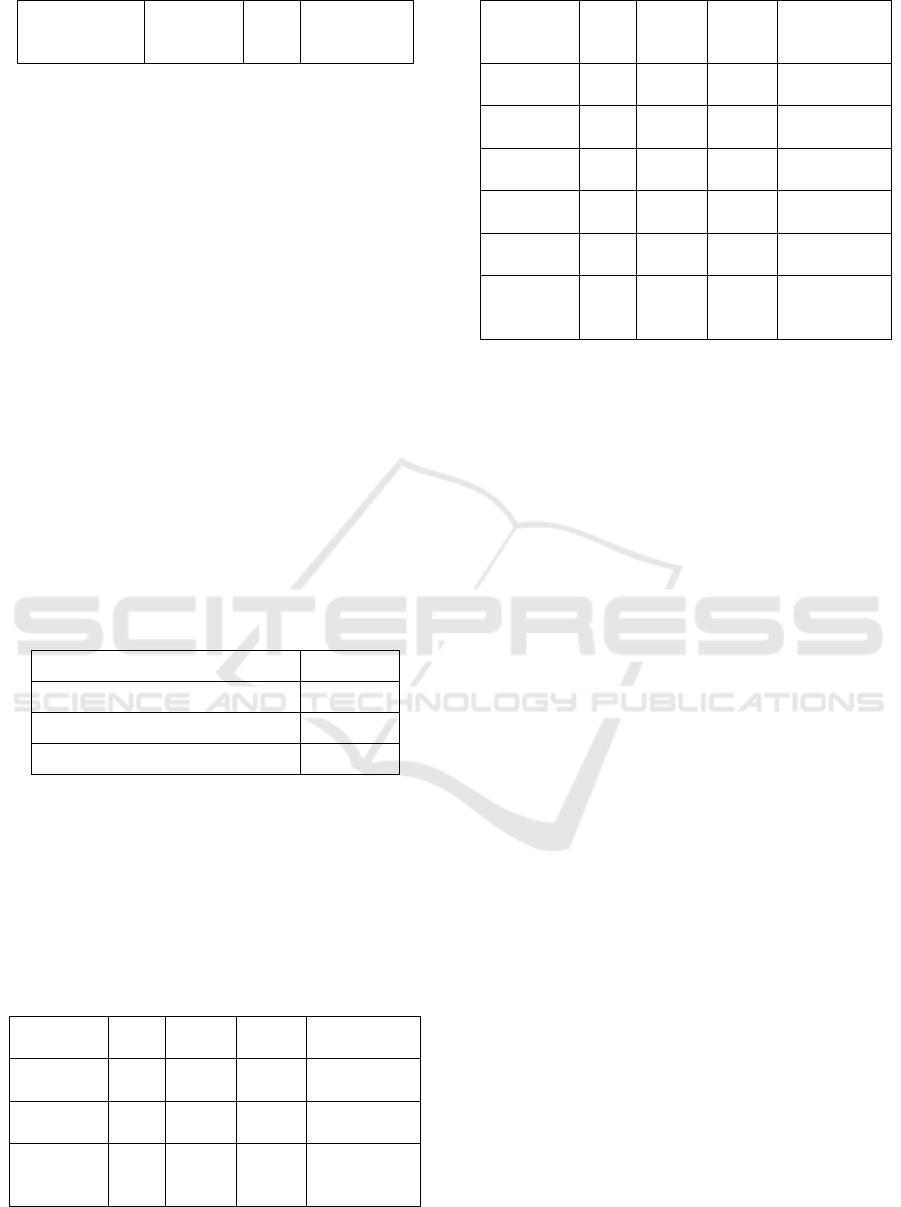
Finally, acceptance of the proposed hypothesis
will be analysis since the structural model testing
showed good result. For doing so, each lanes of
dimension will be represented by hypothesis and T-
value then the decision will be made by comparing T-
value to t-table using two-tailed test at significance
level of 0.05 (t-value >=1.96, p-value <=0.05).
Table 6: Hypothesis testing and conclusions
Lanes
Hypo-
tesis
T-Value
P-Value
Explanation
Con -> PoU
H1
0,61
0,542
Hypotesis was
rejected
Con ->
PEoU
H2
1,623
0,105
Hypotesis was
rejected
PoU ->
Intention to
Repurchase
H3
1,135
0,257
Hypotesis was
rejected
PEoU ->
Intention to
Repurchase
H4
3,394
0,001
Hypotesis was
accepted
PEoU ->
PoU
H5
1,999
0,046
Hypotesis was
accepted
Feat -> PoU
H6
0,331
0,741
Hypotesis was
rejected
Feat ->
PEoU
H7
1,984
0,047
Hypotesis was
accepted
Security ->
PoU
H8
2,898
0,004
Hypotesis was
accepted
Security -
>PEoU
H9
1,39
0,165
Hypotesis was
rejected
Security ->
Intention to
Repurchase
H10
3,132
0,002
Hypotesis was
accepted
5 CONCLUSION
To conclude, this study aims to understand influential
factors on M-Commerce use in customer’s
repurchasing intention. In order to achieve the
objectives, a research model based on Stimulus
Theoretical Framework and Technology Acceptance
Model is developed. The result showed that perceived
of ease of use (PEoU) and security factors were
dominantly control user repurchasing behaviours,
while perceived ease of use and security factors were
also lead to usefulness perception on the M-
Commerce apps.
While M-Commerce apps is closely related to E-
Payment, this research find that security plays
significant impact on user willingness to use the apps
and repurchasing intention. Thus, this finding is
important for further development of M-Commerce
apps since improvement on data privacy guarantee
and information security will increase customers’
trust therefore will rise the number of M-Commerce
users. The finding is similar to prior studies (Jahangir
and Begum, 2013; Lai, 2016; Chong et al., 2018) that
mentioned M-Commerce security as an important
factor for customer decision making and adaptation.
In terms of M-Commerce features, convenience
and information quality are prominent for
repurchasing intention. In this research, this situation
occurs because particular knowledge is essential for
purchasing certain products. This finding is similar
with the finding from previous studies (Kassim et al.,
2012; Lai, 2016). However, the reliability test found
that PEoU’s value is unreliable, thus the hypothesis
acceptance related to PEoU should be further
analysed to find out whether this phenomenon only
happened in specific M-Commerce retail applications
or in general apps.
ICIB 2019 - The 2nd International Conference on Inclusive Business in the Changing World
518

ACKNOWLEDGEMENTS
The authors would like to acknowledge the Research
and Community Service of University of 17 Agustus
1945 Surabaya and Arrayana Honey for the financial
and data support in conducting the research.
REFERENCES
Carlson, J. et al. (2017) ‘Feel the VIBE: Examining value-
in-the-brand-page-experience and its impact on
satisfaction and customer engagement behaviours in
mobile social media’, Journal of Retailing and
Consumer Services. Elsevier Ltd, 46(October 2017),
pp. 149–162. doi: 10.1016/j.jretconser.2017.10.002.
Chong, I. et al. (2018) ‘Influence of privacy priming and
security framing on mobile app selection’, Computers
and Security. Elsevier Ltd, 78, pp. 143–154. doi:
10.1016/j.cose.2018.06.005.
Ghozali, I. (2014) Structural equation modeling: metode
alternatif dengan partial least square (PLS). Semarang:
Badan Penerbit Universitas Diponegoro. Available at:
https://books.google.co.id/books?id=x1ZAngAACAA
J.
Hair, J. F., Ringle, C. M. and Sarstedt, M. (2011) ‘PLS-
SEM: Indeed a Silver Bullet’, The Journal of Marketing
Theory and Practice, 19(2), pp. 139–152. doi:
10.2753/MTP1069-6679190202.
Hair Jr, J. F. et al. (2016) A primer on partial least squares
structural equation modeling (PLS-SEM). Sage
Publications.
Hew, J. J. et al. (2016) ‘Mobile social commerce: The
booster for brand loyalty?’, Computers in Human
Behavior. Elsevier Ltd, 59, pp. 142–154. doi:
10.1016/j.chb.2016.01.027.
Hsu, C. L. and Chen, M. C. (2018) ‘How gamification
marketing activities motivate desirable consumer
behaviors: Focusing on the role of brand love’,
Computers in Human Behavior. Elsevier, 88(June), pp.
121–133. doi: 10.1016/j.chb.2018.06.037.
Hwang, J. and Choi, L. (2019) ‘Having fun while receiving
rewards?: Exploration of gamification in loyalty
programs for consumer loyalty’, Journal of Business
Research. Elsevier, (November 2017), pp. 1–12. doi:
10.1016/j.jbusres.2019.01.031.
Iyer, P., Davari, A. and Mukherjee, A. (2018) ‘Investigating
the effectiveness of retailers’ mobile applications in
determining customer satisfaction and repatronage
intentions? A congruency perspective’, Journal of
Retailing and Consumer Services. Elsevier Ltd,
44(January), pp. 235–243. doi:
10.1016/j.jretconser.2018.07.017.
Jahangir, N. and Begum, N. (2013) ‘The role of perceived
usefulness, perceived ease of use, security and privacy,
and customer attitude to engender customer adaptation
in the context of electronic banking’, African Journal of
Business Management, 2(1), pp. 32–40. Available at:
http://www.academicjournals.org/AJBM.
Kassim, E. S. et al. (2012) ‘Information System Acceptance
and User Satisfaction: The Mediating Role of Trust’,
Procedia - Social and Behavioral Sciences. Elsevier
B.V., 57, pp. 412–418. doi:
10.1016/j.sbspro.2012.09.1205.
Lai, P. C. (2016) ‘Design and Security impact on
consumers’ intention to use single platform E-
payment’, Interdisciplinary Information Sciences,
22(1), pp. 111–122. doi: 10.4036/iis.2016.R.05.
Larasati, N., Widyawan and Santosa, P. I. (2017)
‘Technology Readiness and Technology Acceptance
Model in New Technology Implementat ion Process in
Low Technology SME s’, International Journal of
Innovation, Management and Technology, 8(2), pp.
113–117. doi: 10.18178/ijimt.2017.8.2.713.
Leclercq, T., Hammedi, W. and Poncin, I. (2018) ‘The
Boundaries of Gamification for Engaging Customers:
Effects of Losing a Contest in Online Co-creation
Communities’, Journal of Interactive Marketing.
Elsevier Inc., 44, pp. 82–101. doi:
10.1016/j.intmar.2018.04.004.
McLean, G., Al-Nabhani, K. and Wilson, A. (2018)
‘Developing a Mobile Applications Customer
Experience Model (MACE)- Implications for
Retailers’, Journal of Business Research. Elsevier,
85(February 2017), pp. 325–336. doi:
10.1016/j.jbusres.2018.01.018.
Onn Lee, W. and Soon Wong, L. (2016) ‘Determinants of
Mobile Commerce Customer Loyalty in Malaysia’,
Procedia - Social and Behavioral Sciences. Elsevier
B.V., 224(August 2015), pp. 60–67. doi:
10.1016/j.sbspro.2016.05.400.
Priansa, D. J. (2016) ‘Pengaruh E-Wom dan Persepsi Nilai
Terhadap Keputusan Konsumen untuk Berbelanja
Online di Lazada’, Ecodemia, IV(1), pp. 117–124.
Social, W. A. and Hootsuite (2018) Digital in 2018
Essential Insight into Internet, Social Media, Mobile,
and E-Commerce Use Around the World.
Taherdoost, H. (2018) ‘A review of technology acceptance
and adoption models and theories’, Procedia
Manufacturing. Elsevier B.V., 22, pp. 960–967. doi:
10.1016/j.promfg.2018.03.137.
Wang, W. T., Ou, W. M. and Chen, W. Y. (2019) ‘The
impact of inertia and user satisfaction on the
continuance intentions to use mobile communication
applications: A mobile service quality perspective’,
International Journal of Information Management.
Elsevier, 44(October 2018), pp. 178–193. doi:
10.1016/j.ijinfomgt.2018.10.011.
M-Commerce Service and Application to Enhance Repurchase Intention
519
