
Long Term Financial Planning using Financial Performance Analysis
and Prospective Analysis in XYZ Workshop
Hani Novanti and Hasnul Suhaimi
Magister of Management, University of Indonesia, Salemba Raya, Jakarta, Indonesia
Keywords: Business Coaching, Financial Analysis, Financial Projection, Small and Medium Business Enterprises
(SMEs), Workshop.
Abstract: This research is in the form of business coaching conducted at SME XYZ Workshop, located in Margonda
Raya, Depok. This study aims to address the challenge in constructing financial projection for small business
based on the experience of the XYZ Workshop. A series of structured coaching and interviews with the
owner and staff with additional secondary data from the historical financial transaction of XYZ Workshop
in Depok. Subsequently, the results were analyzed with gap analysis and financial analysis. Based on the
mapping of the condition of the workshop, there is some gap between the actual conditions that occur with
the expected ideal condition. One of that is, the owner of XYZ Workshop didn't use financial analysis and
projection for investing and capital budgeting decision. The need for financial analysis and was a proposal
submitted to XYZ Workshop. This business coaching process is expected to help XYZ Workshop and other
SMEs to improve their performance.
1 INTRODUCTION
Vehicle maintenance business opportunities that meet
customer criteria are captured by XYZ Workshop
which was built in mid -1993 by the husband and wife
couple of Mr. A and Mrs. B. This business is an
expansion of his business from similar business field,
namely workshop. The establishment of XYZ
Workshop is intended to capture business
opportunities from the development and growth of the
city of Depok. XYZ Workshop was inaugurated in
May 1994, by Marketing Director of PT Bridgestone
Tire Indonesia. This inauguration also indicates that
XYZ Workshop has been considered by PT
Bridgestone Tire Indonesia as a business partner, by
making XYZ Workshop as an authorized outlet for
Bridgestone brand tire sales.
Core business XYZ Workshop is thorough
maintenance and repair of 4 wheel vehicles. With the
concept of "one stop service" - which consists of the
concept of vehicle maintenance, general repair, car
salon, the availability of tires, spare parts, lubricants,
accessories and others - XYZ Workshop is expected
to provide comprehensive service workshop in one
place. Nevertheless, the founders realized that the
workshop field is so vast that it can be very difficult
and almost impossible to fulfill all types of workshop
services. In this context, until now the XYZ
Workshop does not have any kind of repair service
body repair and painting.
One effort to empower SMEs can be done through
business coaching. Today, many business actors are
beginning to agree that coaching can be one of the
business development efforts. According to Passmore
(2010), an important part of a coaching process is to
empower people by facilitating learning for
themselves, personal growth, and performance
improvements.
Through the business coaching process conducted
by the writer and team of XYZ Workshop, several
problems were encountered, such as problems related
to the opening of new branches, loyalty program,
marketing communications, human resources, and
also problems related to financial management
systems. Based on the result of independence
assessment conducted by Yayasan Dharma Bhakti
Astra (YDBA) to XYZ Workshop as one of its partner
SMEs, from the financial aspect it is known that XYZ
Workshop does not have budgeting system for
making financial decisions. XYZ workshop has not
implemented financial management systems.
Based on the interviews of owners and
employees, direct observation, and mapping of
438
Novanti, H. and Suhaimi, H.
Long Term Financial Planning using Financial Performance Analysis and Prospective Analysis in XYZ Workshop.
DOI: 10.5220/0008432304380449
In Proceedings of the 2nd International Conference on Inclusive Business in the Changing World (ICIB 2019), pages 438-449
ISBN: 978-989-758-408-4
Copyright
c
2020 by SCITEPRESS – Science and Technology Publications, Lda. All rights reserved

conditions to the XYZ Workshop, then formulated
the priority issues in the field of financial
management facing the XYZ Workshop is “How to
create long term financial planning in XYZ
Workshop using financial performance analysis and
prospective analysis?”
Seeing the formulation of the problem in the field
of financial management, the purpose of research in
the process of business coaching implementation of
this XYZ Workshop, is “Create long term financial
planning in XYZ Workshop using financial
performance analysis and prospective analysis”
2 BUSINESS COACHING
METHODS AND DATA
ANALYSIS
2.1 SME’s Profile
XYZ Workshop was founded in 1993 by a married
couple Mr. A and Mrs. B. The couple opened the
business because of the need for workshops and there
was an increase in the number of vehicles, especially
cars in the Jalan Margonda Raya area, Depok. The
workshop was built using personal funds and
developed into a family business.
XYZ Workshop offers washing service and car
service. Car service offers a variety of regular
maintenance services, repairs, performance
improvements, and sales of car parts and accessories.
In addition to washing and car repair services, XYZ
Workshop also sells Bridgestone brand tires along
with installation, spooring and balancing services.
XYZ Workshop Building stands 1,000 square
meters on the edge of Jalan Margonda Raya, Depok.
The workshop already has a variety of facilities and
equipment that are adequate to support 2S activities,
namely Service & Spare Parts. In addition to
equipment for service and spare parts, XYZ
Workshop also has a robotic car wash machine for car
washing which is one of the excellent services offered
by the workshop.
XYZ Workshop Owners have several business
development targets for the future in the short,
medium and long term. In the short term, the expected
target is to create loyalty programs and improve
marketing communication through social media. The
medium term target is to open a new branch of XYZ
workshop in the form of own ownership or a franchise
system. Whereas in the long term, the expected target
is to maintain growth and expand the business range
of the XYZ Workshop.
The vision of the XYZ Workshop is to make the
XYZ Workshop the best general workshop by using
the work standards of the official workshops of Astra
Toyota and Daihatsu, which offer solutions, safety
and comfortability in one place. While the mission of
the XYZ Workshop is:
▪ Providing the best vehicle maintenance and repair
services by promoting consumer safety and
comfort.
▪ Using the best quality products that are tailored
to the needs and desires of consumers.
▪ Holds the principle of honesty and quality to
maintain service quality in accordance with
applicable SOPs.
▪ Building good relations with customers both
individuals and corporations and other parties
who are stakeholders.
▪ Build an organizational structure with work
culture characteristics that are disciplined and
open to employees so as to create family
cooperative relationships so that companies and
employees can prosper together.
2.2 Business Model Canvas
Business model canvas of XYZ Workshop can be
seen in Table 1.
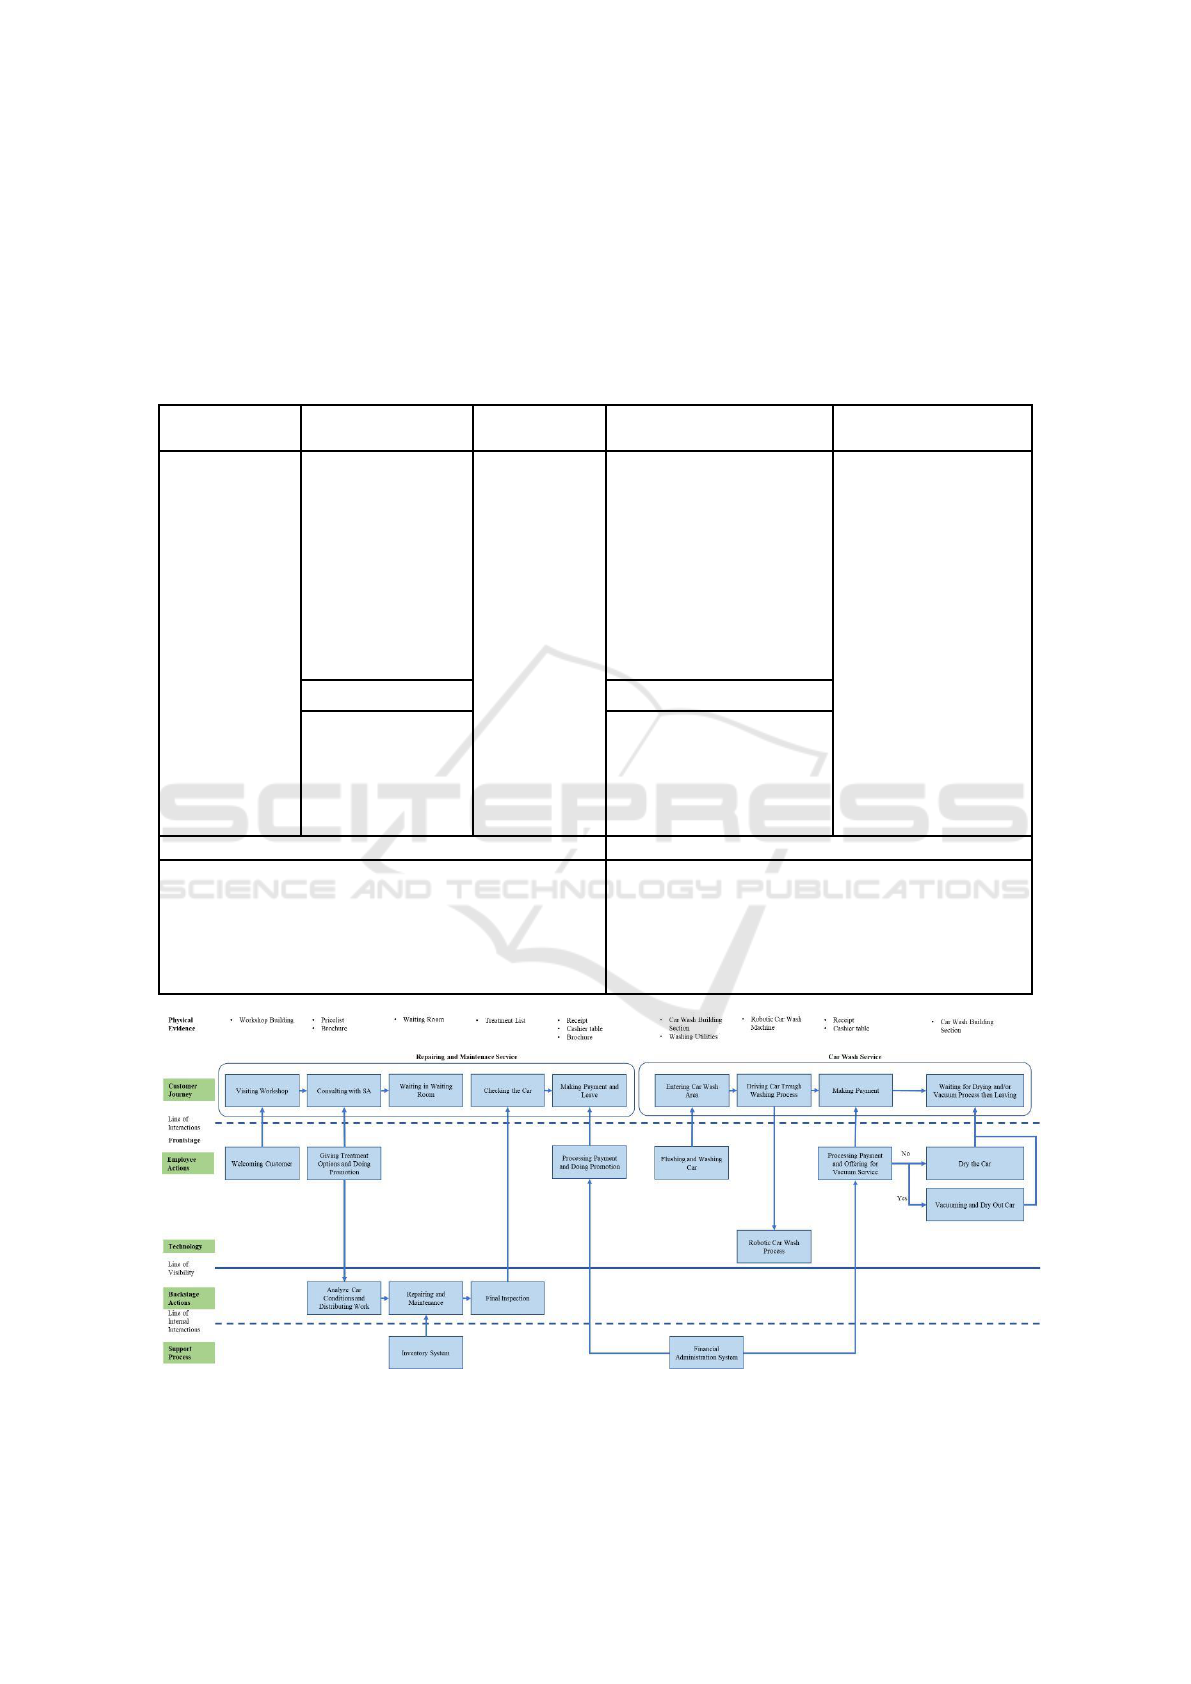
2.3 XYZ Workshop’s Business Process
Business process in XYZ Workshop is summarized
in the form of service blueprint. Service blueprint
XYZ Workshop can be seen in Figure 1.
The XYZ Workshop is good enough in carrying
out its business processes, however, the authors find
several conditions in the field that can be improved
again. For example, financial administration systems
that have not been computerized and integrated. The
cashier at the XYZ Workshop still uses handwritten
payment receipts so that the process of recording
sales reports carried out by administrative staff is
done manually one by one into the computer.
Another condition is the stall capacity for vehicle
repair and maintenance is still not used optimally
because of the fluctuating number of customers. On
the other hand, the number of transactions for repairs
and maintenance still does not meet the target.
2.4 GAP Analysis
Based on the mapping of the SME's conditions
carried out on the XYZ Workshop through the results
of interviews, observations and also the identification
of the analysis of internal, external conditions and
Long Term Financial Planning using Financial Performance Analysis and Prospective Analysis in XYZ Workshop
439
SWOT analysis, it can be seen that the gap
between the ideal conditions and the actual
conditions that occur. Gap analysis can be seen in
Table 2.
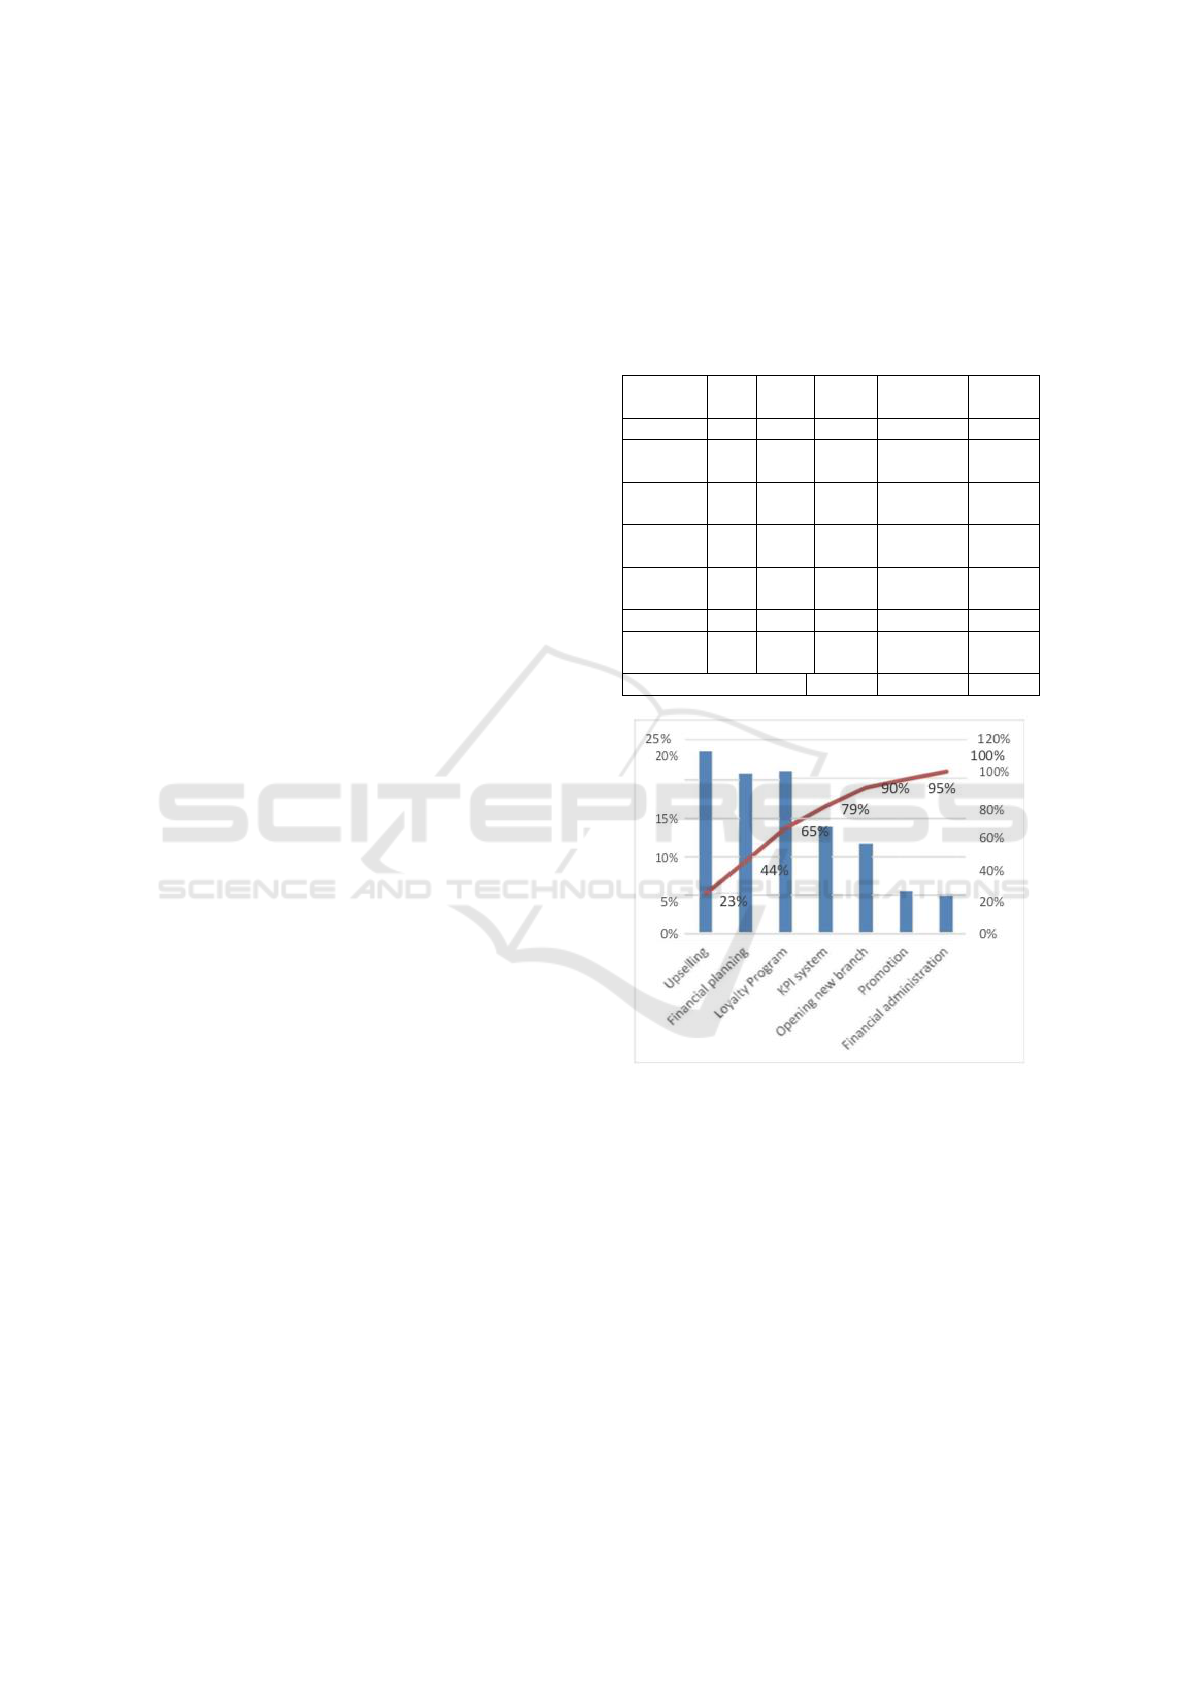
Based on the gap analysis that has been done to the
XYZ Workshop, it can be seen that there are several
problems which then cause gaps. Therefore, Pareto
analysis will be carried out, namely a priority scale
based on the level of urgency for SMEs. Levels of
problems from the highest to the lowest will be seen
based on calculations that use values and weights on
each problem that exists. Pareto states that 80% of
disorders originate from 20% of problems
experienced.
Table 1: XYZ Workshop’s Business Model Canvas.
KEY
KEY ACTIVITIES
VALUE
CUTOMERS
CUSTOMER
PARTNERS
PROPOSITION
RELATIONSHIPS
SEGMENT
-
Car repair and
Via:
Behavioral:
e-mail, telephone, SMS,
maintenance
SA, Bridgestone official
-
Car owner with
- Bridgestone
-
Car wash
-
One stop
website, advert website
expired free service
tire’s distributor
-
Purchasing tire,
service
In a way:
period from dealer
- Lubricant’s
spare part, and
-
Nice and
-
Service time reminder
- Need to repair and
distributor
lubricants
clean
-
Ask customer
maintain car machine
- Hyundai and
-
Selling tire, spare
building
satisfaction
-
Routine chek
proton spare
part, and
-
Competitive
-
Consultation
Psycographic:
parts factory
lubricants
price
-
Offering a discount and
Not having automotive
- Spare part
-
Promotion
-
Guaranteed
souvenir
skills
agents (Toyota,
quality
Demographic:
KEY RESOURCES
CHANNEL
Honda)
-
Friendly
-
Adults age 25-50
- Yayasan
Physical:
service
-
Middle income’s man
Dharma Bakti
Land, building, and
-
Pre and after
Direct selling in workshop
and women
Astra (YDBA)
equipment
Service
Geographic:
Non Physical:
location
Depok city area radius 5-
Owners equity,
10 km from workshop
human resources
Cost
• Revenue
Variable cost: employee’s incentive, purchasing, promotion
Fixed cost: employee’s salaries, building depreciation,
electricity, tax
• General repair and car maintenance service
• Robotic car wash service
• Car tire sales
• Spare part sales
• Lubricant sales
• Businss to business partnership
Figure 1: Service Blueprint XYZ Workshop.
ICIB 2019 - The 2nd International Conference on Inclusive Business in the Changing World
440

Table 2: Gap Analysis on XYZ Workshop.
Indicator
Actual Conditions
Ideal Conditions
Gap
Follow up plan
The recording of sales
Recording of
Sales receipts still use
Make a
transactions has not
computerized and
handwriting at the cashier
computerized
Business
been computerized and
integrated sales
and inputted to Ms. Excel
system for
Process, SWOT,
integrated
transactions
by admin staff
recording sales
and IFE Matrix
transactions
Stall capacity has not
Stall capacity is
The number of customers
Improve marketing
been used optimally
used optimally
is volatile
communication
Don't have a long-term
Have a long-term
Difficulty in determining
Make a long-term
VRIO, SWOT,
financial plan
financial plan
the company's strategy
financial plan
and IFE Matrix
because it does not have a
long-term financial plan
Social media has not
Social media is
Website and social media
Manage website and
PESTEL
been utilized optimally
utilized optimally
(Facebook) are not
social media
managed properly
Online taxi drivers are
Online taxi drivers
Special offers for online
Cooperate with
PESTEL,
not yet targeted
become regular
taxi drivers have not been
online taxi
SWOT, and
customers
well communicated and
cooperatives
EFE Matrix
have not cooperated with
online taxi cooperatives
Complete products and
Complete products
A slightly higher price
Service
services, with a slightly
and services, at
must be adjusted to the
development to
Marketing Mix
higher price compared
attractive prices
value given to consumers
ensure compatibility
to other general
(equal to or
between the price
workshops
cheaper) compared
and value that is to
to other general
be conveyed to
workshops
consumers
Marketing Mix,
The strategic location is
The location is
When there is a traffic
Open a new branch
easily accessible to
easily accessible to
jam in front of the
in a different
SWOT, dan
consumers when not
consumers at any
workshop, the customers
location
EFE Matrix
have traffic jam
time
reduce in number
Promotion: Still limited
Promotion: Routine
Promotional activities
Add the upselling
Marketing Mix
and less attractive
and attract
have not been managed
process to increase
consumers
properly and optimally
the number of gen.
and SWOT
repair and
maintenance sales
SWOT Analysis
Low customer loyalty
High customer
The frequency of
Creating loyalty
loyalty
fluctuating consumer
programs to
arrivals
increase customer
loyalty
SWOT Analysis
Do not have a complete
Has a complete
Consumer data collection
Creating a
consumer data
consumer data
has not been done
consumer data
collection system
collection system
optimally
collection system
SWOT Analysis
There is no individual
There are individual
Evaluation has not yet
Create an individual
and IFE Matrix
performance rating
performance rating
reached individual
KPI-based
system
systems
employees
employee
performance
appraisal system
Business Model
Key Partner:
There are other
Decreased sales of tire
Collaborating with
Canvas
Bridgestone as a
brands of tire
products
several tire
supplier becomes the
suppliers to meet
suppliers to increase
sole partner of tire
consumer needs
the variety of brands
products
and types of tires
Long Term Financial Planning using Financial Performance Analysis and Prospective Analysis in XYZ Workshop
441
That way, this concept makes it easier for companies
to see what problems are most important to solve.
Value : 1 (most difficult to do) - 10 (easiest to do)
Weight: 1 (least significant) - 10 (Most significant)
(1)
Contributions: Value x Weight
%Distribution =
× 100%
The result of calculating the contribution of the
XYZ Workshop can be seen in Table 3.
Based on the Pareto diagram, there are four
problems that require the attention of the XYZ
workshop, namely loyalty programs, upselling, long-
term financial plans, and individual KPI systems.
Problems with loyalty programs, upselling, and
individual KPI systems will be followed up by other
coaches.
The need to make a financial plan contributes 14%
of the total problem and is one of the problems which
includes 80% of the impact. The results of the Pareto
are the basis for the writer to raise the issue that XYZ
Workshop did not have financial planning and
financial performance analysis. The financial
planning used to overcome the gaps in financial
management aspects will be discussed further in the
next chapter.
3 DISCUSSION OF THE
IMPLEMENTATION OF
BUSINESS COACHING
3.1 Business Coaching Implementation
The author focuses on the discussion of financial
management aspects when implementing business
coaching process. Based on the gap analysis on the
XYZ Workshop, the author raised the issue that was
the focus of this business coaching, namely XYZ
Workshop did not have long-term financial planning.
Based on the results of the assessment of the
independence of YDBA SME Partners, it is known
that there is no long-term financial planning in the
XYZ Workshop.
XYZ Workshop had a plan to expand its business by
opening a new branch. The plan is also based on
difficulty in accessing workshop because of traffic
congestion and a decrease in the number of customers.
With the plan, the management of the XYZ Workshop
needs to assess the feasibility of investing by opening a
new branch that will be carried out by another coach
team. In addition to the investment feasibility,
management also requires long-term planning in the
XYZ Workshop so that it can be used as a tool to
analyze whether or not to open a new branch. The stages
in carrying out long-term financial planning will be
outlined in the next section
Table 3: Gap Codification and Urgency Value at XYZ
Workshop.
Codification
Value
Weight
Contribu
tion
Distribution
Accumula
tion
Upselling
8
9
72
23%
23%
Financial
Planning
9
7
63
21%
44%
Loyalty
Program
8
8
64
21%
65%
KPI
System
7
6
42
14%
79%
Open new
branch
5
7
35
11%
90%
Promotion
4
4
16
5%
95%
Financial
Admin
3
5
15
5%
100%
Total
307
100%
Figure 2: Pareto Diagram.
3.1.1 Financial Performance Analysis
Analysis of financial performance is carried out by
calculating financial ratios. These financial ratios
are divided into various analyzes, namely,
profitability, liquidity, solvency, and turnover. The
data needed in making these analyzes is the income
statement and balance sheet of the XYZ Workshop.
The obstacle faced in making an analysis of
financial performance is the collection of financial
statement data. The difficulty of collecting data
happened because the XYZ Workshop was very
private in conducting their business. The result is
that the financial statements used for analysis only
have a period of two years.
ICIB 2019 - The 2nd International Conference on Inclusive Business in the Changing World
442
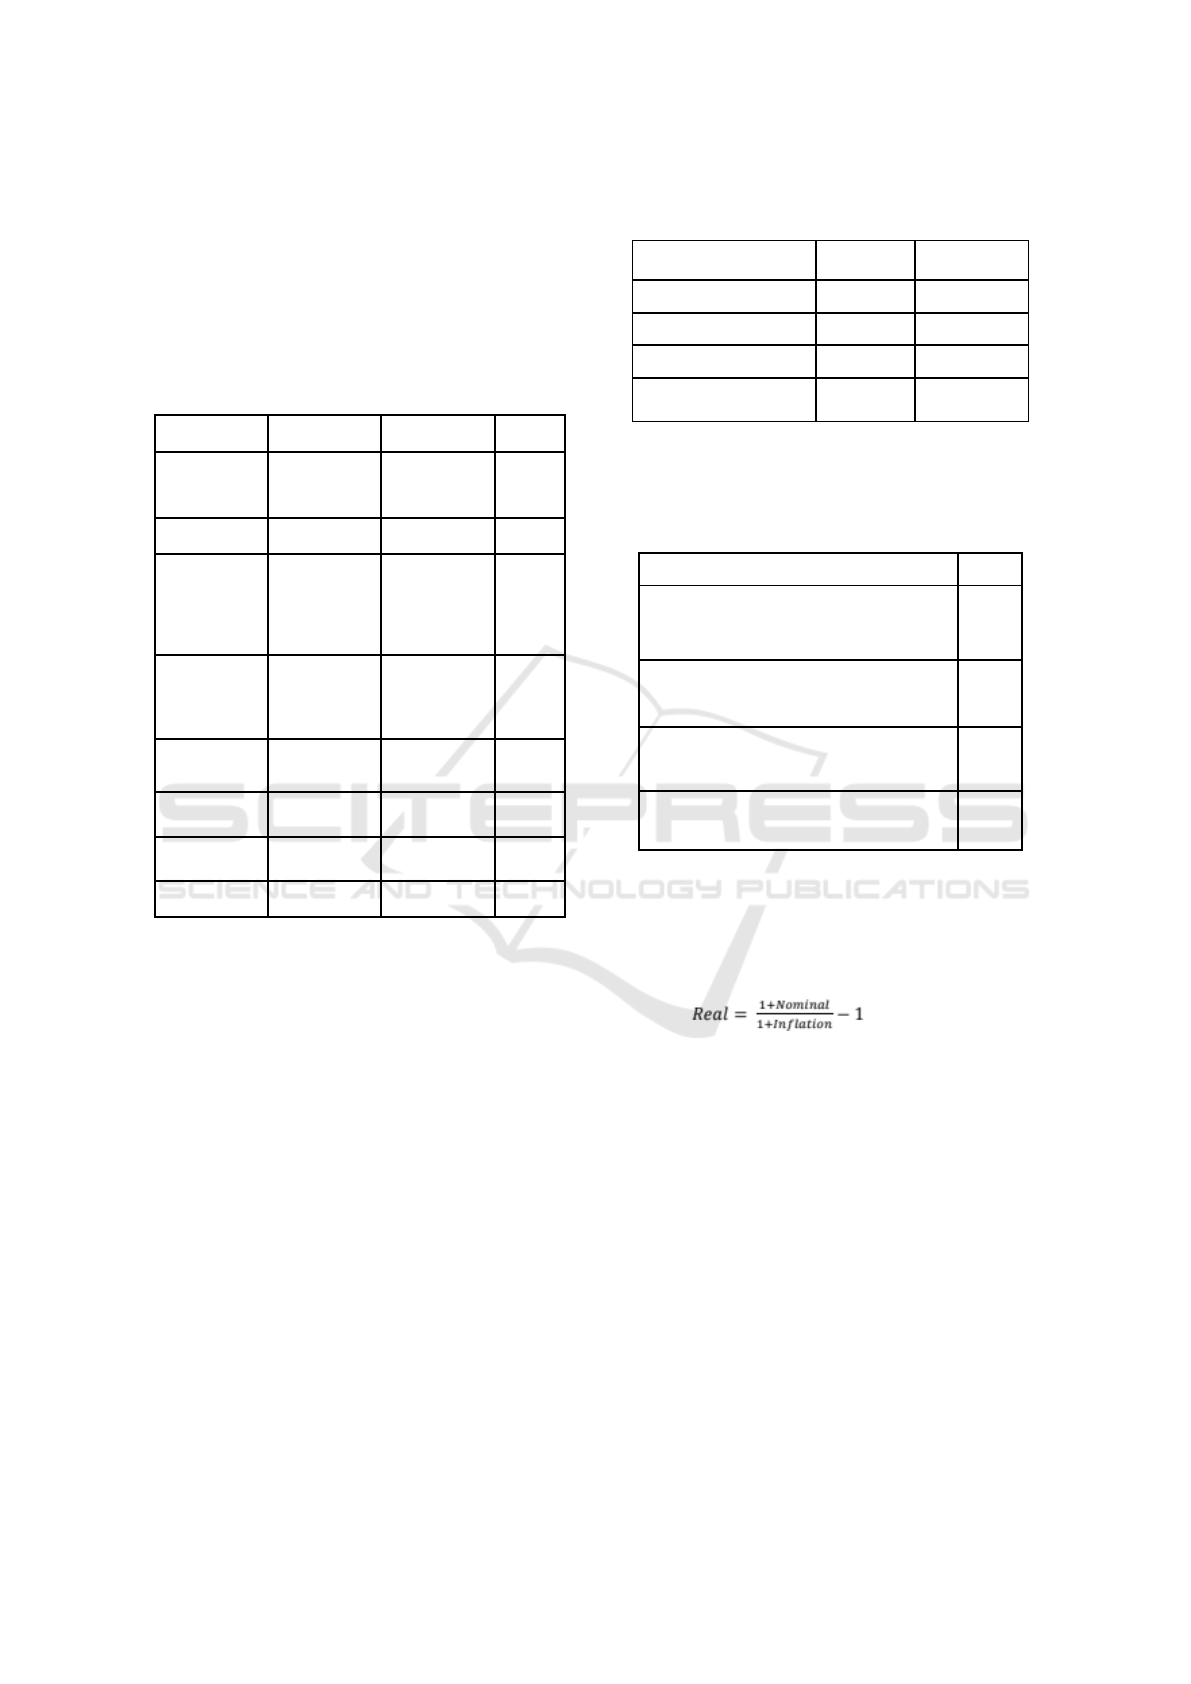
3.1.2 Prospective Analysis
The process of making financial projections starts
with taking information that can be obtained from
financial statements such as the proportion of cash
compared to sales. This information can be seen in
the table below.
Table 4: Input Data for Forecasting.
2015
2016
Average
Rp ‘000
Rp ‘000
Cash
Rp
77.295
Rp
89.295
% Cash from
3,29%
3,25%
3,27%
sales
Sales
Rp 2.346.198
Rp 2.747.487
Inventory
Rp 2.046.149
Rp 2.191.254
COGS
Rp 1.283.527
Rp 1.543.879
Inventory/COG
S
159,42
%
141,93%
150,67%
Account
Receivable
(AR)
Rp
10.302
Rp
12.157
AR/Sales
0,44%
0,44%
0,44%
Purchasing
Rp 1.319.894
Rp 1.688.984
Debt
Rp
438.754
Rp
310.410
Debt/Purchasin
g
33,24%
18,38%
25,81%
Retained
earning
Rp 1.677.494
Rp 1.843.883
Net income
Rp
207.925
Rp
246.526
The average data percentage of the amount of
cash from sales and receivables is used as a
reference in conducting financial projections.
However, the reference data used to project
inventory amounts and account receivable uses the
latest year data. This is due to an increase in
performance from the previous year. XYZ
Workshop inventory decreased from 159.42% to
141.93%. Plus, the XYZ Workshop trade debt also
decreased from 33.24% to 18.38%. Therefore, it is
expected that the XYZ Workshop can maintain that
performance.
The next step is to look for information other
than those contained in financial statements, namely
data on current year's inflation rate, a number of
customers, sales price, and purchase price. In the
case of XYZ Workshop, due to the variety of
products sold in the form of spare parts, tires, and
oil, the selling price and purchase price are the
results of the average calculation. This information
can be seen in the table 5.
Table 5: Additional Data not Found in The Financial
Statements.
2015
2016
Rp ‘000
Rp ‘000
Inflation
6,38%
3,53%
Number of customers
328
367
Selling Price (Average)
Rp 7.153
Rp 7.479
Purchasing Price
Rp 3.913
Rp 4.202
(Average)
Table 6: Estimation of Historical Nominal and Real Price
Increases
2016
Nominal increase in administrative and selling
17,53%
expenses
Real increase in administrative and selling
13,52%
expenses
Nominal increase in Selling price
4,56%
Real increase in Selling price
0,99%
Nominal increase in Purchasing price
7,40%
Real increase in Purchasing price
3,73%
Nominal increase in Sales revenues
17,10%
"Real" increase in sales revenues
13,11%
Next is calculating the increase in costs, sales,
and purchases in real terms based on the inflation
rate in the current year. These calculations use the
Fisher equation (Velez-Pareja & Tham, 2009) as
follows.
(2)
The calculation results can be seen in the table 6.
The next step is to prepare a table of prediction
data to serve as input data in making financial
projections. The data table 7 is compiled using data
from calculations that have been done before.
The inflation rate prediction is obtained from the
official website of Bank Indonesia. In addition, the
prediction of an increase in sales volume was
obtained from the management target of the XYZ
Workshop which was adjusted to the capacity of
the workshop. Based on the YDBA UKM Partner
Independence Form Assessment (2015), the capacity
of the newly used workshop is 70% of the overall
capacity of the workshop. Therefore, it is expected
that within 5 years the capacity can be used
optimally.
Long Term Financial Planning using Financial Performance Analysis and Prospective Analysis in XYZ Workshop
443

The next step is to calculate the nominal
predictions of sales, purchases, and salary costs based
on the previous table. Calculation of nominal
numbers is done using the Fisher equation (Velez-
Pareja & Tham, 2009) as follows. The calculation
results can be seen in Table 8.
Table 7: Input data.
2017
2018
2019
2020
2021
Inflation rate (BI Prediction)
4,00%
3,50%
3,50%
3,00%
3,00%
Real increase in selling price
0,99%
0,99%
0,99%
0,99%
0,99%
Real increase in purchase price
3,73%
3,73%
3,73%
3,73%
3,73%
Real increase in payroll expenses
18,31%
18,31%
18,31%
18,31%
18,31%
Real increase n selling and
administration expenses
13,52%
13,52%
13,52%
13,52%
13,52%
Increase in sales volume (units) (internal
estimates)
6,00%
6,00%
6,00%
6,00%
6,00%
Inventory as % of COGS
141,93%
141,93%
141,93%
141,93%
141,93%
Accounts receivable as % of sales
0,44%
0,44%
0,44%
0,44%
0,44%
Accounts payable as % of purchases
18,38%
18,38%
18,38%
18,38%
18,38%
Minimum cash required as % of sales
revenues
3,27%
3,27%
3,27%
3,27%
3,27%
Table 8: Nominal Increase in Prices and Growth in Units.
2017
2018
2019
2020
2021
Selling
5,03%
4,53%
4,53%
4,02%
4,02%
Purchase
7,88%
7,37%
7,37%
6,85%
6,85%
Payroll expenses
23,04%
22,45%
22,45%
21,86%
21,86%
Increase factor in volume
6,00%
6,00%
6,00%
6,00%
6,00%
Table 9: Sales Prediction Calculation.
2016
2017
2018
2019
2020
2021
Rp ‘000
Rp ‘000
Rp ‘000
Rp ‘000
Rp ‘000
Rp ‘000
Number of
Customers, Q
367
389,40
412,77
437,53
463,78
491,61
Selling price, P
Rp
7.479
Rp
7.928
Rp
8.403
Rp
8.908
Rp
9.442
Rp
10.008
Total sales, PxQ
Rp 2.747.487
Rp 3.087.080
Rp 3.468.640
Rp 3.897.363
Rp 4.379.078
Rp 4.920.331
Forecast for unit
cost
Rp
4.202
Rp
4.534
Rp
4.868
Rp
5.226
Rp
5.584
Rp
5.967
ICIB 2019 - The 2nd International Conference on Inclusive Business in the Changing World
444

Table 10: Purchasing Prediction Calculation.
2016
2017
2018
2019
2020
2021
Rp ‘000
Rp ‘000
Rp ‘000
Rp ‘000
Rp ‘000
Rp ‘000
Units sold
367,36
389,40
412,77
437,53
463,78
491,61
Final inventory in units
521,40
552,68
585,85
621,00
658,26
697,75
Initial inventory in units
522,88
521,40
552,68
585,85
621,00
658,26
Purchases in units
420,69
445,93
472,68
501,04
531,11
Forecasted Unitary cost
R
p
4.203
R
p
4.534
R
p
4.868
R
p
5.226
R
p
5.584
R
p
5.967
Table 11: Cost of Goods Sold (COGS) and Overhead and Administrative and Selling Expenses Calculation.
2017
2018
2019
2020
2021
Rp ‘000
Rp ‘000
Rp ‘000
Rp ‘000
Rp ‘000
Initial inventory in dollars
Rp 2.191.254
Rp 2.505.855
Rp 2.851.846
Rp 3.245.609
Rp 3.675.897
Purchases in dollars
Rp 1.907.377
Rp 2.170.734
Rp 2.470.454
Rp 2.797.975
Rp 3.168.917
Final inventory in dollars
Rp 2.505.855
Rp 2.851.846
Rp 3.245.609
Rp 3.675.897
Rp 4.163.229
COGS
Rp 1.592.776
Rp 1.824.743
Rp 2.076.691
Rp 2.367.688
Rp 2.681.585
Increase in administrative and selling
expenses
18,07%
17,50%
17,50%
16,93%
16,93%
Administrative and selling expenses
Rp 1.037.891
Rp 1.219.498
Rp 1.432.881
Rp 1.675.469
Rp 1.959.126
Table 12: Purchase and Payment Prediction Calculation.
2017
2018
2019
2020
2021
Rp ‘000
Rp ‘000
Rp ‘000
Rp ‘000
Rp ‘000
Total sales revenues
Rp 3.087.077
Rp 3.468.640
Rp 3.897.363
Rp 4.379.078
Rp 4.920.332
Credit sales
Rp
13.607
Rp
15.289
Rp
17.179
Rp
19.302
Rp
21.688
Inflow of sales revenues for current year
Rp 3.073.470
Rp 3.453.350
Rp 3.880.184
Rp 4.359.775
Rp 4.898.644
Total purchases
Rp 1.907.377
Rp 2.170.734
Rp 2.470.454
Rp 2.797.975
Rp 3.168.917
Purchases on credit
Rp
350.548
Rp
398.949
Rp
454.033
Rp
514.226
Rp
582.400
Purchases paid the same year
Rp 1.556.829
Rp 1.771.785
Rp 2.016.421
Rp 2.283.749
Rp 2.586.517
Inflow of sales revenues for current year
Rp 3.073.470
Rp 3.453.350
Rp 3.880.184
Rp 4.359.775
Rp 4.898.644
Inflows from Accounts Receivables
Rp
12.157
Rp
13.607
Rp
15.289
Rp
17.179
Rp
19.302
Total inflows
Rp 3.085.627
Rp 3.466.958
Rp 3.895.474
Rp 4.376.954
Rp 4.917.946
Purchases paid the current year
Rp 1.556.829
Rp 1.771.785
Rp 2.016.421
Rp 2.283.749
Rp 2.586.517
Payment of Accounts Payable
Rp
310.410
Rp
350.548
Rp
398.949
Rp
454.033
Rp
514.226
Total payments for purchases
Rp 1.867.239
Rp 2.122.333
Rp 2.415.370
Rp 2.737.782
Rp 3.100.744
Nominal = ((1 + Real) × (1 + Inflation)) – 1 (3)
The making of financial projections is then carried
out by performing calculations based on input data
from the previous tables. Calculations can be seen in
Table 9, 10, 11, and 12.
Long Term Financial Planning using Financial Performance Analysis and Prospective Analysis in XYZ Workshop
445
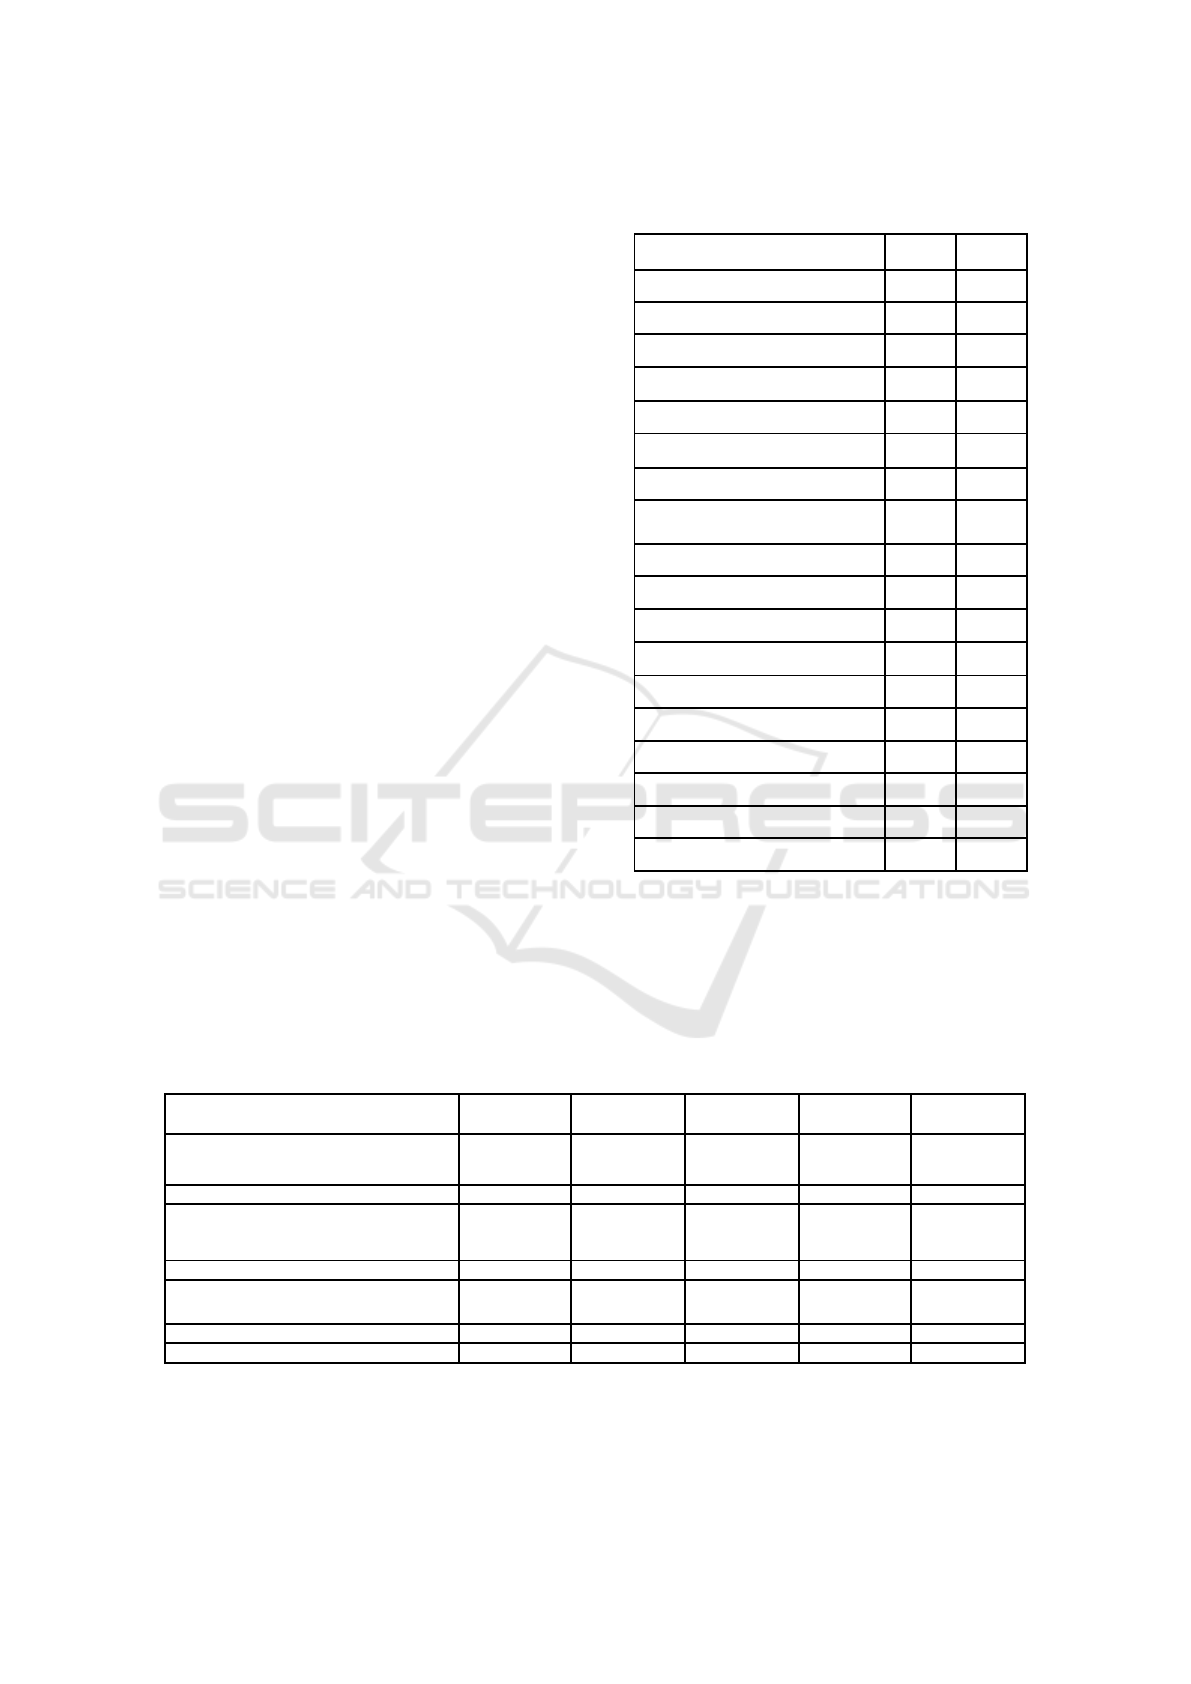
3.2 Discussion of Business Coaching
Results
3.2.1 Financial Performance Analysis
Results
Based on the information obtained from the results of
interviews with informants and observations on the
XYZ Workshop, it is known that XYZ Workshop has
not performed financial performance analysis
regularly. Through the implementation of business
coaching, an analysis of the financial performance of
the XYZ Workshop was conducted from 2015 to
2016. There are several calculations carried out,
namely, profitability, liquidity, solvency, and
turnover. The results of these analyzes can be seen in
Table 13.
Based on the table above, the overall profitability
of the XYZ Workshop in 2016 has increased from the
previous year. The increase in profitability was
caused by an increase in sales from 2015 Rp
2,346,198.00.00 to Rp. 2,747,487,464 in 2016. On the
other hand, an increase in ROA could be caused by a
reduction in fixed assets of XYZ Workshop in 2016
6% from 2015. On the other hand, the increase in
ROE of the XYZ Workshop indicates that workshop
management is better able to utilize the equity
invested by the capital voters of the XYZ Workshop.
The table above also shows the results of calculating
the XYZ Workshop liquidity ratio.
Table 13: Analysis of Financial Performance of XYZ
Workshop.
Profitability Ratio
2015
2016
Profit Margin
0,089
0,090
ROA
0,062
0,072
ROE
0,072
0,080
Liquidity Ratio
Current Ratio
4,515
6,577
Quick Ratio
0,185
0,291
Cash Ratio
0,164
0,256
Working Capital to Total Assets
Ratio
0,495
0,565
Solvability Ratio
Total Debt Ratio
0,141
0,101
Debt to Equity Ratio
0,164
0,113
Turn Over Ratio
Total Asset TO
0,699
0,799
Fixed Asset TO
1,916
2,397
Receivable TO
227,742
226,000
Inventory TO
0,627
0,705
Average Day Inventory
582
518
Working Capital Turnover
1,412
1,413
Overall, the XYZ Workshop liquidity ratio in 2016
has increased from the previous year. This increase
was caused by short-term debt compared to the
previous year. In addition, this also shows the better
management of the company's margin of safety every
year.
Table 14: Cash Projection of XYZ Workshop.
2017
2018
2019
2020
2021
Rp ‘000
Rp ‘000
Rp ‘000
Rp ‘000
Rp ‘000
Cash inflows
Total AR plus sales on cash
Rp 3.085.627
Rp 3.466.958
Rp 3.895.474
Rp 4.376.954
Rp 4.917.946
Total inflows
Rp 3.085.627
Rp 3.466.958
Rp 3.895.474
Rp 4.376.954
Rp 4.917.946
Cash outflows
Total payments for purchases
Rp 1.867.239
Rp 2.122.333
Rp 2.415.370
Rp 2.737.782
Rp 3.100.744
Administrative and selling expenses
Rp 1.037.891
Rp 1.219.498
Rp 1.432.881
Rp 1.675.469
Rp 1.959.126
Total cash outflows
Rp 2.905.130
Rp 3.341.830
Rp 3.848.251
Rp 4.413.250
Rp 5.059.870
Net cash balance (NCB) before fixed assets
Rp
180.496
Rp
125.127
Rp
47.222
-Rp
36.296
-Rp
141.924
purchase
NCB
Rp
180.496
Rp
125.127
Rp
47.222
-Rp
36.296
-Rp
141.924
Cumulated NCB
Rp
269.791
Rp
394.919
Rp
442.141
Rp
405.845
Rp
263.921
ICIB 2019 - The 2nd International Conference on Inclusive Business in the Changing World
446

Table 15: Income Statement Projection of XYZ Workshop.
2017
2018
2019
2020
2021
Rp ‘000
Rp ‘000
Rp ‘000
Rp ‘000
Rp ‘000
Sales
Rp 3.087.077
Rp 3.468.637
Rp 3.897.363
Rp 4.379.078
Rp 4.920.332
COGS
-Rp 1.592.776
-Rp 1.824.743
-Rp 2.076.691
-Rp 2.367.688
-Rp 2.681.585
Gross Profit
Rp 1.494.301
Rp 1.643.897
Rp 1.820.672
Rp 2.011.390
Rp 2.238.747
Administration and General
-Rp 1.037.891
-Rp 1.219.498
-Rp 1.432.881
-Rp 1.675.469
-Rp 1.959.126
Expenses
Operating Profit
Rp
456.410
Rp
424.399
Rp
387.791
Rp
335.921
Rp
279.621
Depretiation
-Rp
78.515
-Rp
78.515
-Rp
78.515
-Rp
78.515
-Rp
78.515
EBIT
Rp
377.895
Rp
345.884
Rp
309.276
Rp
257.406
Rp
201.106
Interest Expenses
Profit Before Tax
Rp
377.895
Rp
345.884
Rp
309.276
Rp
257.406
Rp
201.106
Tax
Net Income for the Year
Rp
377.895
Rp
345.884
Rp
309.276
Rp
257.406
Rp
201.106
Table 16: Balance Sheet Projection of XYZ Workshop.
2017
2018
2019
2020
2021
Rp ‘000
Rp ‘000
Rp ‘000
Rp ‘000
Rp ‘000
Current Assets
Cash
Rp
269.791
Rp
394.919
Rp
442.141
Rp
405.845
Rp
263.921
Account Receivable
Rp
13.607
Rp
15.289
Rp
17.179
Rp
19.302
Rp
21.688
Inventory
Rp 2.505.855
Rp 2.851.846
Rp 3.245.609
Rp 3.675.897
Rp 4.163.229
Total Current Assets
Rp 2.789.254
Rp 3.262.054
Rp 3.704.930
Rp 4.101.044
Rp 4.448.839
Fixed Assets
Office Supply
Rp
1.193
Rp
1.193
Rp
1.193
Rp
1.193
Rp
1.193
Workshop Equipment’s
Rp
136.450
Rp
136.450
Rp
136.450
Rp
136.450
Rp
136.450
Building
Rp
608.662
Rp
608.662
Rp
608.662
Rp
608.662
Rp
608.662
Land
Rp
400.000
Rp
400.000
Rp
400.000
Rp
400.000
Rp
400.000
Total Fixed Assets
Rp 1.146.305
Rp 1.146.305
Rp 1.146.305
Rp 1.146.305
Rp 1.146.305
TOTAL ASSETS
Rp 3.935.559
Rp 4.408.359
Rp 4.851.235
Rp 5.247.350
Rp 5.595.144
LIABILITIES
Account Payable
Rp
350.548
Rp
398.949
Rp
454.033
Rp
514.226
Rp
582.400
TOTAL LIABILITIES
Rp
350.548
Rp
398.949
Rp
454.033
Rp
514.226
Rp
582.400
EQUITY
Paid in Capital
Rp 1.000.000
Rp 1.000.000
Rp 1.000.000
Rp 1.000.000
Rp 1.000.000
Retained Earning
Rp 1.460.811
Rp 1.917.221
Rp 2.341.621
Rp 2.729.412
Rp 3.065.333
Net Income
Rp
377.895
Rp
345.884
Rp
309.276
Rp
257.406
Rp
201.106
TOTAL EQUITY
Rp 2.838.706
Rp 3.263.105
Rp 3.650.897
Rp 3.986.818
Rp 4.266.439
TOTAL LIABILITIES AND
Rp 3.935.559
Rp 4.408.359
Rp 4.851.235
Rp 5.247.350
Rp 5.595.144
EQUITY
Long Term Financial Planning using Financial Performance Analysis and Prospective Analysis in XYZ Workshop
447

The solvability ratio calculation in the table above
shows that there is a decrease in the total debt ratio
and the debt to equity ratio from 2015 to 2016. This
is due to the short-term debt of the XYZ Workshop
which has also decreased. Based on the calculation
of the ratio also shows the ability of XYZ Workshop
in fulfilling its financial obligations increased in
2016.
Overall, the XYZ Workshop turnover ratio
evaluation shows an increasing trend every year,
meaning that the management of XYZ Workshop can
better manage company assets. The biggest ratio on
this turnover ratio is the receivables turnover ratio,
which indicates that the sales obtained by the
company come from sales in cash. However, the
results of calculating average day inventory show a
number that is not good because the number of days
of inventory is in the warehouse for more than one
year. This indicates that the XYZ Workshop has
more inventory than the number of sales.
The conclusion from the analysis of the financial
performance of the XYZ Workshop is the financial
performance of the XYZ Workshop during 2015 and
2016 as a whole is quite good. This is indicated by an
increase in various indicators, namely increased
profitability, ability to pay debts, and turnover of
XYZ Workshop assets.
3.2.2 Financial Projection Results
The making of long-term financial projections is
done to find out the prospect of financial benefits that
will be obtained in the future. In addition, the XYZ
Workshop has no previous long-term financial
projections. Through the business coaching process,
XYZ Workshop is expected to be able to make
financial projections independently and be carried
out routinely. In addition, the results of the financial
projections conducted are expected to provide an
overview of the development opportunities and
business continuity of the XYZ Workshop. The
results of the cash budget projection, income
statement, and financial balance of the XYZ
Workshop over the next five years can be seen in
Table 14, Table 15 and Table 16.
Based on cash budget projections, it can be seen
that the prediction of the amount of cash that will be
received by the XYZ Workshop will always decrease
from year to year. This is due to the predicted
purchase of inventory will always increase even
though supplies more warehouse than sold. These
predictions are obtained from historical purchase data
which also increased. Net income is also projected to
decline from year to year even though sales continue
to increase. This is caused by the increase in the cost
of goods sold and overall costs along with predictions
of an increase in the number of customers of XYZ
Workshop. However, the XYZ Workshop is
predicted to continue to benefit for the next five
years.
Overall, the financial projections of the XYZ
Workshop did not show encouraging results.
However, these results indicate that XYZ Workshop
needs to open a new branch to be able to develop its
business. This is due to the growth of the XYZ
Workshop which is predicted to decline even though
efforts have been made to increase sales. Long-term
financial projections can also be used as an
evaluation material for management to determine the
business strategy of XYZ Workshop in the future.
4. CONCLUSIONS
Based on the research objectives in the process of
implementing business coaching on XYZ
Workshop, conclusions can be obtained as follows:
1. Financial performance analysis can help the
management of XYZ Workshop in identifying
financial problems.
2. Long-term financial projections can provide an
overview of the prospects for future profits and
the costs needed to reach the target.
3. Financial performance of the XYZ Workshop in
2016 has increased from 2015.
4. XYZ Workshop financial projections show a
decline in net income even though sales have
increased.
The following action plan can be used as a
follow-up activity for implementing business
coaching on XYZ Workshop related to long-term
financial planning, namely:
1. Determine the strategy that will be carried out to
be able to achieve the sales targets determined by
the XYZ Workshop based on financial
projections.
2. Make a budget that is needed for each part or
department that refers to financial projections.
3. Conduct regular evaluations to be adapted to the
needs of the workshop.
4. Evaluate policies in making purchases and
improving inventory management.
Based on this study, the authors would also
recommend for further research involving more
historical data. In addition, comparison of financial
performance with other similar workshops is also
needed.
ICIB 2019 - The 2nd International Conference on Inclusive Business in the Changing World
448

ACKNOWLEDGEMENTS
Ir. Hasnul Suhaimi, MBA., Dony Abdul Chalid,
S.E.,M.M., Ph.D, Rambat Lupiyoadi, M.E., Hilda
Fachrizah, MM, Owner and employees of XYZ
Workshop.
REFERENCES
Bank Indonesia. (2018, July). Inflasi: Penetapan Target
Inflasi. December 5, 2018.
https://www.bi.go.id/id/moneter/inflasi/bi-dan-
inflasi/Contents/Penetapan.aspx
Passmore, J. (2010). Excellent in coaching: Panduan
lengkap menjadi coach profesional. Jakarta: Penerbit
PPM.
Velez-Pareja, I., & Tham, J. (2009). Prospective Analysis:
Guidelines for Forecasting Financial Statements. In R.
Vishwanath & C.
Krishnamurti (Eds.), INVESTMENT MANAGEMENT: A
MODERN GUIDE TO SECURITY ANALYSIS AND
STOCK SELECTION. https://doi.org/10.1007/s10551-
015-2769-z.For
World Bank. (2017). Middle Income Countries Overview.
Retrieved January 1, 2017, from http://www.
worldbank.org/en/country/mic/ove review
Long Term Financial Planning using Financial Performance Analysis and Prospective Analysis in XYZ Workshop
449
