
Decision-Making Process in Small Medium Enterprise: Application
of Business Analytics Methodology and Linking Model
Yulia Nur Hasanah
and Pri Hermawan
School of Business and Management, Institut Teknologi Bandung, Jl. Ganesha No.10, Bandung, Indonesia
Keywords: BAM, ICIB, Linking Model, Problem Situation Structuring, SME.
Abstract: The popularity of business analysis has increased rapidly in the last decade and presents a challenge for
organizations to understand how to use it achieve business goals and create a competitive advantage. The
object of this research is the NAH Project, which is a small-medium enterprise. They overwhelmed to
complete the targets and also had difficulty in making strategies for the future to maintain their revenue. They
must find out what's popular or trends, optimizing prices for competitive advantage, finding what will be sold
next, etc. through business analytics. In developing business analytics capabilities, they must know what kind
of data that helpful and meaningful for them to know the customer expectation. In this research the approach
of Business Analytics Methodology (BAM) combined with Linking Model. BAM has four stages: problem
situation, business model mapping, analytic leverage, and analytics implementation. Linking model also has
four layers' hierarchy: process map, decision, analysis, and data items. Both of approach used to explore the
problem that occurs and helps the company to make a decision using data items. The research findings are
the 34 types of data needed by the NAH Project in developing business analytical skills to enhance their
competitive advantage.
1 INTRODUCTION
Small Medium Enterprise (SME) is a small-scale
economic activity of the people with a business sector
which is a majority of small-scale business activities
and needs to be protected to prevent unfair business
competition. In 2017, SME contributed 57.08% or
around 5,425 billion to Indonesia's GDP while the big
enterprise contributed 42.92% or around 4,078 billion
to GDP (BPS, 2015). One sector that contributes to
GDP is the creative industry. Based on the Creative
Economy Agency (Bekraf) (2017), the creative
industry contributes around 922.59 trillion or 7.44%
of the total Indonesian GDP in 2016. The fashion
sector produces an added value of 166,135.3 and or
contribute 18.01 percent to the formation of Creative
Economy GDP.
Nowdays, mostly business organization using the
business analytics and data science to explore how
they can use the available data (Hindle & Vidgen,
2018; Vidgen, Shaw, and Grant, 2017; Davenport &
Harris, 2007) because they want to have accurate
information from the data in decision-making process
(Iqbal et al., 2018) to create strategy, value, and
competitive advantage in their businesses. Business
analytics is a set of methods that convert raw data into
action by generating insights for decision making
within an organization (Liberatore & Luo, 2010).
One of the industries that are defined by data
analytics is retail and 62 percent of respondents in
retail feel that the information and analytics give them
competitive advantages (Matthews, 2018). Now,
analytical data is applied in all stages of retail
processes such as find out what's popular by
predicting trends, estimating where demand for these
products, optimizing prices for competitive
advantages, identifying customers who might become
interested and looking for how to approach them
effectively and finding out what will be sold next
(Marr, 2015).
Current research seeks to answer the following
question: how do organizations achieve their business
goals and competitive advantage by developing
business analytical skills? To support this research,
we use a research framework that aims to develop and
apply predictive analytics using the business analysis
methodology (BAM) and Linking Model to identify
what kind of the data that they need.
In the creation of strategy, value, and competitive
advantage requires an understanding of the business
406
Hasanah, Y. and Hermawan, P.
Decision-Making Process in Small Medium Enterprise: Application of Business Analytics Methodology and Linking Model.
DOI: 10.5220/0008431904060412
In Proceedings of the 2nd International Conference on Inclusive Business in the Changing World (ICIB 2019), pages 406-412
ISBN: 978-989-758-408-4
Copyright
c
2020 by SCITEPRESS – Science and Technology Publications, Lda. All rights reserved

itself and where analytics will be applied. BAM is one
of the approaches that we use to understand a business
organization. The BAM approach used in this
research is the same as the research conducted by
Hindle & Vidgen (2018) which uses the business
model canvas (BMC) (Osterwalder and Peigneur,
2010) which is combined with problem situation
structuring and business modeling from Soft System
Methodology (SSM) (Checkland, 1981; Checkland &
Scholes, 1990; Wilson, 1984) namely CATWOE
Analysis.
After analyze the business situation, the next is to
identify what kind of the data that they need using
Linking Model. Linking Model developed by Pape
(2016) that separated business analysis into four
hierarchial. This method help the company to find the
data that will be useful and valueable to get
competitive advantage and achieve their goals
2 LITERATURE STUDY
2.1 Business Analytics
Analytics is used to find, explore, describe, and
communicate patterns or trends in data and produce
information that is known from data sources (Starkey
& Schniederjans, 2014). While business analytics is
an advanced stage where information that has been
obtained through analytic is used to develop or
improve business performance. Business analytics
plays an important role in a business organization in
creating strategies for competitive advantage and
making decisions. (Liberatore & Luo, 2010; Starkey
& Schniederjans, 2014).
The application of business analytics for enhance
the decision-making process such as to increasing
customer profitability, risk reduction, human
resource decision, business performance tracking,
etc. Furthermore, business analysis can be a strategy
for competitive advantage such as price leadership,
sustainability, service effectiveness, etc.
2.2 Business Analytics Methodology
Business Analytics Methodology (BAM) (Hindle &
Vidgen, 2018) is an approach that supports an
organization to get value from business analytics starting
from initial thinking to getting complete analysis results.
BAM is also a process of business understanding to
explore the business goals and conditions of a
business organization which is then analyzed to find
and determine parts of businesses that require
analytics.
Basically BAM has two interrelated work streams
namely top-down analysis and bottom-up analysis.
Top-down analysis is a process that focuses on the
business model of an organization to develop
business analytics. While the bottom-up analysis does
analytics on data.
This BAM approach combines business model
canvas (BMC) (Osterwalder and Peigneur, 2010)
problem situation structuring and business modeling
from SSM (Checkland, 1981; Checkland & Scholes,
1990) namely CATWOE Analysis. dalam melakukan
top-down analysis to structure, map, and develop
business models.
The application of BAM involves four activities
(Hindle & Vidgen, 2018) namely, problem situation
structuring, business model mapping, business
analytics leverage, and analytics implementation.
1. Problem situation structuring: in this stage the
rich picture used to see how the business model
function as a whole and the world view from
various stakeholder becomes clear.
2. Business model mapping: this stage uses a
Business Model Canvas (BMC) supported by Soft
System Method (SSM) to map business models.
The CATWOE (Clients, Actors, Weltanschauung,
Owners, and Environment) Analysis technique is
SSM tool and also used to describe the root
definition. Then, the root definition from the
CATWOE Analysis can open the opportunity for a
business model innovation.
3. Business analytics leverage: The BMC, SSM,
and CATWOE generated in previous stages used
to identify leverage point and opportunities for
business analytics that is to identify data, tools,
and analysis that are most likely to address
business objectives and make the best utilizing
scarce resources.
4. Analytics Implementation: in this stages data is
collected and build the models and deployed.
2.3 Linking Model
Besides using BAM in business analytics, to develop
business analytics capabilities start from the first step
in business analytics process that finds the type of
data that will be useful and valuable for the
organization to get a competitive advantage and
achieve their goals. In accordance with Pape (2006)
who states that to gain insight, business functions in
an organization must collect data items regularly to
analyse their activities. Linking model by Pape
Decision-Making Process in Small Medium Enterprise: Application of Business Analytics Methodology and Linking Model
407

(2016) is an approach that separated business
analysis into four hierarchical layers:
1. Process map: divides business function into
value streams
2. Decision: gather core questions where business
functions must be prepared to provide answers,
establish each decision for a process, and ensure
that the list of decisions considers all relevant
business activities.
3. Analysis: analytic and metric models, which are
relevant for certain business functions
4. Data items: the raw data (numerical and
qualitative) required for conducting the analyses.
3 METHODOLOGY
In business analytics capabilities, this study uses a
qualitative research method to get a deeper level of
understanding of everything in a business
organization by conducting interviews, observations,
and using flipcharts.
The pilot study involved the development of an
analytics strategy for the NAH Project. NAH Project
is one of the local brand sneakers from Bandung
which initially provided products in the form of
apparel & skate shoes. The founder and co-founder
of NAH Project saw the opportunity that local
sneakers needed new innovations to change the
stigma that Indonesian sneakers had quality &
designs that were able to compete. With a new goal,
presenting sneakers products made with research &
development that is relevant to the needs of the
Indonesian market with guaranteed quality. Their
vision is to become “Indonesian cultist sneakers
brand who dominates sneakers market through
innovation and breakthrough”. NAH Project has
several divisions in it, namely customer service,
billing and operational, sales and marketing, research
and development, and creative marketing.
We have conducted interviews with the founder
and co-founder to find out overall about the
company, and what problems are being faced from
their view. In addition, we also interviewed each
division also using flip charts as media for each
division to write down the current business
processes, constraints, and strategies in the future.
The process took about three and a half hours for five
divisions.
The analysis process using the business analytics
methodology (BAM) approach starts from problem
situation structuring using a rich picture which is
NAH Project and we should be figuring out all
factors that influence the business objectives of NAH
Project. Afterwards, we conduct existing condition
analysis about NAH Project using Business Model
Canvas (BMC), Softs System Method (SSM)
especially CATWOE to get information about the
root definition of the relevant purposeful activity
system. From this process we conclude several
business problems that occur in the organization.
Last, the Linking Model is conducted by
analysing the business process to get the value
stream, then analysing all about the decision in the
value stream, the decision will have the analysis
before making the decision, and then analysing what
type of the data that used to make an analysis to make
a decision.
4 FINDINGS
4.1 Problem Situation Structuring
NAH Project has several divisions, namely customer
service, billing and operational, sales and marketing,
research and development, and creative. While other
divisions such as production, shipping and quality
control are held by third parties, namely PTS.sc. The
results of the interview with the founder of NAH
Project, he feels that his company is known as a
company that only sells local shoes at low prices. In
fact, he wants his company to be known and valued
as a company that provides local products of the
highest quality and full of innovation at an affordable
price.
Based on Figure 1. the key feature of rich picture
is "more than cheap local sneakers" as desired by the
founder. The business goals of the NAH Project is to
become "Indonesia cultist sneakers that dominates
the sneakers market through innovation and
breakthrough" to transform the stigma of low quality
local sneakers into local sneakers that have quality
and design that can compete with branded sneakers.
However, in the course of the NAH Project there are
several constraints in value creation, customer
satisfaction, and customer loyalty. In the future the
people trends, need, desire, and expectation will
change, so NAH Project need innovation and
breakthroughs that meet with the customer
expectation to keep the company going, and maintain
the revenue by keep selling the product.
ICIB 2019 - The 2nd International Conference on Inclusive Business in the Changing World
408
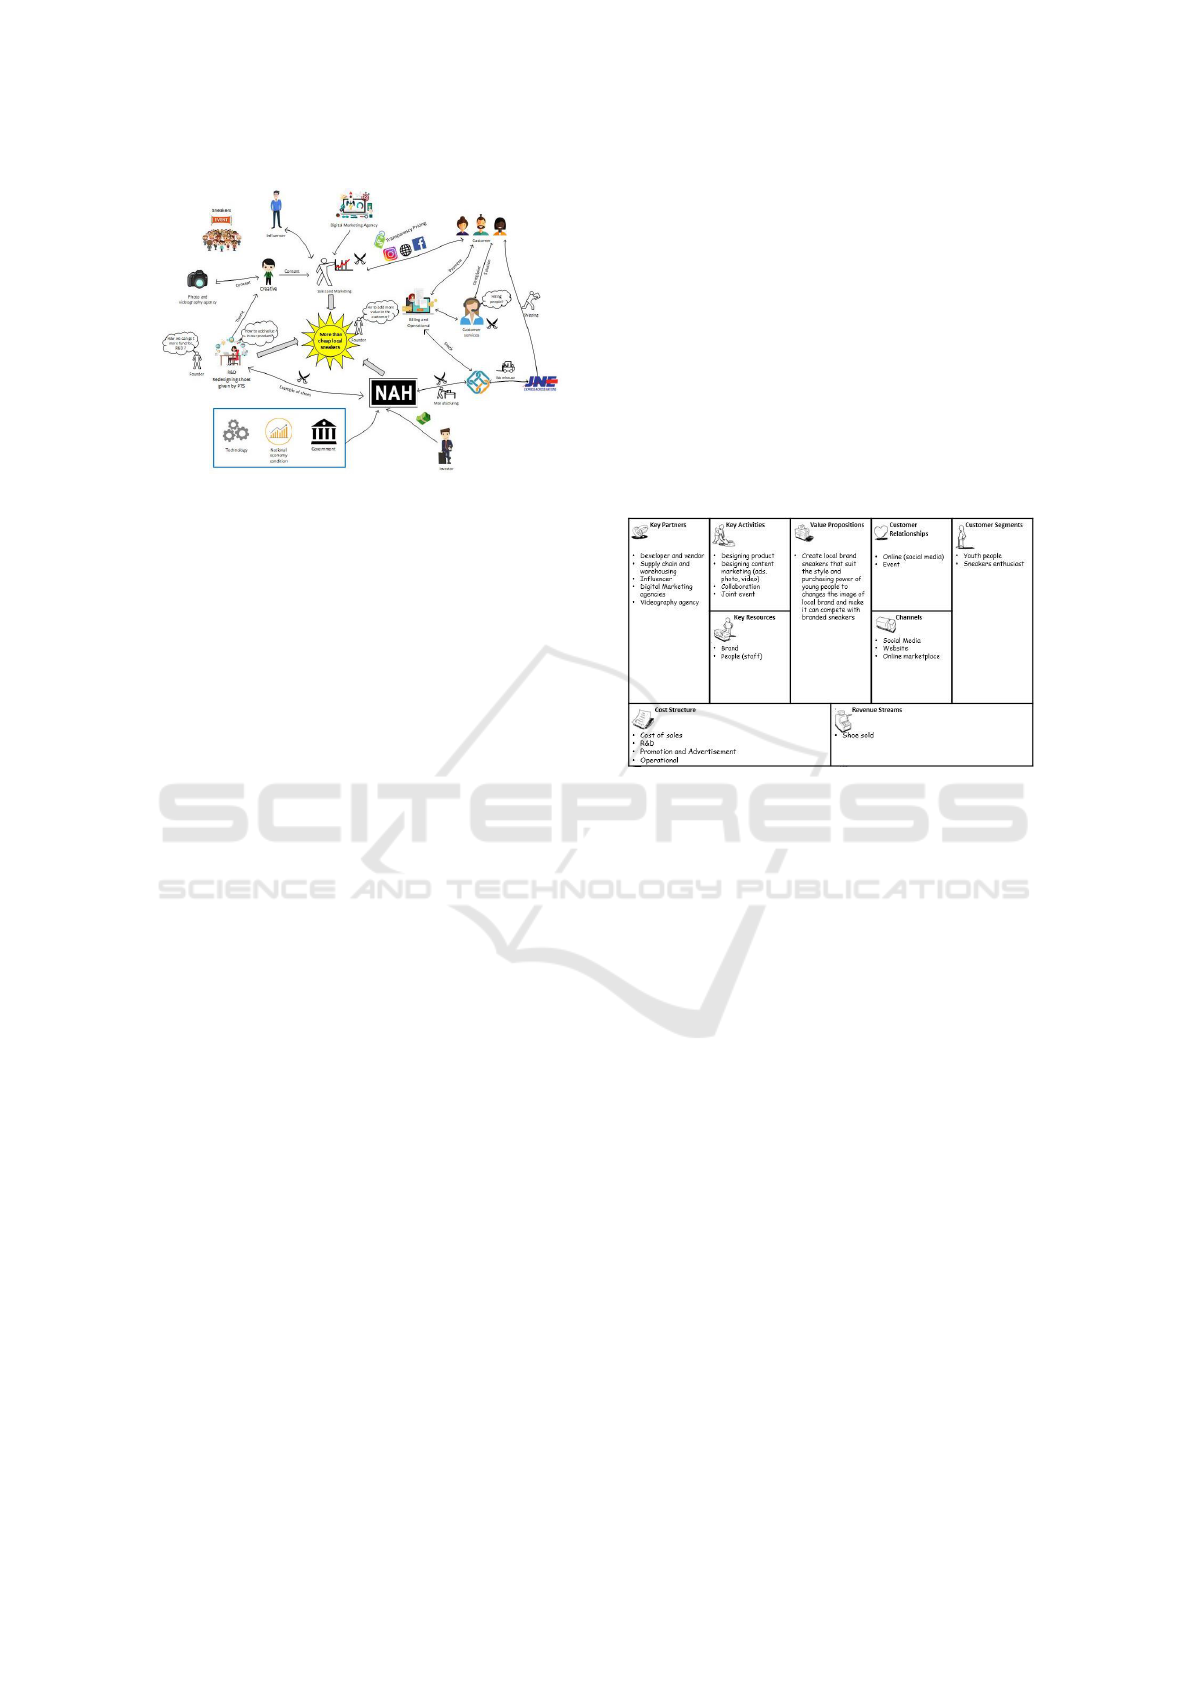
Figure 1: Rich Picture of NAH Project current strategic
situation.
In the rich picture there are four cross swords that
show constraint. NAH Project collaborates with
PTS.sc to carry out the manufacturing process where
until now NAH Project does not have a fixed vendor
and cannot fulfil the market demand. So that it
becomes a problem in customer satisfaction because
customers will difficult to get the product. Then, due
to the limited stock of available products, customers
always ask customer services about product
availability. The number of messages that enter is
enough to make this division overwhelmed because
every 10:00 am there are about fifty messages that
have not been read.
In the process of research and development, the
NAH Project currently only has one product designer
who only redesigned the sample of shoes given by
PTS.sc, because there is no clear direction about what
values will be raised in product design. In the
marketing strategy, NAH Project uses social media
as its media because they realize that social media is
currently the most effective marketing to increase
brand awareness. NAH Project collaborates with
photo and videography agency to create maximum
content marketing and also collaborates with digital
marketing agencies to maximize marketing. In
addition, social media also makes it easier for NAH
Project to communicate directly with customers. At
present, NAH Project intensively communicates with
customers through social media and receives a lot of
input and criticism from customers, and this greatly
helps the NAH Project in innovating and developing.
However, from the results of interviews with those
responsible for sales and marketing it is known that
to date they have never conducted market research
and only rely on input from customers through social
media and website.
4.2 Business Model Mapping
In identifying business models, we use the Business
Model Canvas (BMC) and CATWOE Analysis. The
business model canvas (BMC) displays the important
elements contained in a business model and shows
how a business model generates revenue. While
CATWOE Analysis is an SSM tool and also used to
describe the root definition. Then, the root definition
from the CATWOE Analysis can be an open
opportunity for a business model innovation. The
NAH Project's Business Model Canvas is shown in
Figure 2.
Figure 2: Business Model Canvas of NAH Project.
In CATWOE Analysis, we are conducting
interviews with seven people from the NAH Project
team and found that their customers were people who
liked sneakers who wanted to find another alternative
by trying local sneakers. Currently, customers know
that sneakers from NAH Project have affordable
prices and can only be obtained through online
purchases. A large number of customers coupled with
the existing technology system is not enough to make
customers difficult to get goods and product
incompatibility often occurs in terms of size. They
always give criticism and suggestions through social
media and websites. The high use of social media
made the customers very enthusiastic when the NAH
Project offered new products and they were looking
forward to the new product. In its progress, the NAH
Project has an internal team (customer service, billing
and payment, sales and marketing, creative
marketing, and research and development), investors,
and third parties that help the NAH Project in terms
of marketing. There are many requests for NAH
Project products, they have a goal to change the
image of a local sneakers brand by using innovation
and breakthrough. However, they also hope that their
sneakers products will also become sneakers
Decision-Making Process in Small Medium Enterprise: Application of Business Analytics Methodology and Linking Model
409

products that can compete with branded sneakers but
still at affordable prices. To do this they have
founders and investors who will decide to make
changes, terminate the project, or choose whether to
continue the changes. Furthermore, there are also
external factors that affect the government policy,
national and regional economy, Indonesia factory
capability, media, community, trend, and technology.
Table 1: CATWOE Analysis of the NAH Project.
CATWOE
Application to NAH
Project
Customer
(who
People
who’d
love
benefits/disbenefits?)
sneakers,
and
would
like
to
find
an
alternative
in
trying
local sneakers
Actor (who perform the
NAH
Project’s
team,
NAH?)
investor,
and
third-
party
Transformation (what is
To change the local brand
the NAH?)
sneakers
image
through bringing
an
innovation
and
technology apply
Weltanschauung
(what
Local
brand sneakers
makes
the
NAH
that can compete with
meaningful?)
branded sneakers with
affordable price
Owners
(who
can
stop
Founder and investor
the NAH?)
Environmental
Government
policy,
Constraints
(what
National and regional
aspects
affect
the
economy,
Indonesia
business unit)
factory
capability,
media,
community,
trend, and technology
According to Table 1., the root definition constructed
for the NAH Project is: “NAH Project change local
brand sneakers image in the community by
innovation and technology apply in order to be local
brand sneakers that can compete with branded
sneakers at an affordable price”.
4.3 Linking Model
Based on the business analytics process by
Schniederjans (2014), the first step in the business
analytics process is the database. Linking model is
used to find the type of data that NAH Project should
collect before analysed and used the insight for
decision-making. Linking model is the approach by
Pape (2006) that divides the business analysis into
four layers (process maps, decisions, analysis, and
data items). In this case, the author chooses a key
activity and customer relationship from the NAH
Project, because both of these are core processes that
are in the NAH Project.
From the analysis there are four value stream (VS)
namely, concept to development (VS1), content
creation to publication (VS2), and order to cash
(VS3), and customer relationship (VS4). Each value
stream has a process in it. There are 11 process map
(PM) namely, Product Design (PM1), Production
(PM2), Pricing (PM3), Content Creation (PM4),
Publication (PM5), Order Process (PM6), Order and
Payment Verification (PM7), Resolving Customer
Problems (PM8), Warranty Process (PM9),
Conversation (PM9), and Educating (PM10) (See
Figure 3).
In the decision stage, based on the process map
this research gathers core questions where the
business function must be prepared to provide
answers to making a decision. This research conducts
interviews with each NAH Project division that deals
with the value stream to find out what decisions they
make. There are 63 decisions which separated by
process map.
In making a decision need some analysis that
supports a decision. Based on the core questions that
must be answered by each division, this research also
collects 42 of analysis carried out by each division to
answer all the core questions. To do the analysis, data
that can be supported is needed. In this research 34
data were obtained (Table 2) required by the NAH
Project. These data can be either numerical or
qualitative data that can be collected by each business
function.
5 CONCLUSIONS
NAH Project has a business goals to become
"Indonesian cultist sneakers, who dominate the
sneakers market through innovation and
breakthrough" and they have rot definition as “NAH
Project change local brand sneakers image in
community by innovation and technology apply in
ICIB 2019 - The 2nd International Conference on Inclusive Business in the Changing World
410

Table 2: Data items.
No
Data
1
Product history
2
Number of order
3
Inventory
4
Sales
5
Customer preference
6
Target segment information
7
Economic condition
8
Technology condition
9
Customer complaint
10
Customer question
11
Social media usage
12
Customer activity
13
Customer interest
14
Customer opinion
15
Social traffic
16
Customer information
17
Customer payment information
18
Trending topic
19
Competitor's product
20
Competitor's product price
21
Competitor's information
22
Competitor's offer
23
Competitor's interaction process with
customer
24
Production capacity
25
Employee performance
26
Website traffic
27
Order and payment processing capacity
28
Number of customer questions
29
Number of questions resolved
30
Number of damaged items
31
Number of items has been repaired
32
Solution of complaint
33
Financial data
34
Number of customer response
order to be local brand sneakers that can compete
with branded sneakers at affordable price”. But based
on the results of the analysis it was found that the
current business process has not been maximized in
terms of innovation. First, in the R&D division, they
only redesigned shoes given by third parties
(PTS.sc). They feel confused in designing because
there is no clarity about the value of what will be
delivered in the new product and the lack of art
direction about how new products will be made.
Second, the unclear value of what is to be conveyed
is due to the absence of market research that causes a
lack of information on customer needs that should be
done before. Information about market needs will
greatly help R&D in developing products. Third, in
the Customer Services division, they have the desire
to provide the best service for customers by providing
same day service, and have a freight system that can
carry more than one shoe size so customers can try
on their shoes first and choose the right shoe size.
They have also collected data about customers to help
them determine which areas are potential for them to
have a branch or warehouse, but that is still very
limited at this time. Based on all three problems
mentioned earlier, the main focus to achieve their
business goals to become Indonesia cultist sneakers
is in R&D because to keep the business on going and
get revenue, the R&D capabilities must increase to
keep the product selling and meet the customer
expectation.
REFERENCES
Badan Ekonomi Kreatif. 2017. Laporan PDB Ekonomi
Kreatif Tahun 2014-2016. Badan Pusat Statistik.
http://www.bekraf.go.id/downloadable/pdf_file/1802
78-pdb.pdf. October 28, 2018.
Badan Pusat Statistik (BPS). 2015. Perkembangan Data
Usaha Mikro, Kecil, Menengah (UMKM) dan Usaha
Besar (UB) Tahun 2012-2017). Kementrian Koperasi
dan Usaha Kecil dan Menengah Republik Indonesia.
http://www.depkop.go.id/berita-informasi/data-
informasi/data-umkm/. October 28, 2018.
Checkland, P. 1981. Systems thinking, systems practice.
Chichester: Wiley.
Checkland, P., & Holwell, S. 1990. Action research: Its
nature and validity. Systemic Practice and Action
Research, 11, 9–21. doi: 10.1023/A:1022908820784
Davenport, T. H. & Harris, J. G. 2007. Competing on
analytics: The new science of winning. Boston: Harvard
Business Press.
Hindle, G. A., and Vidgen, R. 2018. “Developing a business
analytics methodology: A case study in the foodbank
Decision-Making Process in Small Medium Enterprise: Application of Business Analytics Methodology and Linking Model
411

sector”. European Journal of Operational Research,
Vol.268, pp. 836-851.
Iqbal, M., et al. (2018). A Study of Big Data for Business
Growth in SMEs: Opportunity and Challenges.
International Conference on Computing, Mathematics
and Engineering Technology. Sukkur, Pakistan.
Liberatore, M. J., & Luo, W. 2010. The Analytics
movement: Implications for operations research.
Interfaces, 40 (4), 313–324.
Marr, B. 2015. Big Data: A game Changer in The Retail
Sector. Forbes. https://www.forbes.com/sites/bernard
marr/2015/11/10/big-data-a-game-changer-in-the-re
tailsector/#33e953fb9f37. Accessed October 28, 2018.
Matthews, K. 2018. 5 Industries Becoming Defined by Big
Data and Analytics. Toward Data Science. https://to
wardsdatascience.com/5-industries-becoming-defined-
by-big-data-and-analytics-e3e8cc0c0cf . Accessed
October 28, 2018.
Osterwalder, A., Pigneur, Y. 2010. Business model
generation. Hoboken, NJ: John Wiley and Sons, Inc.
Pape, T. 2016. “Prioritising Data Items for Business
Analytics: Framework and Application to Human
Resource”. Europian Journal of Operation Research,
Vol. 252, pp.687-698.
Schniederjans, M. Schniederjans, D, and Starkey, C. 2014.
Business Analytics Principles, Concepts, and
Applications. Pearson Education, Inc. Upper Saddle
River, New Jersey 07458.
Vidgen, R., Shaw, S., & Grant, D. 2017. Management
challenges in creating value from business analytics.
European Journal of Operational Research, 261 (2),
626–639. doi: 10.1016/j.ejor.2017.02.023 .
ICIB 2019 - The 2nd International Conference on Inclusive Business in the Changing World
412
