
Assessing Free Cash Flow to Firm and Relative Valuation Method in
Agriculture Plantation Companies Listed in Indonesia Stock
Exchange in 2018
Riko Hendrawan
and Ernis Himawan
Telkom University, Jalan Gegerkalong Hilir, Bandung, Indonesia
Keywords: Agriculture Plantation companies; FCFF; Relative valuation; Bursa Efek Indonesia.
Abstract: As we know Indonesia is producer the largest CPO and the biggest Muslims in the world. Based on these
two points, the researcher tried to analyze agricultural plantation companies shares listed on the Indonesia
Stock Exchange especially sharia shares in 2018. The Stability of global CPO prices greatly influences
fluctuations stock price in the agriculture industry, why company valuation is needed. The Assessing
method employed DCF with the FCFF approach, and the Relative valuation method with PER and PBV
approaches. The 2013-2017 financial report is a basis for projections examination during period 2018-2022,
an example in research is a company that has the most substantial market value and equity in the ISSI Index
- consisting of AALI, SIMP, and LSIP applied in the pessimistic, moderate, and optimistic scenario. The
results of this study by adopting the DCF-FCFF method in all three scenarios, AALI intrinsic value, and
LSIP considered to overvalued, SIMP is undervalued. By employing Relative valuation method using the
PBV and PER approach; the AALI, SIMP and LSIP values still lie in the industry range based on IDX 1st
Quartal 2018. Referring to the calculation results, this study recommends sales for AALI and LSIP, buying
for SIMP.
1. INTRODUCTION
Indonesia is known as an agrarian country with the
largest oil palm production in the world.
Consequently, industrial growth is strongly
influenced by the value of world CPO prices. Based
on Malaysian data on palm oil, the value of palm oil
prices in the period 2017 to 2018 downward trend,
this reflected in Figure 1.1.
Figure 1.1: Palm Oil Price Graph.
The Indonesian Sharia Stock Index is a stock
index based on Islamic sharia which is included in
the List of Sharia Securities. Based on the
announcement of IDX No. Peng-
00452/BEI.OPP/06-2018 on June 7, 2018. There are
nine companies listed in the Indonesian Sharia Stock
Index which are engaged in the agriculture
plantation industry consisting of those in Table 1.1.
Figure 1.2: Tren Stock Price ISSI.
Hendrawan, R. and Himawan, E.
Assessing Free Cash Flow to Firm and Relative Valuation Method in Agriculture Plantation Companies Listed in Indonesia Stock Exchange in 2018.
DOI: 10.5220/0008427800850093
In Proceedings of the 2nd International Conference on Inclusive Business in the Changing World (ICIB 2019), pages 85-93
ISBN: 978-989-758-408-4
Copyright
c
2020 by SCITEPRESS – Science and Technology Publications, Lda. All r ights reserved
85
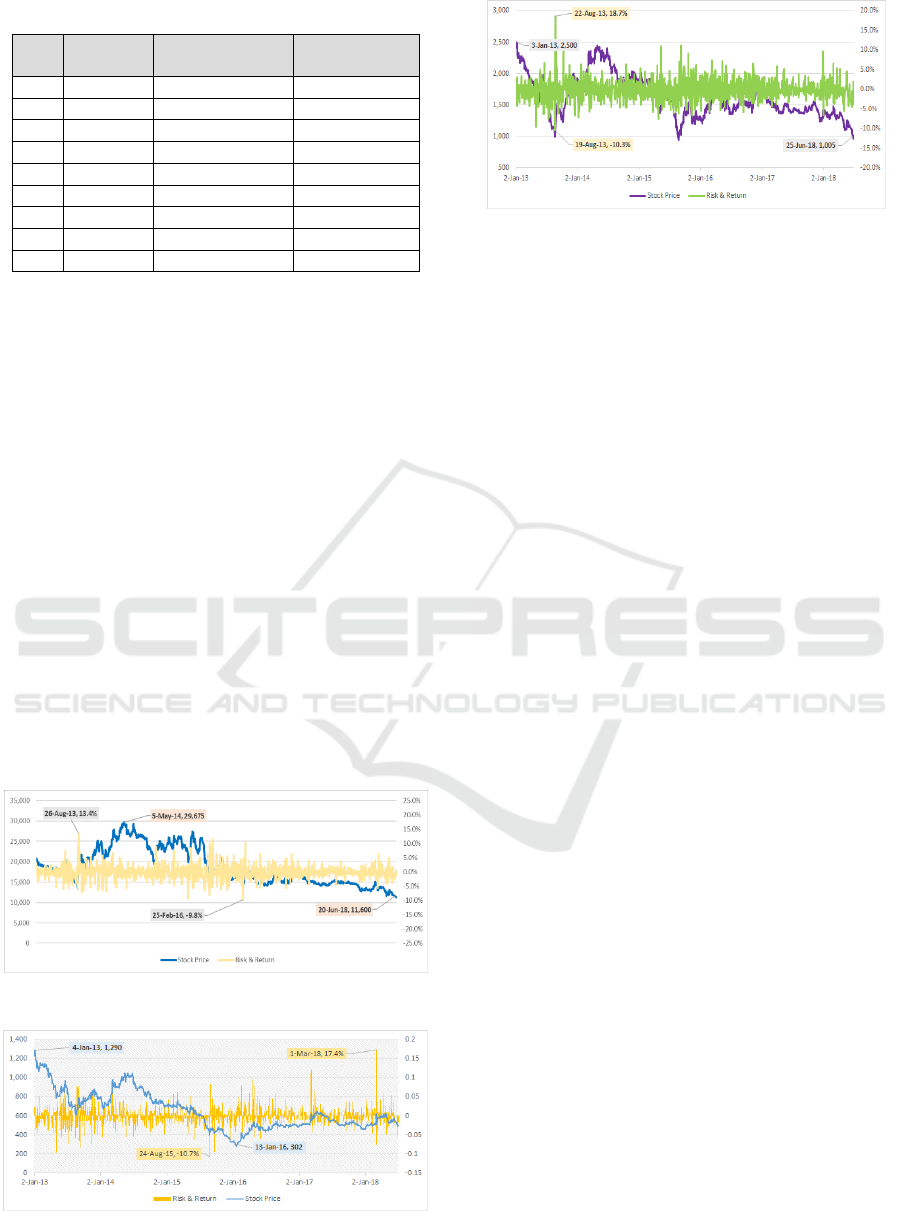
Table 1.1: List of Nine ISSI Shares in 2018.
Nu.
Code
Market Value
m. (IDR)
Equity
b. (IDR)
1
AALI
1,789,776
18,536
2
LSIP
1,621,795
8,122
3
SIMP
474,602
18,181
4
TBLA
177,225
4,000
5
GZCO
91,294
1,538
6
SGRO
42,501
4,005
7
ANJT
26,475
5,316
8
PALM
5,360
1,540
9
MAGP
1,264
754
The fluctuating value of the stock price shown in
designates that stock investment has a value of risk
and return that investors must bear within. This
study took three companies that possess the most
substantial market value and equity as a sample to
project the intrinsic value of the shares of the three
companies namely AALI, SIMP, and SIMP. Tren is
fluctuating stock price, risk and return present
Figure 1.3, Figure 1.4, and Figure 1.5.
Figure 1.3 shows the entire period of January
2013 to June 2018, the value of the stock price of
Astra Agro Lestari Tbk. (AALI) shows a decline,
but when seen in this period it was 13.4% on August
26, 2013, and the risk was -9.8% on February 25,
2016.
Figure 1.4 shows that during the period of January
2013 to June 2018 the value of the stock price of PT.
Salim Ivomas Pratama Tbk. (SIMP) shows a
downward trend, but further, when seen in that
period there is a return of 17.4% on March 1, 2018,
and risk of -10.7% on August 24, 2015
Figure 1.3: Tren Stock Price, Risk, and Return AALI.
Figure 1.4: Tren Stock Price, Risk and Return SIMP.
Figure 1.5: Tren Stock Price, Risk and Return LSIP.
While Figure 1.5 shows from January 2013 to
June 2018 the value of the share price of PT London
Sumatra Indonesia Tbk. (LSIP) shows a downward
trend in the value of shares, but when viewed in this
period it was 18.7% on August 22, 2013, and the
risk was -10.3% on August 19, 2013
Investment in stocks is speculative action as one
must deal with the uncertain value of stock prices in
a particular period of time.
Moreover, misprice might occur anytime.
Investment demands its player to apprehend the
fluctuation of stock prices and the company value.
Therefore, a valuation examination must be
conducted to determine the fair value of a company.
Some researchers conduct evaluations to assess the
fair price of companies.
Fundamental analysis is more relevant for stock
price valuation because it connects indicators
associated with the characteristics and financial
condition of the company, both from the cash flow
condition, risk profile, and even growth potential
due to varied investor's focus areas such as asset
quality, arrangement capital, and equity, even the
future potential of the company (Damodaran, 2006).
A valuation is a tool for analyzing and validating
a company, and an investor must conduct a valuation
in advance so that their decision will be in
accordance with the expected gain.
In conducting such an analysis, several
approaches can be utilized. The first one is used to
determine the intrinsic value of shares by
discounting the company's free cash flow and the
relative valuation method.
Based on the background as mentioned earlier,
assessing the company's intrinsic value included in
the Indonesian Syariah Stock Index is necessary,
especially in the agriculture plantation industry. This
study took three companies that possess the most
substantial market value and equity as a sample to
project the intrinsic value of the shares of the three
companies in the 2018-2022 period. The basis was
2013-2017 financial report historical data, run under
three scenarios: pessimistic, moderate, and
ICIB 2019 - The 2nd International Conference on Inclusive Business in the Changing World
86

optimistic; using the DCF-FCFF, RV-PBV, and RV-
PER analysis method.
2. LITERATURE REVIEW
2.1 Valuation on Stock Price
Valuation stock price is a process used to determine
the intrinsic value of a stock. There are two
techniques in evaluating, namely:
a. Fundamental analysis: an analysis that
considers multiple good factors in terms of
company performance, analysis of business
competition, industry analysis, and economic
analysis both macro and micro.
b. Technical analysis: an analysis technique
based on stock price fluctuations in a
particular period.
The purpose of valuation is to find out the value
of shares in overvalued or undervalued conditions,
and in general. Damodaran (2006) stated, there are
three methods of valuation, in between:
1. Discounted cash flow valuation.
2. Relative Valuation.
3. Contingent claim valuation.
2.2 Discount Cash Flow (DCF)
This method is a model that discounts the Free Cash
Flow Firm, Free Cash Flow Equity, and dividend
discounted model (Damodaran, 2006). DCF method
focuses on cash flows generated from the company's
business and operational activities or free cash flow
starting from the assumption that all company
expense reduces company revenues.
2.2.1 Free Cash Flow to Firm
Furthermore Damodaran (2006), that assessing the
most commonly used operating assets is the present
value of the expected free cash flow in the company.
The equation is expressed as follows:
WC (1)
In determining cash flow projections, a terminal
value is used. Damodaran (2006) asserted that
terminal value reflects the current value of the
company from all future cash flows obtained from a
predetermined period time based on the analysis
scenario. The equation is expressed as follows:
(2)
After getting the cash flow value obtained from a
certain period (FCFF scenario) and the Terminal
Value discounted for the present value, the projected
value of the Company is obtained. The equation is
expressed as follows:
(3)
2.2.2 Cost of Capital
Larrabee and Voss (2013) stated that Capital costs
are the average cost of each weighted source with
the proportion of total capital represented.
Therefore, the cost of capital is also referred to as
the weighted average capital cost (WACC).
WACC is one of the most critical factors in
calculating Discounted Cash Flow. Minor changes to
the WACC will result in significant changes in
company value. Weighted Average Cost of Capital
is the composition of the capital structure between
debt and equity. The equation is expressed as
follows:
(4)
2.3 Relative Valuation
The relative valuation method is one of the most
common asset valuation methods used to compare
the value of a company's stock price in the same
industry (Damodaran, 2006). One form of multiples
is price multiples, where the main component of
price multiple is market price, some examples of
price multiples are Price Earning Ratio and Price
Book Value.
2.3.1 Price Book Value
Price to Book Value multiple is defined as market
price per share compared to book value per share,
defined as follows:
(5)
2.3.2 Price Earning Ratio
The Earning Multiple Approach is defined as a
Market price per share compared to Earning per
share, defined as follows:
Assessing Free Cash Flow to Firm and Relative Valuation Method in Agriculture Plantation Companies Listed in Indonesia Stock Exchange
in 2018
87

(6)
2.4 Previous Research
Some researchers assessed supporting this research
as follow:
Zemba and Hendrawan (2018) stated in the
research explained about the business investment
opportunity of the health sub-sector in Indonesia is
still wide open, cause capacity of hospitals in
Indonesia can be served only 3.25% from total
potential patients, there is still has potential market
about 96.75% equivalent with 9,501,350 customers.
Some companies that invest in the health care
business in Indonesia, there are MIKA, SAME,
SILO, and SRAJ, all of which will be evaluated
using DCF and Relative Assessment. This research
is intended to search the fair value of the company.
This assessment reveals how well each company
makes more money in the future. Valid for all
companies, especially those in services such as
hospitals, good ratings are very sensitive, once
customers are exposed to a large scale to an event
that decreases the company's rating then to restore
fair prices takes a long time. Can be seen in a
hospital whose value is undervalued. Perform the
research in the healthcare industry using Discounted
Cash Flow and Relative valuation method, four
companies that were sample namely SAME, SILO,
SRAJ, and MIKA, three companies SAME, SRAJ
and MIKA were overvalued during 2018, and only
SILO shares are undervalued.
Neaxie and Hendrawan (2017) perform study
projection stock price telecommunication companies
2017-2020 stock prices of three telecommunications
companies using the DCF-FCFF method, Relative
valuation PER, PBV, and enterprise multiple
approaches in three scenarios. Results Analysis of
the study using the DCF-FCFF method of the fair
value of shares in the TLKM optimistic scenario,
and EXCL undervalued, ISAT is overvalued; TLKM
moderate scenario, undervalued, ISAT and EXCL
overvalued; The pessimist scenario of TLKM, ISAT
and EXCL are overvalued. While the results using
the Relative valuation method of the TLKM PER
approach, and EXCL is undervalued, ISAT is
overvalued; the TLKM, Overvalued, ISAT, and
EXCL PBV approaches are undervalued; TLKM's
Multiple EBITDA approaches, Overvalued, ISAT,
and EXCL are undervalued.
Renu and Christie (2018) perform a comparison
of these two analysis techniques. From the results of
the study found that fundamental analysis is more
directed at how to find reasons for changes in stock
price movements. The fundamental analysis mainly
depends on the strength of estimates over a period of
time. Most long-term investors care more about the
fundamentals of corporate investment in
fundamental analysis. The disadvantage of
fundamental analysis is that the process of analysis
is complicated and takes a long time which will be
difficult for ordinary people. More importantly,
fundamental analysis cannot predict quantum
movements but only predicts bias in the direction of
stock price movements while technical analysis has
the disadvantage of using efficient market
hypotheses as technical indicators. Predictions use
past stock price trends in valuing markets by
comparing random price distributions conditioned
which serves to estimate price changes. This is very
challenging for an efficient market concept where
prices cannot be predicted in a rational.
Reddy, et al. (2011) show whether the company
adds shareholder value by generating profits
exceeding and above the cost of capital and
measuring the value generated or spent by the
company in reducing the cost of capital from the
return of capital invested using the EVA method.
Based on the results of the research method of
return, the value of the performance measure against
SVA (Shareholder Value add) is EVA 84%, ROCE
45%, RONW 37%, EPS 26%. This analysis states
that EVA is the best measure for measuring
shareholder value.
Gordon (2016) perform research was conducted
to show the discovery of the problem. Therefore this
article was used to re-examine the problem of the
many findings in mortgage financing in developing
countries. The method used is DCF to provide
detailed information about inherent asset values
where mortgage financing can be used optimally.
Based on the results of the study it was found that
using traditional approaches usually did not take into
account variations in cash flows caused by vacancies
(vacancies) or rental revisions. Based on the results
of mathematic calculation assumptions, the value of
property mortgages is ₦12 million and is based on
the cost of ₦32 million with the same
accommodation. However, if you use the DCF
method the actual value is reflected around ₦15
million for the same property.
Ved (2013) in the study it states that although
Discounted Cash is a well-received method lately,
this method may not be suitable in certain cases, for
example in Investment Companies. How can one
assume the dividends to be paid in the future by the
investment company? Moreover, how people can
assume. The assessor must be based on the fact that
ICIB 2019 - The 2nd International Conference on Inclusive Business in the Changing World
88

the projections provided by management will
generally be growth-oriented. Therefore, it is
essential for the assessor to understand the risks
involved in achieving specific projections and hence
the discount rate and growth rate need to be chosen.
In some cases, the appraiser can recommend a set of
values and then submit to the relevant parties to
arrive at the transaction price in making a decision.
Foerster and Sapp (2006) discusses how
investors value financial assets by comparing
valuations obtained using fundamental valuation
methods and actual prices for equity during the
period of 1871 to 2005, fundamental valuation
methods require estimation of equity costs at each
time each time, whereas in dividend-based valuation
methods has performed quite well based on the
actual prices for the S & P Composite Index,
especially since 1945. Changes in the way investors
value equity over the past century, found the cost of
equity starting at 7% at the beginning of the century
to almost 11% today. Economic conditions too
explain differences and changes between estimated
costs an estimated cost of equity. The Fed Model,
but this undervaluation decreases over time, and the
Fed Model's predictive ability diminishes when one
considers other factors. We also compare the
estimated cost of equity (based on the CAPM) with
the implied steps of the actual price and dividend
series and can explain the many differences related
to economic conditions.
French (2013) complete This research uses three
valuation approaches including cost, market, and
income. In the income approach, the investment
method looks at the price of an asset that generates
income more than one period of holding an
investment. The cash flow discount (DCF) method
was developed to look at cash flows every three
months that describe the actual revenue from cash
flows. The aim is to provide general changes to the
DCF quarterly model.
The methodology used in this study is to look at the
picture of each quarter of the DCF model. That
based on research with the DCF quarterly model can
be seen to produce estimates of market value
because the use of DCF can be developed and
expanded, so it is useful to be able to do the cash
flow model appropriately.
3. THEORETICAL FRAMEWORK
The theoretical framework presented as figure 3.1.
The Indonesian Sharia Stock Index is a part of
the Indonesia Stock Exchange which is a sharia-
based stock index, the value of a fluctuating stock
price in the stock exchange is determined by the sell
(bid) and buy (demand) mechanism. Stock prices are
one of the important considerations when investing,
sentiment and information factors cause stock prices
to fluctuate, and consequently, it is difficult to
predict the value of stock prices in the future which
can cause mispriced. A valuation is a tool in
analyzing, evaluating and validating a company to
obtain intrinsic value based on
Value of the Firm
Value of the Firm
Valuation of intrinsic value
Valuation of intrinsic value
Relative Valuation Method
Relative Valuation Method
Market Price
Market Price
Sell/hold/buy
Sell/hold/buy
Undervalued
Undervalued
Fair
Fair
Overvalued
Overvalued
Discounted Cash Flow
Method
Discounted Cash Flow
Method
Free Cash Flow to Firm
Free Cash Flow to Firm
Price per Share
Price per Share
PER/PBV value
PER/PBV value
PBV
PBV
PER
PER
Optimistic
Scenario
Optimistic
Scenario
Moderat
Scenario
Moderat
Scenario
Pesimistic
Scenario
Pesimistic
Scenario
Optimistic
Scenario
Optimistic
Scenario
Moderat
Scenario
Moderat
Scenario
Pesimistic
Scenario
Pesimistic
Scenario
Average Industry
Average Industry
Under
Under
Over
Over
Sell/hold/buy
Sell/hold/buy
IDX 2018
IDX 2018
Indonesia Stock Exchange
Indonesian Syariah Stock Index
(AALI, LSIP, SIMP)
Indonesia Stock Exchange
Indonesian Syariah Stock Index
(AALI, LSIP, SIMP)
Figure 3.1: Frameworks.
the company's fundamentals. This valuation basis is
based on the assumption of the company's condition
in the future by using company historical data for
five years 2013-2017 as a basis for projecting the
period of 2018-2022.
The next process is the determination of
valuation values based on the DCF-FCFF method,
RV-PBV, and RV-PER. The projection of
determining the future cash flow is based on
assumptions using three scenarios of conditions,
namely pessimistic, moderate and optimistic. A
pessimistic scenario is a scenario that assumes that a
company's growth rate is below the growth of
industrial figures, a moderate scenario assumes that
conditions are very likely to be seen from the
company's fundamental figures and optimistic
scenario is a scenario that assumes that the
company's growth rate is above the growth of
industrial figures. The results of the analysis using
Assessing Free Cash Flow to Firm and Relative Valuation Method in Agriculture Plantation Companies Listed in Indonesia Stock Exchange
in 2018
89

the DCF-FCFF method will get intrinsic Price per
share while using RV-PBV and RV-PER will
produce a Price per share value based on equity and
earnings per share.
Based on the description of the information in the
previous article above, the researcher defines the
research as follows:
1. Identifying the intrinsic value of AALI, SIMP
and LSIP stock prices using the Discounted
Cash Flow Method Free Cash Flow to Firm
approach and comparing the Relative
Valuation method with the industry value in
the pessimistic scenario.
2. Identifying the intrinsic value of AALI, SIMP
and LSIP stock prices using the Discounted
Cash Flow Method Free Cash Flow to Firm
approach and comparing the Relative
Valuation method with the industry value in a
moderate scenario
3. Identifying the intrinsic value of AALI, SIMP
and LSIP stock prices using the Discounted
Cash Flow Method Free Cash Flow to Firm
approach and compare the Relative Valuation
method with the industry value in an
optimistic scenario.
4. Provide recommendations from results
analysis the intrinsic value of AALI, SIMP
and LSIP stock prices to investors based on
the Discounted Cash Flow Method Free Cash
Flow to Firm approach and Relative
Valuation method with the industry value in a
pessimistic, moderate and optimistic
scenario.
Based on the phenomena and conditions
described above, the purpose of this study is to find
the fair price of three agriculture-plantation
industrial companies listed on the Indonesia Stock
Exchange using the Discounted Cash Flow (DCF)
method with the Flow to Firm (FCFF) Free Cash
approach and Relative valuation method with Price
to Earning Ratio (PER) and Price Book Value
(PBV) approaches
4. METHODS
This type of research is verificative research with
quantitative methods, aimed at explaining the
existing phenomena by using numbers, namely
valuation to obtain intrinsic value of shares of
companies engaged in the Agriculture plantation
industry listed in the Sharia Stock Index Indonesia
using the Discounted Cash Flow method Free Cash
Flow to Firm approach and Relative Valuation with
the Price Book Value and Price Earning Ratio
approach.
5. DISCUSSION
This discussion reviews the results of research
obtained from each company using the Discounted
Cash Flow Method Free Cash Flow to Firm and
Relative Valuation with the Price Book Value and
Price to Earning Ratio approaches in three scenarios,
namely the pessimistic scenario, moderate scenario,
and scenario optimistic.
5.1 Results of Discount Cash Flow
Method Calculation
The results of a calculation, processing, and analysis
of overall stock valuation data based on the
Discounted Cash Flow Method Free Cash Flow to
Firm approach are shown in Table 5.1.1 below:
Table 5.1.1: DCF-FCFF Intrinsic Value.
Code
Scenario
Intrinsic
Value
Market
price 2
Jan’18
Condition
AALI
Pessimistic
6.135
13.275
Overvalued
Moderate
8.166
Overvalued
Optimistic
11.299
Overvalued
SIMP
Pessimistic
897
625
Undervalued
Moderate
1.039
Undervalued
Optimistic
1.120
Undervalued
LSIP
Pessimistic
669
2.425
Overvalued
Moderate
684
Overvalued
Optimistic
713
Overvalued
Source: calculations of researchers
The results of the study using Discounted Cash
Flow Free Cash Flow to Firm approach presented in
Table 5.1.1 obtained the intrinsic value of shares for
AALI, SIMP and LSIP companies using a
pessimistic, moderate and optimistic scenario. The
intrinsic value of the research if compared with the
market share price on January 2, 2018, the condition
of AALI and LSIP shares are overvalued. The
intrinsic value obtained from the AALI stock price
research in the pessimistic scenario was Rp. 6,135,
moderate scenario Rp. 8,166, optimistic scenario of
Rp. 11,299, the value is lower than the market share
value on January 2, 2018, which closes with the
value of AALI's shares of Rp. 13,275. Likewise, for
the intrinsic value of LSIP shares in a pessimistic
scenario as much as Rp. 669, moderate scenario Rp.
684, optimistic scenario Rp. 713, the intrinsic value
ICIB 2019 - The 2nd International Conference on Inclusive Business in the Changing World
90

is lower than the market share value on January 2,
2018, which closes with the value of LSIP shares of
Rp. 2,425. While for SIMP shares the condition is
undervalued in the pessimistic, moderate and
optimistic scenario. The intrinsic value obtained in
the research process is higher than the market share
value on January 2, 2019, which closes with the
value of SIMP shares of Rp. 625, whereas based on
the results of the research the intrinsic value of
SIMP shares in the condition of the pessimistic
scenario is Rp. 897, moderate scenario Rp. 1,039,
optimistic scenario Rp. 1,120.
5.2 Results of Calculation of the
Relative Valuation Method
In research using the relative valuation method with
the PBV and PER approaches, based on the results
of the calculation, processing, and analysis of the
overall data, the stock valuation values obtained are
presented in Table 5.2.1.
Table 5.2.1 is the result of relative valuation with
PBV and PER approaches AALI, SIMP, and LSIP
companies with a pessimistic, moderate and
optimistic scenario.
Based on IDX 1st Quarter 2018 data, the range
of PBV is 3.33 - 0.26 times, PBV value 3.33 times at
Sumber Mas Sarana Palm Oil Company (SSMS),
PBV value 0.26 times at Gozco Plantation Tbk
(GZCO) and for the average industry PBV is 1.14
times. While the PER value range is 31.28 - 52.18
times, PER value 31.28 times at Provident Agro Tbk
(PALM), PER -52.18 times at Multi Agro Gemilang
Plantation Tbk (MAGP) and for the average industry
PER is 1.41 times
The results showed that the PBV value of these
three companies when compared with IDX 1st
Quarter 2018, designated that the value of PBV and
PER AALI, SIMP and LSIP were still included in
the Industry value range.
PBV is the company's equity value. PBV can be
defined as stock prices compared to equity values
per share. It can be calculated by dividing the stock
price by Book Value, where the Book Value is
generated from equity divided by the average
number of shares outstanding. The higher the PBV
value, the more delta between the stock price and the
actual value. In the case of PBV analysis on the
agriculture plantation company, the analysis results
that stated that the lowest PBV value of the three
companies studied was LSIP company worth 0.56
times, which means that the value of the shares is
0.56 times compared to the book value.
Table 5.2.1: RV-PBV and RV-PER Intrinsic Value.
Code
Scenario
PBV
PER
AALI
Pessimistic
0,6370
5,08
Moderate
0,8479
5,88
Optimistic
1,1732
7,97
SIMP
Pessimistic
0,7801
9,01
Moderate
0,9035
9,46
Optimistic
0,9742
10,00
LSIP
Pessimistic
0,5624
5,70
Moderate
0,5743
5,77
Optimistic
0,5991
5,91
Source: calculations of researchers
PER is the most basic benchmark in fundamental
stock analysis. Simply stated, PER is a comparison
between the stock price and the company's net profit,
where the price of an issuer's stock is compared to
the net profit generated by the issuer in a year.
Because the focus of the calculation is the net profit
generated by the company, by knowing the PER of
an issuer, investors can find out whether the price of
a stock is reasonable or not. PER is generated by
dividing the stock price by earnings per share of the
company. Based on the research data, the highest
PER is SIMP shares which is equal to 10 times,
meaning that the intrinsic price of SIMP shares is ten
times greater than the company's net profit per share.
6. CONCLUSION
The valuation results are based on technical analysis
by considering fundamental matters, using standard
formulas in valuation science, so that it is concluded:
1. In the pessimistic scenario, the intrinsic value of
the shares of an agriculture plantation company
listed on the Indonesia Stock Exchange using
Discounted Cash Flow method for AALI is
overvalued because of the market price on
January 2, 2018, Rp. 13,275 is higher when
compared to the intrinsic value obtained from the
research results of Rp. 6,135, for SIMP are in an
undervalued condition due to market prices on
January 2, 2018, Rp. 625 is lower than the
intrinsic value that has been calculated at Rp.
875, while LSIP is overvalued because of the
market price on January 2, 2018, Rp. 2,425 is
higher than the intrinsic value that has been
calculated at Rp. 669.
Based on calculations using the Relative
Valuation method of the Price Book Value
Assessing Free Cash Flow to Firm and Relative Valuation Method in Agriculture Plantation Companies Listed in Indonesia Stock Exchange
in 2018
91

approach, the value of the three companies <1.14
(average industry), namely AALI has a value of
0.64 times, SIMP 0.78 times, and LSIP 0.56
times. Whereas with the Price Earning Ratio
approach, the value of the three companies> 1.41
(average industry), namely PER AALI has a
value of 5.08 times, SIMP of 9.01 times, and
LSIP of 5.7 times. The PBV and PER values in
the range industry based on IDX 1st Quarter
2018 data.
2. In the moderate scenario, the intrinsic value of
the shares of the agriculture plantation company
listed on the Indonesia Stock Exchange using the
Discounted Cash Flow method for AALI is
overvalued because the market price on January
2, 2018 Rp 13,275 is higher than the intrinsic
value obtained from the results of research Rp
8,166, for SIMP are in an undervalued condition
due to market prices on January 2, 2018 Rp 625
is lower than the intrinsic value that has been
calculated at Rp. 1,039, while for LSIP is
overvalued because of the market price on
January 2, 2018, Rp. 2,425 is higher than the
intrinsic value calculated at Rp. 684.
Based on calculations using the Relative
Valuation method of the Price Book Value
approach, the value of the three companies <1.14
(average industry), namely AALI has a value of
0.85 times, SIMP 0.90 times, and LSIP 0.57
times. Whereas with the Price Earning Ratio
approach, the value of the three companies> 1.41
(average industry), namely PER AALI has a
value of 5.88 times, SIMP of 9.46 times and
LSIP of 5.77 times. The PBV and PER values in
the range industry based on IDX 1st Quarter
2018 data.
3. In the optimistic scenario, the intrinsic value of
the shares of an agriculture plantation company
listed on the Indonesia Stock Exchange using the
Discounted Cash Flow method, for AALI is
overvalued because of the market price on
January 2, 2018, Rp. 13,275 is higher when
compared to the intrinsic value obtained from the
research results of Rp. 11,299, for SIMP it is in
an undervalued condition due to market prices on
January 2, 2018, Rp. 625 is lower than the
intrinsic value that has been calculated at Rp.
1,120, while for LSIP it is overvalued because of
the market price on January 2, 2018, Rp. 2,425 is
higher than the intrinsic value that has been
calculated at Rp. 713.
Based on calculations using the Relative
Valuation method of the Price Book Value
approach, AALI has a value of 1.17 times> 1.14
(average industry), for SIMP 0.97 times and
LSIP 0.60 times <1.14 (average industry).
Whereas with Price Earning Ratio approach, the
value of the three companies> 1.41 (average
industry), namely PER AALI has a value of 7.97
times, SIMP of 10 times, and LSIP of 5.91 times.
The PBV and PER values in the range industry
based on IDX 1st Quarter 2018 data.
4. The recommended intrinsic value of the
calculation results is in the pessimistic, moderate
and optimistic scenario with the DCF method of
AALI and LSIP shares being "sell", and SIMP
shares "buy", while based on AALI, SIMP, LSIP
relative valuations are worth buying or
maintained if investors have owned its shares
because its value is still in the industrial range
and is included in the category of good
performance.
7. FUTURE SCOPE
This study only 5-year history data, it is expected
that for the next research to improve the accuracy
and validity of the data valuation, you should use
longer history data, such as history for 10 years and
can combine by adding contingent claim method.
For investors in investing stock price agriculture
plantation industry, in addition to using the results of
assessments as a basis for reference in decision
making, they should also look at the business,
economic and social political conditions of the
country concerned. Indonesia is the produces the
largest crude palm oil in the world, and the value
palm oil prices greatly affect the price of the
industrial stock. Related to this, in the agriculture
industry we must pay attention to the conditions and
regulations in the largest consumer countries of
CPO, other vegetable oil prices, and attention to
issue environmental sustainability, which is the
phenomena can affect the selling price of CPO.
REFERENCES
Damodaran, A., 2006. Security Analysis for Investment
and Corporate finance. Second ed. New Jersey: John
Wiley & Sons, Inc.
Foerster, S. R. & Sapp, S. G., 2006. Dividends and Stock
Valuation: A Study From the Nineteenth to the
Twenty-First Century. JEL .
French, N., 2013. The discounted cash flow model for
property valuations: quarterly cash flows. Journal of
Property Investment & Finance, 31(2), pp. 208-213.
ICIB 2019 - The 2nd International Conference on Inclusive Business in the Changing World
92

Gordon, S., 2016. Diversifying Valuation Skills:
Discounted Cash Flow Imperatives For Sustainable
Mortgage Finance In An Emerging Market. IDC
International Journal, 3(3), pp. 1-24.
Larrabee, D. T. & Voss, J. A., 2013. Discounted Cash
Flow, Earnings Quality, Measures of Value Added,
and Real Options. VALUATION TECHNIQUES ed.
Hoboken, New Jersey.: John Wiley & Sons, Inc.
Neaxie, L. V. & Hendrawan, R., 2017. Stock Valuations in
Telecommunication Firms: Evidence from Indonesia
Stock Exchange. Journal of Economic and
Management Perspectives, 11(3).
Reddy, N. R. V. R., Rajesh, M. & Reddy, T. N., 2011.
Valuation through EVA and Traditional Measures an
Empirical Study. International Journal of Trade,
Economics and Finance, 2(1), pp. 19-23.
Renu, R. I. & Christie, P., 2018. Fundamental Analysis
Versus Technical Analysis-a Comparative Review.
International Journal of Recent Scientific Research,
9(1), pp. 23009-23013.
Ved, C. P., 2013. Valuation using Discounted Cash Flow
Method. The Chamber's Journal, Volume IX, pp. 8-
11.
Zemba, S. & Hendrawan, R., 2018. Does Rapidly
Growing Revenues Always Produce An Excellent
Company’s Value? DCF & P/E Valuation Assessment
on Hospital Industry. ISSN e-Proceeding of
Management, 5(2), pp. 2045-2060.
Assessing Free Cash Flow to Firm and Relative Valuation Method in Agriculture Plantation Companies Listed in Indonesia Stock Exchange
in 2018
93
