
Do Free Cash Flow to Firm and Relative Valuation Method Work in
Valuing Building and Construction Companies?:
A Test in IDX in 2018
Riko Hendrawan and Florent Ardhi Permadi
Telkom University, Jalan GegerkalongHilir, Bandung, Indonesia
Keywords: DCF, Relative Valuation, Building Construction Companies.
Abstract: This research aimed to take a fair valuation in estimating the stock price at the building construction
companies listed in IDX 2018 using DCF method within the FCFF approach and relative valuation methods
including PER and PBV. Three scenarios involved; pessimistic scenario (average industry condition),
moderate scenario (the most potential condition) and optimistic scenario (the condition above industry
growth). The research data were derived from historical data 2013 - 2017 which considered as the reference
for the projection years; 2018-2022. Results of this research presented that using DCF method, in the
optimistic, moderate, and pessimistic scenario, the intrinsic value of ADHI is overvalued; WSKT is
overvalued; WIKA is undervalued, and PTPP is undervalued. Furthermore, in Relative Valuation method
within PER approach, the PER value of ADHI in the optimistic, moderate and pessimistic scenario is 4.19,
3.73, and 3.32; WSKT 3.51, 3.13, and 2.38; WIKA 33.8, 33.4, and 26; PTPP 13.7, 13.7, and 13.6. In PBV
approach, the PBV value of ADHI in optimistic, moderate and pessimistic scenario is 0.76, 0.64, and 0.54;
WSKT 0.64, 0.56, and 0.42; WIKA 4.03, 3.95, and 3.04; PTPP 2.49, 2.49, and 2.47. The conclusion of this
research recommends buying ADHI, WSKT, WIKA and PTPP shares.
1 BACKGROUND
The Ministry of Finance of the Republic of
Indonesia posited that there had been an increment
in the infrastructure budget from 2014-2018 which is
accounted for 154.7 trillion to 410.7 trillion. This
significant increase illustrates the infrastructure
sector to be the main focus of the government of the
2014-2019 period. Following, the IDX gives
company update on December 31, 2017, as table 1.1.
Out of the 16 construction companies listed on
the IDX, there are four construction companies
which are state-owned enterprises (BUMN), namely
PT Waskita Karya (Persero) Tbk (WSKT), PT Adhi
Karya (Persero) Tbk (ADHI), PT Wijaya Karya
(Persero) Tbk (WIKA), and PT PP (Persero) Tbk
(PTPP). In 2017, the four companies managed to
record positive performance and control most of the
market.
Based on Figure 1.1, it can be concluded that
there are fluctuations in the value of stock prices
and yields, both negative and positive. ADHI has
the highest share price value on May 31, 2013, with
a value of 3,309 and meets its lowest price on
January 7, 2014, with a value of 1,213. Whereas the
condition of risk and return from this company also
experienced an increase and a decrease which was
equal to 16.25% positive yield on March 19, 2013,
and experienced negative returns on July 30, 2015,
with a value of -15.81%.
From Figure 1.2, it is shown that from January
2013 to June 2018 there was an increase in the share
price of WIKA on February 3, 2015, amounted to
3,815 and was at its lowest point on May 8, 2018,
and was at 1,250. For the highest yield occurred on
September 19, 2013, which is getting a yield of
14.31%, while the most significant risk occurred on
April 10, 2014, which was equal to -13.59%.
The same thing happened at WSKT, this
company has the highest share value on February
19, 2018, with a value of 3.110, and has the lowest
share value on January 7, 2014, with a value of 395.
Then for risk and return, the most significant return
occurs on January 13, 2014, with an increase of
15.18% and the most significant risk occurred on
August 19, 2013, with a percentage of -13.98%.
This fluctuation also occurs in PTPP, this company
has the highest share value on August 9, 2016, with
74
Hendrawan, R. and Permadi, F.
Do Free Cash Flow to Firm and Relative Valuation Method Work in Valuing Building and Construction Companies? : A Test in IDX in 2018.
DOI: 10.5220/0008427700740084
In Proceedings of the 2nd International Conference on Inclusive Business in the Changing World (ICIB 2019), pages 74-84
ISBN: 978-989-758-408-4
Copyright
c
2020 by SCITEPRESS – Science and Technology Publications, Lda. All rights reserved
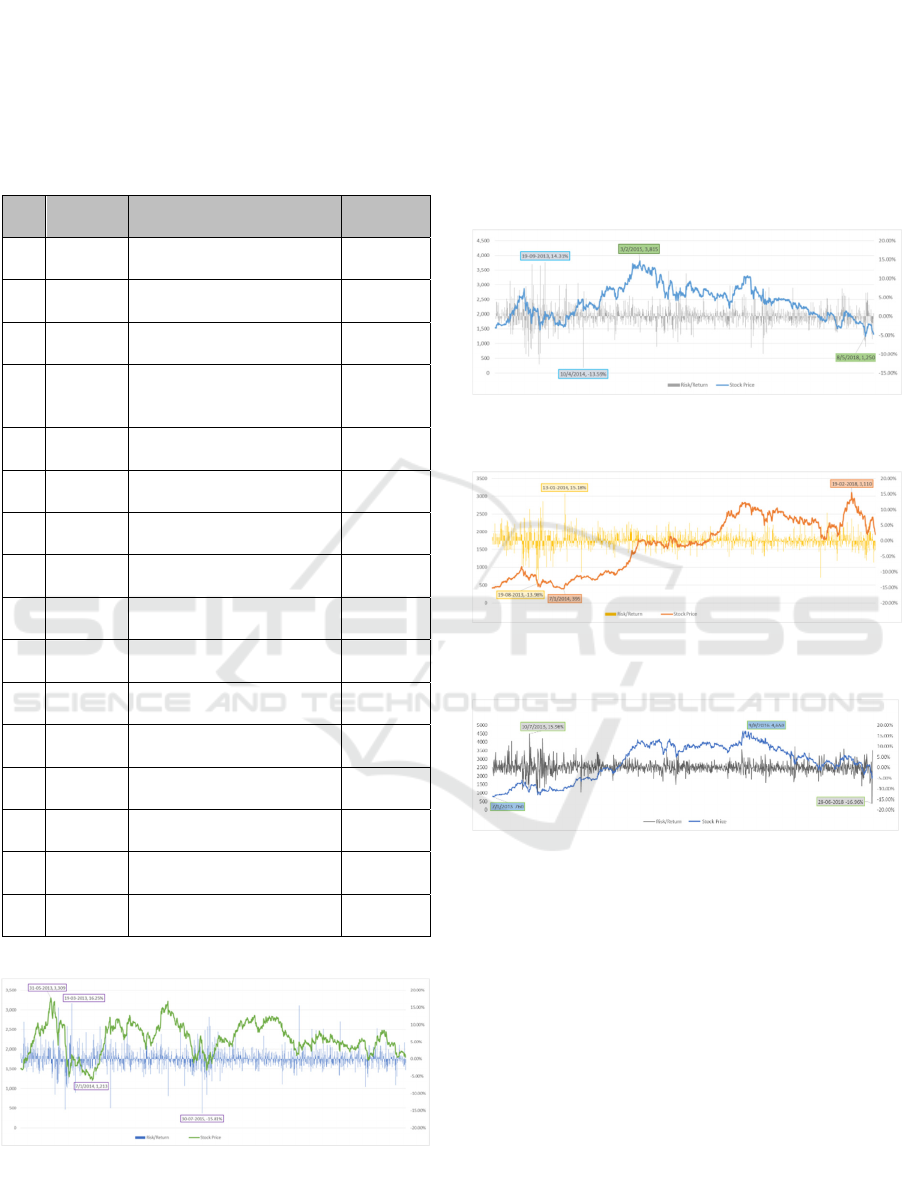
a value of 4.650, and has the lowest share value on
January 7, 2013, with a value of 760. Then for risk
and return, a return occurs the largest on July 10,
2013, with an increase of 15.96% and the most
significant risk occurred on June 28, 2018, with a
percentage of -16.96%.
Table 1.1: List of IDX construction companies.
No
Stock
code
Issuer
Date of
IPO
1 ACST Acset Indonusa Tbk 24-Jun-
13
2 ADHI Adhi Karya (Persero) Tbk 18-Mar-
04
3 CSIS Cahayasakti Investindo
Sukses Tb
k
10-May-
17
4 DGIK Nusa Konstruksi
Enjiniring Tbk d.h Duta
Graha Indah Tb
k
19-Dec-
07
5 IDPR Indonesia Pondasi Raya
Tbk.
10-Dec-
15
6 MTRA Mitra Pemuda Tbk. 10-Feb-
16
7 NRCA Nusa Raya Cipta Tbk 27-Jun-
13
8 PBSA Paramita Bangun
Saran Tb
k
28-Sep-
16
9 PSSI Pelita Samudera Shipping
Tb
k
5-Dec-
17
10 PTPP Pembangunan Perumahan
(
Persero
)
Tb
k
9-Feb-10
11 SSIA Surya Semesta Internusa
Tb
k
27-Mar-
97
12 TOPS Totalindo Eka Persada
Tb
k
16-Jun-
17
13 TOTL Total Bangun Persada
Tb
k
25-Jul-
06
14 WEGE Wijaya Karya Bangunan
Gedung Tb
k
30-Nov-
17
15 WIKA Wijaya Karya (Persero)
Tb
k
29-Oct-
07
16 WSKT Waskita Karya (Persero)
Tb
k
19-Dec-
12
Sources: IDX
Figure 1.1: Stock Price Trends vs. ADHI Risk / Return
January 2013 - June 2018.
However, a data trend of 2013-2017 revealed the
stock price of those companies to be quite volatile.
This condition has become uncertain and somewhat
risky for investors since the price reflects the
valuation of an asset, which might affect the returns
eventually generated. Without a fair price of shares,
it would be alarming for investors to regard a
position in investing: to buy or sell. As for owners,
valuation reflects company performance.
Figure 1.2: Stock Price Trends vs. WIKA Risk / Return
January 2013 - June 2018.
Figure 1.3: Stock Price Trends vs. WSKT Risk / Return
January 2013 - June 2018.
Figure 1.4: Stock Price Trends vs. PTPP Risk / Return
January 2013 - June 2018.
Price of a company's stock in the market might
come falsely in two directions: undervalued or
overvalued. Undervalued share indicates that the
company's stock price in the market is lower than the
intrinsic price/fair price. Otherwise, the overvalued
share implies that a company's market price is higher
than its intrinsic value.
Among many, there are two types of valuation
methods, namely (1) Discounted Cash Flow (DCF)
method with Free Cash Flow to Firm (FCFF)
approach, and (2) Relative Valuation method with
the Price Earning Ratio (PER) and Price to Book
Value (PBV) approach. FCFF method allows cash
flow to be evident to all fund providers (debt
holders, preferred shareholders, ordinary
Do Free Cash Flow to Firm and Relative Valuation Method Work in Valuing Building and Construction Companies? : A Test in IDX in 2018
75

shareholders, convertible bond investors, etc.). This
method can also be referred to as free cash flow
without flow, and this shows the surplus cash flow
available to the business if it is debt free. The
general starting point for calculating it is Net After
Tax Operating Income (NOPAT) which can be
obtained by multiplying Pre-Interest Profit and Tax
(EBIT) by (1-Tax Rate). This method is used to
avoid overstated valuation when a company has a
relatively sizeable other income.
Relative Valuation compares companies to other
company or industry nearby. PBV has a similar
formula with PER, which is equally useful to see
the fair price of a stock. Unlike PER which focuses
on net income, PBV focuses on company equity.
PBV is a comparison between stock prices and book
value. Book Value is a comparison between the
amount of equity and the number of shares
outstanding. If the PBV value is more than 1 (one),
the stock has been traded at a price higher than its
fair value.
There are three scenarios of projection:
1) Pessimistic Scenario--uses industrial growth
projection values.
2) Moderate Scenarios--where the projected value
of industrial growth is added to the interval/delta
between the growth of the industry and the
growth of the company.
3) The Optimistic Scenario--moderate scenario
coupled with a half times the delta between the
growth of the industry and the growth of the
company.
Based on the background aforementioned, the
objectives of this study are as follows:
1. To examine the fair price of ADHI, WIKA,
WSKT, and PTPP shares using the FCFF
method; compared to the Relative Valuation
method in an optimistic scenario.
2. To examine the fair price of ADHI, WIKA,
WSKT, and PTPP shares using the FCFF
method; compared to the Relative Valuation
method in a moderate scenario
3. To examine the fair price of ADHI, WIKA,
WSKT, and PTPP shares using the FCFF
method; compared to the Relative Valuation
method in the pessimistic scenario.
4. To provide recommendations for the calculation
of the fair price of ADHI, WIKA, WSKT, and
PTPP shares calculated using the method (FCFF)
and the Relative Valuation method in the
pessimistic, moderate and optimistic scenario.
From the exposure of the phenomena that have
been explained above, the purpose of this research is
to look for the fair prices (intrinsic value) of the
current building construction companies listed on
the Indonesia Stock Exchange (2013-2018) using the
Discounted Cash Flow (DCF) method with the Free
Cash Flow to Firm (FCFF) approach and the
Relative Valuation method with Price to Earning
Ratio (PER) and Price Book Value (PBV)
approaches.
2 LITERATURE REVIEW
2.1 Valuation Theory
Damodaran (2006) postulated that the prerequisite
for investment decision making lays in getting well
informed of the value of the asset to be invested and
what gives value to the asset. To gain profit, an
investor buys goods if the stock price is below its
fair value.
From the managerial perspective, the purpose of
valuation is getting the right consideration,
incentives, and control processes. For a manager,
valuation is a particular concern for change
"If I choose to take action, will it increase the
company's business or it will destroy it. After making
my choice, how do I evaluate whether the financial
results produce the results that I expect for
investors?".
Valuation may cover relative value and direction
value. It is essential to distinguish which business
units add value, which parts do not have influence,
or which parts will damage the company's business,
as well as how the relationship changes with time
(Thomas & Gup, 2010).
Damodaran (2006) also asserted that the
approach to valuing an asset is generally divided
into three methods:
a. Discounted Cash Flow Valuation
Using this valuation, the value of an asset is
based on the expected cash flow
b. Relative Valuation
This valuation method values an asset by
comparing it with other similar assets.
c. Contingent Claim Valuation
This method uses option pricing models to
assess assets that have option characteristics.
2.1.1 Company Value
Company value is the investor's perception of the
level of success of a company in managing resources
ICIB 2019 - The 2nd International Conference on Inclusive Business in the Changing World
76

that are currently associated with the company's
stock price. The price of its shares can express
company value. The stock price is determined from
the presence of requests and offers from investors.
High stock prices make the value of the company
high and can increase market confidence not only in
the company's current performance but also in the
prospects of the company. Stock prices on the
market do not necessarily reflect the right price of
the company.
2.1.2 Discounted Cash Flow
The discounted cash flow method is a stock
valuation method that utilizes the concept of the
time value of money. The postulate is that all money
flowing in the future (discount value) equals to
present value after being discounted. DCF is
obtained from company income, so DCF valuation
focuses on cash flows generated by one part of the
business, namely operating activities. The principle
is free cash flow departs from the assumption that
the company's income minus all costs is extra cash
(free cash flow). The extra cash is the right of all
parties who provide funding to companies, viz
creditors (lenders or bondholders) and shareholders.
The process of assessing a company with the
DCF method consists of several stages. Firstly, the
assumption of future free cash flow for the next five
to ten years was set. Subsequently, an appropriate
discount rate was anchored, for instance, using
WACC (determining the average capital cost to
discount all future FCFs to calculate present value).
Thirdly terminal value was determined. Terminal
value (TV) is the present value of all future cash
flows obtained after a certain projection period.
Lastly, the present value of the cash flow is summed
with the terminal value.
The DCF valuation method has three variations
of calculations that can be applied in conducting
stock valuation analysis according to the needs of
each analysis. The three variations are (1) dividend
discounted model; (2) free cash flow to equity; and
(3) free cash flow to the firm.
2.1.3 Free Cash Flow to Firm
FCFF is cash available to corporate funders, namely
shareholders and bonds after the company conducts
operations and investment activities. FCFF
calculates the value of a company without debt,
where operating costs have been excluded from
taxes and discounted using capital costs (WACC).
The calculation is as follows:
FCFF = EBIT (1-T) + D & A - CAPEX - Δ WC (1)
Determining the discount rate entails an in-depth
analysis of the company's financing structure and
current market conditions. The discount rate applied
for FCF discounts is called the weighted average
cost of capital (WACC). The formula is employed to
calculate the value of a company using FCFF whose
growth has stabilized in a given year, and after that
grows constant at the perpetual growth rate of g,
which can be expressed in Equation 2 (Damodaran,
2006)
Value of Firm =
∑
(2)
Terminal value is the present value of all future cash
flows obtained after a period determined by scenario
analysis. The formula used is as follows:
/
(3)
It is particularly challenging to estimate the exact
numbers that explicate how a company will continue
to grow in the future in the long run. Terminal
values are based on average growth expectations,
which are easier to predict. The reasoning behind
terminal values is to assume a constant growth rate
for the time after the period analyzed, where the
perpetual growth rate is symbolized by g then
WACC is symbolized by r as the discount rate used.
In most cases, the long-term and boarding growth
rates are determined by presumptions and assuming
that the economy always grows in the long run.
After determining the present value of the cash
flows obtained from the specified period and
scenario (FCFF) and also from the terminal value
discounted for the present value, then the two
present values are summed to provide the firm value
or equity value.
2.2 Cost of Capital
The cost of capital or the overall capital cost of a
company reflects the cost combination of all funding
sources used by the company. Furthermore, the
overall capital cost is called the Weighted Average
Cost of Capital (WACC). WACC is the average cost
after tax of each source of capital used by the
company to finance a project, as expressed in
Equation 4.
Weighted Average Cost of Capital = (Composition of
equity × rate of equity) + ((Composition of debt × rate of
debt) × (1 – tax))
(4)
Do Free Cash Flow to Firm and Relative Valuation Method Work in Valuing Building and Construction Companies? : A Test in IDX in 2018
77

Factors that influence the WACC:
Cost of Equity: The rate of return expected by a
shareholder (equity) in his investment in the
company.
Cost of Debt: The interest rate due, paid by the
company for its debt or external capital.
2.3 Relative Valuation
This most commonly used valuation method applies
a comparison study of similar companies or industry
within. Relative valuation discovers the value of an
asset by comparing it with other similar assets.
1) Price earning ratio (PER) Approach
Po = Estimasi EPS × PER (5)
2) Price to Book Value (PBV) Approach
(6)
3) Multiple EBITDA Approach
(7)
2.4 Previous Studies
Previous studies supporting this research are as
follows:
Zemba & Hendrawan (2018) use financial report
data for 5 years between 2013 and 2017, and use it
as a historical aspect to produce estimates for the
next 5 years 2018-2022, states that in the health
sector with SAME, SILO, SRAJ, and MIKA
samples, which evaluate using DCF and Relative
Valuation there are 3 companies whose shares are
overvalued and only SILO whose shares are
undervalued.
Neaxie & Hendrawan (2017) Stock Valuation
Using Discounted Cash Flow and Relative Valuation
Methods in Telecommunications Companies Listed
on Indonesian Stock Exchanges for Projections in
2017. This study discusses the fair valuation analysis
of shares using Discounted Cash Flow (DCF) and
Relative Valuation Methods in telecommunications
companies are listed on the Indonesia Stock
Exchange (IDX). The results show that using DCF
on an optimistic scenario, TLKM's fair value is
undervalued, ISAT's fair value is overvalued, and
EXCL's fair value is undervalued. Then using DCF
in the moderate scenario the TLKM’s fair value is
undervalued, ISAT's fair value is overvalued, and
the EXCL’s fair value is overvalued. Furthermore,
using DCF in the pessimistic scenario, TLKM’s fair
value is overvalued, the fair value of ISAT is
overvalued and the fair value of EXCL is
overvalued. Using the Relative Valuation method
with the Price Earning Ratio (PER) approach,
TLKM's fair value is undervalued, ISAT's fair value
is overvalued, and EXCL's fair value is undervalued.
Then with the Price Book Value (PBV) approach,
TLKM’s fair value is in an overvalued condition,
ISAT's fair value is in an overvalued condition, and
the EXCL’s fair value is in an undervalued
condition. Furthermore, with the approach of
EBITDA, TLKM’s fair value is overvalued, the fair
value of ISAT is in an undervalued condition, and
EXCL’s fair value is in an undervalued condition.
On their paper, Hauser & Thornton (2017) joins
measures of substantial development in a logit
relapse to characterize an exhaustive life-cycle
model of the probability of dividend payment. The
valuation of firms that conform to the model is
compared with the valuation of firms that do not fit
the model. Valuation is estimated by the market to
book (M/B) ratio. The investigation demonstrates
that dividend policy is related to firm value.
Dividend-paying firms that fit the life-cycle display
have a higher middle valuation than dividend-paying
firms that do not fit the life-cycle demonstrate.
Additionally, non-paying firms that fit the life-cycle
show have a higher middle valuation than non-
paying firms that do not fit the life-cycle model. The
outcomes likewise give proof that the vanishing
dividend phenomenon is identified with movements
in valuation.
Nissim (2013) Firm esteem is equivalent to the
present estimation of future money streams, so great
contender for value numerous valuation are basics
that are emphatically identified with future money
streams. Research in bookkeeping and account
shows that profit perform better than income in
anticipating future money streams, and, in like
manner, profit products create more accurate
valuations than income multiples. Consistent with
this proof, investigators use profit products more
frequently than income products. This is particularly
valid for safety net providers and other budgetary
administrations organizations because the money
related nature of most resources and liabilities of
these organizations makes money streams fairly self-
assertive.
Myers (2012) expressed that valuers need to
continually address the numerous issues that may
influence their risk and obligation to their customers.
Specifically, further research, vital learning
ICIB 2019 - The 2nd International Conference on Inclusive Business in the Changing World
78

improvement and market-explicit examination are
altogether required to build up valuers' heuristics. As
the market changes and creates, valuers need to
build up their sentiments and seeing simultaneously
with the market.
Liu, et al. (2007) analysis suggests that cash flow
is not king on equity valuation. They found that
reported earnings dominate reported cash flows as
summary measures of value in the United States.
They extended the analysis to other markets and
used forecasts of operating cash flows, dividends,
and earnings. They found that, although moving
from reported numbers to forecasts improves the
performance of operating cash flows, it improves the
performance of earnings to an even greater extent.
EPS forecasts represented substantially better
summary measures of value than did OCF forecasts
in all five countries examined, and this relative
superiority was observed in most industries. When
they compared dividends rather than operating cash
flows with earnings for a sample derived from seven
countries where dividend forecasts are frequent, they
found, again, that earnings forecasts were a better
summary measure of value than dividend forecasts
in all countries and most industries. So they found
that moving from reported numbers to forecasts
improved performance more for earnings than for
dividends.
DeFond & Hung (2003) stated that cash flows
are incrementally useful because they provide
information that complements the value-relevant
information contained in earnings. Market
participants can use cash flows to interpret the
information in earnings, for example, by comparing
cash flows to net income, because cash flows are
potentially less subjective than accruals. Such
comparisons are commonly suggested in financial
statement analysis textbooks to evaluate earnings
quality. Cash flows help market participants assess
firm viability by providing information about
solvency and liquidity. Such information is
potentially useful because even firms with strong
earnings ultimately rely on cash to repay debt and
purchase assets.
On his research, Ruback (2002) presents the
Capital Cash Flow (CCF) method of valuing risky
cash flows. This method is intuitive and
straightforward. The after-tax capital cash flows are
just the before-tax cash flows to both debt and
equity, reduced by taxes including interest tax
shields. The discount rate is the same expected
return on assets that are used in the before-tax
valuation. Because the benefit of tax-deductible is
included in the cash flows, the discount rate does not
change when leverage changes. The CCF method is
algebraically equivalent to the favored method of
discounting Free Cash Flows by the after-tax
weighted average cost of capital. However, in many
instances, the Capital Cash Flow method is
substantially easier to apply and, as a result, is less
prone to error. The ease of use occurs because the
Capital Cash Flow method puts the interest tax
shields in the cash flows and discounts by a before-
tax cost of assets. The cash flow calculations can
generally rely on the projected taxes, and the cost of
assets does not generally change through time even
when the number of debt changes. When applying
the Free Cash Flow method, taxes need to be
inferred, and the cost of capital changes as the
number of debt changes. The Capital Cash Flow
method is closely related to the Adjusted Present
Value method. Adjusted Present Value is generally
calculated as the sum of operating cash flows
discounted by the cost of assets plus interest tax
shields discounted at the cost of debt. The cost of
assets discounts the interest tax shields that are
discounted by the cost of debt in the APV method in
the Capital Cash Flow method. The Adjusted
Present Value method results in a higher value than
the Capital Cash Flow method because it treats the
interest tax shields as being less risky than the firm
as a whole because the level of debt is implicitly
assumed to be a fixed dollar amount. As a result, a
tax adjustment is made when unlevering an equity
beta to calculate an asset beta. In contrast, the
Capital Cash Flow method, like the FCF method,
makes the more economically plausible assumption
that debt is proportional to value. The risk of the
interest tax shields, therefore, matches the risk of the
assets.
2.5 Theoretical Framework
The thinking framework of this study can be
presented as shown in Figure 2.1.
A stock price is an essential consideration when
investing in stocks. However, there are numerous
factors which cause fluctuations in stock prices--and
the trend is not robust to predict correctly.
Furthermore, there are also mispriced stocks
(wrongly priced stock: too high-priced or too cheap).
One of the best techniques to anticipate the risk of
the stock price fluctuation is to carry out a
fundamental analysis. The fundamental analysis
suggests evaluating the intrinsic value of shares.
This method proffers investors a long-term picture
of the actual value of shares which also means the
company's fundamental value.
The valuation of shares that produce information on
intrinsic value will then be compared with the stock
market price to determine the selling or buying
Do Free Cash Flow to Firm and Relative Valuation Method Work in Valuing Building and Construction Companies? : A Test in IDX in 2018
79
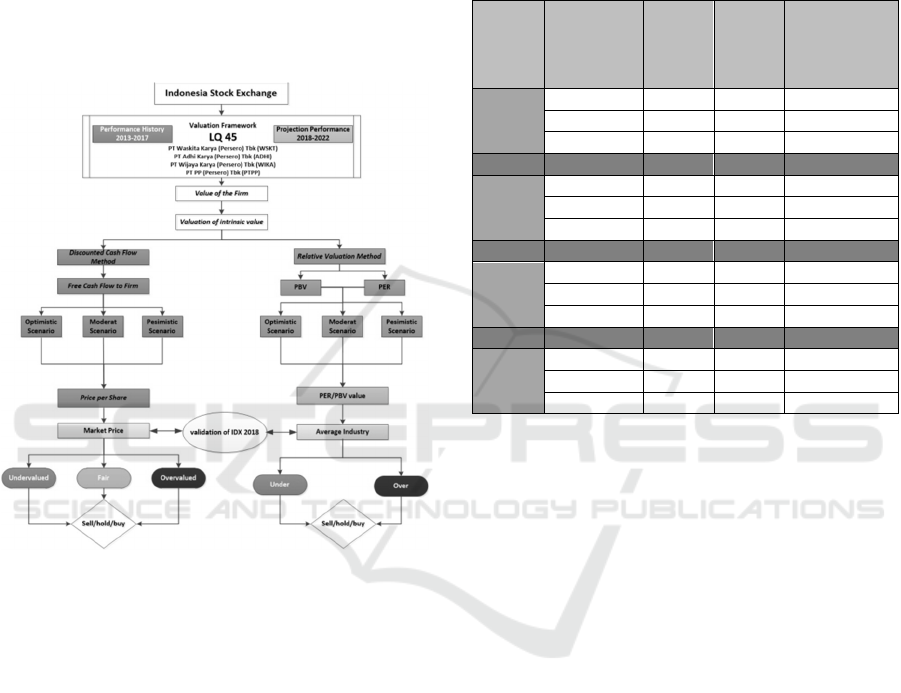
position of a company's stock. The valuation of
intrinsic value is based on assumptions and the
determination of the projected fundamental value of
the company. Valuation of intrinsic value will be
calculated using the DCF method with the FCFF
approach and will be compared with the relative
valuation method with the PER and PBV
approaches. The basis of valuation is based on
assumptions and projections of company conditions.
This research is limited to using historical data from
2013-2017 as a basis for projections.
Figure 2.1: The Thinking Framework.
Succeeding the projection, the future cash flow,
and its present value is calculated. In the calculation,
three scenarios were used: optimistic, moderate and
pessimistic. The optimistic scenario runs under the
assumption that the company gains the highest
growth (as in industrial growth and the target of
company management). The moderate scenario runs
under the assumption which is most likely to occur.
Lastly, the pessimistic scenario was assumed to have
the worst conditions or circumstances under
industrial growth.
The final valuation process is obtaining equity
value or the intrinsic value of the company,
succeeded by getting intrinsic value for each share in
each condition scenario.
2.6 Discussion
2.6.1 Results of FCFF Calculation
By utilizing the FCFF method, the intrinsic value of
a company is obtained, and shown in Table 2.1.
Table 2.1: Intrinsic Value of the Company.
Scenario
Intrinsic
Value
Stock
Price
Jan 2
nd
2018
Condition
ADHI
Pessimistic 885 1,865 Overvalue
d
Moderate 1,051 1,865 Overvalue
d
O
p
timistic 1,249 1,865 Overvalue
d
WSKT
Pessimistic 699 2,190 Overvalue
d
Moderate 946 2,190 Overvalue
d
Optimistic 1,078 2,190 Overvalue
d
WIKA
Pessimistic 4,965 1,565 Undervalue
d
Moderate 6,448 1,565 Undervalue
d
Optimistic 6,565 1,565 Undervalue
d
PTPP
Pessimistic 5,667 2,620 Undervalue
d
Moderate 5,708 2,620 Undervalue
d
O
p
timistic 5,729 2,620 Undervalue
d
Sources: Author's computations
For WIKA and PTPP, in the pessimistic,
moderate and optimistic scenario, the intrinsic value
is higher than the value of shares in the market
today. On that date, the share value for WIKA was
1,565, while for PTPP it was 2,620. Using a
pessimistic scenario, WIKA's intrinsic value is 4,965
and PTPP is 5,667; thus the stock price in the market
is undervalued.
2.6.2 Calculation Results with PER and
PBV Methods
The calculation results using the Relative Evaluation
method with the PER and PBV approaches are as
table 2.2.
Under the pessimistic scenario, the ADHI PER
value is 3.32 times, WSKT 2.38 times, WIKA is
25.95 times, while PTPP is 13.60 times. In IDX
quarterly data (Q1 2018), the average PER value of
construction companies is 25.50 times, with the
lowest PER value at Surya Semesta Internusa Tbk.
(SSIA) of 2.20 times and the highest PER value in
Cahayasakti Investindo Sukses Tbk. (CSIS) of
1,612.94 times. These points explicate that the
results of research calculations are in the range of
PER in the market.
ICIB 2019 - The 2nd International Conference on Inclusive Business in the Changing World
80

Table 2.2: PER Value and PBV Calculation.
Relative
Valua-tion
Pesimistic Moderate Optimistic
PER PBV PER PBV PER PBV
ADHI 3.32 0.54 3.73 0.64 4.19 0.76
WSKT 2.38 0.42 3.13 0.56 3.51 0.64
WIKA 26 3.04 33.4 3.95 33.8 4.03
PTPP 13.6 2.47 13.7 2.49 13.7 2.49
Sources: Author's computations
The focus of this calculation is the net profit that
has been generated by the company. Kenning the
PER of an issuer, investors may find out whether the
price of a stock is reasonable or not. PER is obtained
by dividing the share price with the company's
earnings per share (EPS) displayed on the company's
financial statements. The higher the PER value of a
stock, the more expensive the stock is.
Table 2.2 explicates that WIKA has the highest
PER, accounted for 25.95 times, indicating the
intrinsic price of WIKA's shares is worth 25.95
times compared to the company's net profit per
share. Concurrently, the smallest PER is in WSKT
company which is equal to 2.38 times, which means
that the share price is worth 2.38 times per share
(EPS). For investors, a small PER value can be one
of the references in investing, because one of them
with a more massive EPS, will also increase the
possibility of being able to get higher returns.
The results of the study under pessimistic
scenario designate that the ADHI PBV value is 0.54
times, the WSKT PBV value is 2.38 times, the
WIKA PBV value is 3.04 times, and the PTPP PBV
value is 2.47 times. In quarterly IDX data (Q1 2018)
the average PBV value of construction companies is
3.35 times, with the lowest PBV value on Nusa
Konstruksi Engineering Tbk. (DGIK) of 0.47 times
and the highest PBV value in Totalindo Eka Persada
Tbk. (TOPS) of 21.00 times. This result shows that
the results of research calculations are in the PBV
range in the market.
PBV can be defined as a 'stock price compared to
the value of equity per share.' The number was
obtained by dividing the stock price by Book Value
(BV), where BV is generated from equity divided by
the average number of shares outstanding. The
concept of its application is corresponding with
PER: the higher the value of PBV, the higher the
price of the stock.
The lowest PBV value of the four companies
studied is WSKT which is 0.42 times, this signifies
that the value of the shares is smaller than 0.42 times
contrasted to the value of the book. The most
considerable PBV value of WIKA is 3.04 times; this
indicates that the intrinsic value of its shares is 3.04
times compared to its valuation book value.
Table 3.1: Summary of ADHI Analysis.
Method Scenario
Intrinsi
c value
Evaluation
Recom-
men-
dation
DCF-
FCFF
Pessimistic 885 Overvalue
d
Sell
Moderate 1051 Overvalued Sell
Optimistic 1249 Overvalue
d
Sell
RV-
PER
Pessimistic 3.32
AVG
PER Industry
25.50
Buy
Moderate 3.73 Buy
Optimistic 4.19 Buy
RV-
PBV
Pessimistic 0.54
Undervalued
Buy
Moderate 0.64
Undervalued
Buy
Optimistic 0.76
Undervalued
Buy
Sources: Author’s computation
3 ANALYSIS
3.1 Analysis of PT Adhi Karya
(Persero) Tbk.
Using FCFF in three scenarios, "selling"
recommendations are obtained because the results of
ADHI's theoretical calculations allow overvalued
intrinsic values of stocks.
With the PER approach, the three scenarios
produce a PER value that is underneath the industry
PER average value. Industry-wise, ADHI's PER is
still a good investment. Therefore it is recommended
to "buy" those mentioned above.
The stock calculation approach with PBV
produces a value below one in all three scenarios,
which means that the value of shares in the market is
smaller than the value of the book value;
accordingly, the stock is worth buying.
It can be concluded that ADHI's shares are worth
buying or maintaining. Also, the trend of revenue
growth for this company is perfect, during the last
three years a positive trend has been obtained, for
example, in 2016-2017, the growth of the revenue
was 36.99%
3.2 Analysis of PT Waskita Karya
(Persero) Tbk.
By employing the FCFF method, it is recommended
to "sell" because the results of original calculations
exhibit the intrinsic value of stocks to be overvalued.
Do Free Cash Flow to Firm and Relative Valuation Method Work in Valuing Building and Construction Companies? : A Test in IDX in 2018
81

By employing PER method, the PER value is
beneath the average value of the Industrial PER.
Table 3.2: Summary of WSKT Analysis.
Method Scenario
Intrinsic
value
Evaluation
Recom-
mendation
DCF-
FCFF
Pessi-
mistic
699
Over-
value
d
Sell
Mo-
derate
946
Over-
value
d
Sell
Opti-
mistic
1078
Over-
value
d
Sell
RV-PER
Pessi-
mistic
2.38
AVG PER
Industry
25.50
Buy
Mo-
derate
3.13 Buy
Opti-
mistic
3.51 Buy
RV-PBV
Pessi-
mistic
0.42
Under-
value
d
Buy
Mo-
dera
t
e
0.56
Under-
value
d
Buy
Opti-
mistic
0.64
Under-
value
d
Buy
Sources: Author's computations
Industry-wise, the PER for WSKT is still a
reliable investment, so it is recommended to "buy"
it.
By employing PER method, the PER value is
beneath the average value of the Industrial PER.
Industry-wise, the PER for WSKT is still a reliable
investment, so it is recommended to "buy" it.
By employing PBV method, PBV is produced
below one in all three scenarios, implying that the
value of shares in the market is smaller than the
value of the book value; therefore, it is
recommended to "buy" shares of WSKT.
3.3 Analysis of PT Wijaya Karya
(Persero) Tbk.
According to FCFF method, in three calculation
scenarios, it is suggested to "buy" as the calculation
exposes that the intrinsic value of the "undervalued"
stock.
The PER value for WIKA is above the industry
average, so it is recommended to "sell".
The stock calculation approach using Price Book
Value (PBV) produces a value above one in all three
scenarios, which implies that the value of shares in
the market is higher than the book value; therefore
WIKA's shares are recommended for sale.
However, WIKA's shares are worth considering
because revenue growth over the past five years has
always been positive. Based on the 2017 financial
report, WIKA's revenue in 2017 was IDR
26,176,403,026,000.00 improved from 2016 at level
Table 3.3: Summary of WIKA Analysis.
Method Scenario
Intrinsic
Value
Evaluation
Recommen
-dation
DCF-
FCFF
Pessimistic 4965 Unde
r
-valued Buy
Moderate 6448 Unde
r
-valued Buy
Optimistic 6565 Unde
r
-valued Buy
RV-PER
Pessimistic 25.95
AVG PER
Industry
25.50
Sell
Moderate 33.39 Sell
Optimistic 33.84 Sell
RV-PBV
Pessimistic 3.04 Ove
r
-valued Sell
Moderate 3.95 Ove
r
-valued Sell
Optimistic 2.49 Ove
r
-valued Sell
Sources: Author's computations
of IDR 15,668,832,513,000.00--accounted for
67.06% of increase.
Analysis of PT PP (Persero) Tbk.
By employing the FCFF method, it is recommended
to "buy" because the results of PTPP's necessary
calculations exhibit an undervalued intrinsic value.
Table 3.4: Summary of PTPP Analysis.
Method Scenario
Intrinsic
value
Evaluation
Recommen-
dation
DCF-
FCFF
Pessimistic 5667
Under-
value
d
Buy
Moderate 5708
Under-
value
d
Buy
Optimistic 5729
Under-
value
d
Buy
RV-PER
Pessimistic 13.60
AVG PER
Industry
25.50
Buy
Moderate 13.66 Buy
Optimistic 13.70 Buy
RV-PBV
Pessimistic 2.47
Over-
value
d
Sell
Moderate 2.49
Over-
value
d
Sell
Optimistic 2.49
Over-
value
d
Sell
Source: Author's computations
By applying the PER approach, PER value is
identified to be below the average industry value.
The PER for PTPP is worthy of being an investment
target; consequently, it is recommended to "buy".
According to Price Book Value (PBV), the value
is above one in all three scenarios, indicating that the
value of shares in the market is higher than the value
of the book value; accordingly, the shares of PTPP
are recommended for sale.
Although the results of PBV analysis for PTPP
shares assert that the value of the shares is higher
than the book value, in the point of view of the
industry, the average PBV value for the construction
industry is 3.35. This number suggests PBV value
for PTPP to be still good and still quite far from the
industry average. The condition might be taken into
ICIB 2019 - The 2nd International Conference on Inclusive Business in the Changing World
82

consideration as to retain shares previously
possessed by investors, or as one might plan to
purchase PTPP shares.
4 CONCLUSION
It can be concluded that under the optimistic
scenario and with the Discounted Cash Flow
method, ADHI and WSKT are overvalued because
the market price on January 2, 2018, is higher than
the intrinsic value. WIKA and PTPP are in an
undervalued condition because the market prices are
lower than their intrinsic value.
By using the Relative Valuation method in the
PER (Price Earning Ratio) approach, ADHI has a
value of 4.19 times, WSKT 3.51 times, WIKA 33.8
times, and PTPP 13.7 times. With the PBV (Price
Book Value) approach, ADHI has a value of 0.76
times, WSKT 0.64 times, WIKA 4.03 times and
PTPP 2.49 times. The PER and PBV values are in
the PER and PBV values in the market based on
IDX "Financial Data & Ratio" data for the 2018
quarter one period.
In the meantime, under the moderate scenario,
with the Discounted Cash Flow method, ADHI and
WSKT are overvalued. WIKA and PTPP are in an
undervalued condition. By employing Relative
Valuation method and the PER (Price Earning Ratio)
approach, ADHI has a value of 3.73 times, WSKT
3.13 times, WIKA 33.4 times and PTPP 13.7 times.
With the PBV (Price Book Value) approach, ADHI
has a value of 0.64 times, WSKT 0.56 times, WIKA
3.95 times and PTPP 2.49 times. The PER and PBV
values are in the PER and PBV values in the market
based on IDX "Financial Data & Ratio" data for the
2018 quarter one period.
As under the pessimistic scenario with the
Discounted Cash Flow method, ADHI and WSKT
are overvalued. WIKA and PTPP are in an
undervalued condition. By applying Relative
Valuation method with the PER (Price Earning
Ratio) approach, ADHI has a value of 3.32 times,
WSKT 2.38 times, WIKA 26 times and PTPP 13.6
times. With the PBV (Price Book Value) approach,
ADHI has a value of 0.54 times, WSKT 0.42 times,
WIKA 3.04 times and PTPP 2.47 times. The PER
and PBV values are in the PER and PBV values in
the market based on IDX "Financial Data & Ratio"
data for the 2018 quarter one period.
Eventually, the recommendations given under
the condition of pessimism, moderation and
optimism are shares of PT Waskita Karya (Persero)
Tbk (WSKT), PT Adhi Karya (Persero) Tbk
(ADHI), PT Wijaya Karya (Persero) Tbk. (WIKA)
also, PT PP (Persero) Tbk. (PTPP).
5 RECOMMENDATION
It is suggested that the succeeding researcher may
enhance the level of accuracy and validity of the
data by utilizing more extensive historical data, such
as history for at least ten years.
For further research, this research can be used for
reference in the use of theory and research methods
because it has been proven to get results that are in
accordance with real conditions, compared to data
from IDX.
For investors in investing, in addition to using
the results of valuation assessments as a basis for
reference in decision making, they should observe
the business, economic and social-political
conditions of the country concerned.
For companies, to maintain and increase the
value of shares in the market, in addition to
improving the performance of companies with
revenue and EAT, companies must examine the cost
& expense of the company both OPEX and CAPEX.
In this case, the company must carry out cost &
expense records that burden the company.
Companies must be able to maintain the PER and
PBV values below the industry average, individually
25.50 for PER and 3.35 for PBV.
REFERENCES
Damodaran, A., 2006. Damodaran on Valuation. United
States of America: John Wiley and Sons Inc.
DeFond, M. L. & Hung, M., 2003. An empirical analysis
of analysts’ cash flow forecasts. Journal of Accounting
and Economics, Volume 35, p. 73–100.
Hauser, R. & Thornton, J. H., 2017. Dividend policy and
corporate valuation. Managerial Finance, 43(6), pp.
663-678.
Hausman, J., 2012. Contingent Valuation: From Dubious
to Hopeless. Journal of Economic Perspectives, 26(4),
p. 43–56.
Liu, J., Nissim, D. & Thomas, J., 2007. Is Cash Flow King
in Valuations?. Financial Analysts Journal, 63(2), pp.
56-65.
Myers, G. W., 2012. The value of sustainability in real
estate: a review from a valuation perspective. Journal
of Property Investment & Finance, 30(2), pp. 115-144.
Neaxie, L. V. & Hendrawan, R., 2017. Stock Valuations in
Telecommunication Firms: Evidence from Indonesia
Stock Exchange. Journal of Economic and
Management Perspectives, 11(3).
Do Free Cash Flow to Firm and Relative Valuation Method Work in Valuing Building and Construction Companies? : A Test in IDX in 2018
83

Nissim, D., 2013. Relative Valuation of U.S. Insurance
Companies. Review of Accounting Studies, Volume
18, p. 324–359.
Penman, S., 2016. Valuation: Accounting for Risk and the
Expected Return. Abacus, 52(1), pp. 106-130.
Ruback, R. S., 2002. Capital Cash Flows: A Simple
Approach to Valuing Risky Cash Flows. Journal
Financial Managemet, 31(2), pp. 85-103.
Thomas & Gup, 2010. The Valuation Handbook,
Valuation Techniques from Today’s Top Practitioners.
United States of America: John Wiley and Sons Inc.
Zemba, S. & Hendrawan, R., 2018. Does Rapidly
Growing Revenues Always Produce An Excellent
Company’s Value? DCF & P/E Valuation Assessment
on Hospital Industry. e-Proceeding of Management,
5(2), pp. 2045-2060.
ICIB 2019 - The 2nd International Conference on Inclusive Business in the Changing World
84
