
Indonesian Listed Bank Efficiency in 2008 – 2017 using
Data Envelopment Analysis (DEA)
Barkah Kristianto
and Riko Hendrawan
Telkom University, Jl. Gegerkalong Hilir No. 47, 40251, Bandung, Indonesia
Keywords: Bank Efficiency, Data Envelopment Analysis (DEA), IDX.
Abstract: These study objectives are to examine and compare the level of efficiency conventional bank listed in IDX
using Data Envelopment Analysis with Intermediation approach, Input, and Output orientation method.
Input Variables are Fixed Asset, Personal Cost, Deposit and output variables are Net Interest Income,
Investment, Loan. Observes 34 conventional banks and uses ten years period Bank's Financial Report from
2008 until 2017. Findings from this research shows that Bank Rakyat Indonesia is the most efficient bank
and furthermore state-owned banks is the most efficient with 0.966 efficiency score, followed by local
government banks, mix national and foreign private banks, and national private banks with efficiency score
of 0.956, 0.903 and 0.837 respectively and the area improvement of each group consecutively are 0.025,
0.019, 0.087 and 0.148. The result also shows from correlation analysis show that there is a weak
relationship between bank efficiency result and performance ratio (ROA, ROE, NIM, BOPO, LDR) in the
bank's financial report.
1 INTRODUCTION
The condition of the banking sector in Indonesia has
undergone many changes from time to time. This
change was caused not only by the internal
development of banking but also due to
developments in things other than banking, such as
economics, social affairs, law, and politics. Also,
with this development where deregulation and the
implementation of other policies have made
Indonesian banking as one of the essential actors in
improving macroeconomic performance in
Indonesia, it can be seen from the number of funds
channeled according to the OJK of more than 7000
trillion rupiahs.
The development of the banking world can be
seen from many banks in Indonesia where according
to Indonesia banking statistics issued by OJK in
February 2018 there were 13 Sharia Banks, 102
Conventional Commercial Banks, and 1615 Rural
Banks.
Among the 115 Commercial Banks, there are 43
banks selling securities or issuing emissions
(becoming issuers) on the Indonesia Stock
Exchange.
The banking industry is currently influenced by
digital technology which has been highly developed
in the past ten years, one of which is the
development of companies fintech which are
disruptive technologies towards the conventional
banking industry.
To see banking conditions can be seen from data
on profit growth and banking assets, from the table
below, it shows that there is a decrease in
Operational Profit growth in the banking industry in
5 years from 2011 to 2016. From graph 1, it shows
that in 2012 operation profit still grew by 28 percent.
Figure 1: Growth in Operational Profit of Indonesian
General Banking. Source: Indonesian Banking Statistics,
OJK, (2017).
89 259
114 715
131 555
143 761
133 198
136 311
16,8%
28,5%
14,7%
9,3%
-7,3%
2,3%
-10,0%
0,0%
10,0%
20,0%
30,0%
40,0%
-
50 000
100 000
150 000
200 000
2011 2012 2013 2014 2015 2016
Operational Profit Growth
Kristianto, B. and Hendrawan, R.
Indonesian Listed Bank Efficiency in 2008 – 2017 using Data Envelopment Analysis (DEA).
DOI: 10.5220/0008427500550064
In Proceedings of the 2nd International Conference on Inclusive Business in the Changing World (ICIB 2019), pages 55-64
ISBN: 978-989-758-408-4
Copyright
c
2020 by SCITEPRESS – Science and Technology Publications, Lda. All rights reserved
55

Figure 2: Growth of Indonesian General Banking Assets.
Source: Indonesian Banking Statistics, OJK, (2017).
In 2013 operational profit grew 14.7 percent, not as
much as the previous year, even in subsequent years,
growth has narrowed, 2015 -7.3% and 2016 only
2.3%.
While if we look at graph two the growth of
general banking assets in Indonesia, seen from
conventional banking assets, the amount of assets
from year to year is still growing. Growth still
ranges from 8.6% to 16%. From this, it shows that
the phenomenon of assets is getting bigger, but when
compared, the operational profit does not grow in
line with the growth of assets. This phenomenon
needs to be observed, whether this is a sign of the
poor performance of banking efficiency in
Indonesia.
Because the presence and function of banking in
Indonesia both for the public, large, medium or
lower industries has a very significant role and
influence, it is essential to pay attention to bank
financial performance, where good bank
performance can lead to public trust and vice versa.
For this reason, it is necessary to research bank
performance or efficiency in Indonesia. When
efficiency measurements are taken, banks are faced
with the condition of obtaining the level of optimal
output with the existing level of input or getting a
minimum level of input with a level of certain
output. Based on ownership, banks in Indonesia can
be divided into several types, including government
/ state-owned banks such as Bank Negara Indonesia,
Bank Mandiri, Bank Rakyat Indonesia, and Bank
Tabungan Negara, regional government-owned
banks such as BPD Jawa Barat, BPD Jawa Timur,
national private-owned banks such as BCA, Bank
Bukopin, Bank Mega etc., .Also, finally the mixed-
owned national-private and foreign banks, for
example, Bank CIMB Niaga, Maybank BII Bank,
OCBC NISP, QNB Indonesia Bank, Bank UOB
Indonesia, and others. With the existence of several
types of ownership, it is also necessary to conduct
efficiency comparison research on each type of bank
ownership type and compare between them.
Based on the description of the phenomena and,
authors intend to conduct a study of how the
financial performance of the banking industry that is
listed on the Indonesia Stock Exchange, where
currently there are 43 registered banking companies
using the method Data Envelopment Analysis using
secondary data from Indonesian Banking in the
Indonesian stock market during the period of 2008-
2017. The researchers intend to use DEA as a data
analysis method to measure the performance of the
banking industry listed on the Indonesia Stock
Exchange because this method uses frontier
approach, where this approach identifies and
investigates in the area of research objects, which
objects are considered to have the best performance
in the sample studied. The best performing objects
are called frontier. Moreover, other objects that are
not on the frontier are considered relatively
inefficient compared to the best performing objects
or have efficiency equal to one (Paradi et al., 2018).
In the method, Data Envelopment Analysis need
input and output variables to measure the efficiency
of the Decision Making Unit (DMU) where in this
case each bank studied is a DMU of this study. Input
and output variables selected must have an
attachment with the phenomenon underlying this
research. The phenomenon of increasing total assets
that are not followed by the significant growth of
operating income can be further detailed to get the
variables for this study. Assets, in this case, consist
of several things including fixed assets or assets
which are long-term company properties that are
used to support the company's operations in
generating income. Other parts of a bank's assets are
current assets which include loans which in this case
are loans to borrowers who agree on returns and
interest and investment which is a long-term
investment from banks to third parties such as
securities. The amount of funding sources influences
operating income in this case, for example, deposits
which are the inclusion of funds from the
community in various types of savings, also
influenced by personal costs which include salaries
and honorariums for workers who turn the bank's
operational wheels. This operating income is also
obtained by one of them from net interest income,
which is the net income of revenue generated from
assets (loans and investments) minus the obligation
to pay interest from the deposit.
3 652 832
4 262 587
4 954 467
5 615 150
6 095 908
6 729 799
21,4%
16,7%
16,2%
13,3%
8,6%
10,4%
0,0%
5,0%
10,0%
15,0%
20,0%
25,0%
-
1 000 000
2 000 000
3 000 000
4 000 000
5 000 000
6 000 000
7 000 000
8 000 000
2011 2012 2013 2014 2015 2016
Total Asset Growth
ICIB 2019 - The 2nd International Conference on Inclusive Business in the Changing World
56

From the description above, it can be one of the
bases for selecting the three input variables Fixed
Asset, Personal Cost, Deposit and Net Interest
Income, Investment, Loan as output variables that
will be used to calculate efficiency as a picture of
the performance of banks listed on the Indonesia
Stock Exchange. This selection also will be
strengthened by previous research which will be
described in the next section.
In the annual banking financial report, there are
reports on the performance ratio of banks, where
some of these ratios also relate to variables inputs
and outputs which will be used to calculate the value
of efficiency of Indonesian banking. Examples of
performance ratios used are Return on Assets (ROA)
where this ratio also relates to assets which are one
of the input variables, and then there are operational
costs to operating income (BOPO) where this ratio is
also related to the personal cost which is part of the
cost operational. The other ratio is a loan to deposit
(LDR) which is closely related to the input variable
deposit and output variable loan. Two other ratios
are return on equity (ROE) and net interest margin
(NIM) which are related to the output variable of net
interest income.
Therefore, based on above background and
previous research , it is necessary to do measurement
of Indonesian listed banking using DEA method and
conduct a correlation analysis between the value of
banking efficiency calculated using the DEA method
and five performance ratios that are in the banking
financial statements and the correlation between the
efficiency value and the size of the bank represented
by the total asset value.
2 PREVIOUS EFFICIENCY
RESEARCH
Previous studies supporting this research are as
follows:
A research of Indonesian Listed Banking
Efficiency using Stochastic Frontier Analysis
conducted by Hendrawan and Azhar (2018), with
ten years period between 2008 – 2017 and 21 sample
banks gave a result that Bank Rakyat Indonesia is
the most efficient bank and overall listed Indonesian
banking sector is still not efficient. This research use
price of funds-price of labor and price of physical
capital as the input variables and output variables are
total loans, net non-interest income, and securities.
Saha, and Yeok (2018) conducted a study
entitled branches of efficiency of banks branches
aimed at empirically assessing the efficiency of
major bank branches in Malaysia and the parameters
that control them, the number of branches measured
by 247 branch banks in 2014. The method used is
Data Envelopment Analysis to analyze the
efficiency of the bank branches using inputs interest
expenses, personal expenses, establishment
expenses, other operating expenses, and outputs total
deposits, total loans, wealth portfolio management,
Interest income, and non-interest income. After
conducting an efficiency analysis of branch banks
with the DEA method, followed by approach
fractional regression to access the possible factors
that control the efficiency of the branch banks. The
results of the study indicate that branch banks
operating in high concentrate branch banks
relatively more efficient, and the economic
conditions in the branch bank area are in control of
the efficiency of the branch bank. The limitations of
this study are only carried out within a period of one
year, according to researchers, further research will
provide better research if carried out within a period
of 3 to 5 years.
DEA method can be used to measure efficiency
many industry sectors not only banking, such as
research by Hendrawan and Nugroho (2018), that
measure and compare the efficiency of South East
telecommunication industry. This research measure
14 telco operators in five South East Asia countries
between 2008 until 2017 using inputs capital
expenditure, operating expenses, total asset and
outputs revenue, number of subscribers, and ARPU.
These research findings are Telkomsel was the most
efficient operator, and that annual revenue value still
grew 6.08% even with ARPU declined -4.43%.
Gulati and Kumar (2017) conducted a study
entitled Analysing banks' intermediation and
operating efficiencies using the two-stage DEA
network model: The case of India; aims to make an
approach holistic in measuring overall efficiency in
terms of intermediation and operational efficiency,
the number of banks measured is 46 banks in the
period 2011 to 2013. The method used is Data
Envelopment Analysis with input fixed assets,
number of employees, and loan funds, while
advance output and investment for stage 1 which is
the input for stage2 while stage 2 has net-interest
income and noninterest income. The results of the
study show that variations in efficiency
intermediation are influenced by bank size factors,
liquidity, loans, and intermediation cost while
differences in operation efficiency between banks
influenced by profitability and diversification of
income.
Indonesian Listed Bank Efficiency in 2008 – 2017 using Data Envelopment Analysis (DEA)
57

Khan, Samsudin, Islam (2017), conducted an
efficiency analysis of banks in Southeast Asia,
namely 61 banks in Indonesia, Malaysia, Philippines
and Thailand during the period 1998 to 2012, using
the Data Envelopment Analysis method, an
intermediation approach with input variables fixed
assets, deposits, personal expenses, and output
variables are net loans and other earnings assets. The
results of this study empirically indicate that banking
efficiency in these four countries has shown
improvement. After being hit by the global crisis in
2007 and 2008, it shows that Malaysia and Thailand
were not too affected by the crisis, and Indonesia
needed a better transformation.
Determinants of bank technical efficiency:
Evidence from rural and community banks in
Ghana, by Michael Adusei (2016), aims to calculate
Rural bank efficiency in Ghana, the number of banks
measured is 101 banks. The method used is Data
Envelopment Analysis with input Deposit and
Shareholder Equity, while output Loans, Investment,
and Profit before interest and tax. The results
showed that only 20 of the 101 rural banks in Ghana
were technically efficient, where efficiency was
influenced by bank size, profitability and the quality
of bank funding. Increasing the size and quality of
rural bank funding resulted in a technical decline in
efficiency while increasing profitability improved its
technical efficiency.
Wong and Deng (2016) with the title of their
research efficiency analysis of banks in ASEAN
countries, aims to explore various aspects of
efficiency from banks in the countries incorporated
in ASEAN, in connection with the high economic
growth in these countries at the time the research
was conducted. The numbers of banks in this study
were 39 banks in the period 2000 to 2010. The
method used was Data Envelopment Analysis with
intermediation approach where the input used was
the total cost, where the total cost included expenses
in terms of employee salaries, equipment, and
physical capital such as land, buildings, and others.
Meanwhile, the output chosen is the total loan
amount, total deposit amount, and total investment.
The results showed that first, banks in Malaysia
were more efficient than the other three ASEAN
countries studied. Second, large-scale banks in
ASEAN are less efficient. Three, state banks in
ASEAN showed increased efficiency during the
study year compared to private banks.
Shahwan and Hassan (2013) with their research
entitled Efficiency analysis of UAE banks using data
envelopment analysis, aims to measure profitability,
marketability and bank social disclosure efficiency
in the UAE, the number of banks measured by 20
banks in 2009. The method used is Data
Envelopment Analysis with the input of total
deposits, total operating expenses, and leverage and
output variables are return on assets (ROA) and
return on equity (ROE). The results also showed
additional evidence of a positive correlation between
the performance of social activities and performance
profitability.
Al-Farisi and Hendrawan (2010) compare bank
efficiency between conventional and sharia bank in
Indonesia using sample 3 sharia banks and 102
conventional banks during 2002 – 2007 period. The
study used pooled leased square and alternative
profit efficiency model, and the findings are that
channeled credit has a positive effect, marketable
securities and labor cost have a negative effect on
efficiency. Another result also shows that the three
Islamic banks are within 21 of the most efficient
banks.
Fadzlan Sufian (2007) conducted a study entitled
Trends in the efficiency of Singapore's commercial
banking groups: A non-stochastic frontier DEA
window analysis approach, research was conducted
on nine banks in Singapore with the method
Window Analysis DEA, during the period 1993 to
2003. The results of banking efficiency are then
analyzed by the level of correlation with the
calculation of traditional banking performance such
as the Log of Total Assets, Log of Total Loans, and
Log of Total Deposits. The results of this study are
that during the overall research period Singapore's
banking efficiency experienced a downward trend in
the initial research period and increased dramatically
at the end of the study period. This study also shows
that banks with smaller assets tend to be more
efficient than banks that have significant assets.
3 DATA AND RESEARCH
METHODOLOGY
In this research, the observation period was carried
out during the years 2008 to 2017 with the number
of bank samples as many as 34 conventional banks
in Indonesia. Input variables are fixed assets,
personal cost, and deposit. While the output
variables used are net interest income, investment,
and loan.
The method used to measure the efficiency of
Indonesian banking is Data Envelopment Analysis.
The following is the general equation of the DEA
method:
ICIB 2019 - The 2nd International Conference on Inclusive Business in the Changing World
58

=
=
=
n
j
jsjs
m
i
isis
xv
yu
hs
1
1
(1)
Where hs, it shows the bank's technical
efficiency; uis shows the weight of the output i
produced by the bank ; yis is the amount of output i
produced by the bank s; vjs is the weight of input j
given by the bank ; and xjs is the amount of input j
used by the bank s; i calculated from 1 to m and j is
calculated from 1 to n. The efficiency ratio (hs) is
then maximized with the following constraints:
1
1
1
=
=
n
j
jrj
m
i
iri
xv
yu
for r = 1,….,N ; ui and vj≥ 0 (2)
where N indicates the number of banks in the
sample. The first inequality shows that there is no
more than 1 efficiency ratio for other DMUs, while
the second inequality is positively weighted. Ratio
numbers will vary between 0 to 1, where DMU has
an efficient number 1 (100%) and if approaching 0 is
increasingly inefficient.
For the DEA model the BCC, the equation
mathematical formula:
Max.
=
=
m
i
isis yuh
1
+ U0
st.
=
m
i
iriyu
1
-
=
m
j
jrjxv
1
≤ 0 ; r = 1,….,N (3)
=
m
j
jsjxv
1
= 1
ui, vj ≥ 0
where U0 is a piece that can be positive or negative.
The results of processing the data will be
analysed to see the performance and efficiency of
the banks listed on the IDX, seen the trend and
compared between banks. The results of the
calculation of efficiency of each bank are grouped
based on the type of bank ownership and then
calculated by the average bank efficiency throughout
the period. Then the graph is made so that trend
analysis can be carried out, also comparing
efficiency between bank ownership types. From the
results of DEA calculations can also be seen the
variables that cause inefficiency by comparing the
value of inefficient bank variables with banks in the
frontier nearest efficiency, then this result is
analyzed to find which variables need to be
optimized or changed. Then the next step is measure
coefficient Pearson correlation and Spearman
correlation between each efficiency to bank
performance and size ratios. Furthermore, from the
12 pairs of correlations, the correlation strength is
observed, and calculate the value of p-value to see if
there is a correlation between the two variables.
4 RESULT AND DISCUSSION
From table 1, it shows that banks listed on the
Indonesian stock exchange which have the best
relative average efficiency value is Bank Rakyat
Indonesia (BRI) with a value of 0.991, this result
strengthens previous research finding, which was
using SFA method, by Hendrawan (2018) that BRI
is the most effective bank. After BRI another more
relatively efficient banks are Bank Victoria
International with a value of 0.990, Bank Tabungan
Negara with a value of 0.985, Bank Mestika Dharma
with a value of 0.985, Bank Nationalnobu with a
value of 0.980, BPD Jawa Timur with a value of
0.975, and the bank BTPN with a value of 0.969.
Furthermore, banks with low efficiency below 0.75
are Maspion Bank, Bank Mitraniaga, Bank Ganesha
and Bank Harda Internasional. Of the 34 banks
studied, 14 banks were below the overall efficiency
average of the bank during the 10-year study period,
and 20 banks were above the average, either using
the method input oriented or using output oriented.
With an average of 0.887 means the method input
oriented, Indonesian banks still have inefficiencies
of 11.3%, and in the method, output-oriented the
average efficiency is 0.892, which means that
Indonesian banks have 10.8% inefficiency. Area
improvement for input oriented is the highest BRI
efficiency value (0.991) minus the average value of
banking efficiency (0.887) which is equal to 0.104
while the area improvement for output oriented is
the highest BRI efficiency value (0.992) minus the
average value of banking efficiency (0.892) which is
equal to 0.1.
Indonesian Listed Bank Efficiency in 2008 – 2017 using Data Envelopment Analysis (DEA)
59

Table 1: Average Efficiency Score.
Bank Name
Owner
Average
Input
Oriented
Efficiency
Average
Output
Oriented
Efficiency
Bank Rakyat
Indonesia
State-
Owned
0.991
0.992
Bank Victoria
International
Mixed
Private
0.99
0.99
Bank Tabungan
Negara
State-
Owned
0.985
0.986
Bank Mestika
Dharma
National
Private
0.985
0.986
Bank
Nationalnobu
Mixed
Private
0.98
0.985
BPD Jatim
Regiona
l State-
Owned
0.975
0.975
Bank Tabungan
Pensiunan
Nasional
Mixed
Private
0.969
0.969
Bank Danamon
Indonesia
Mixed
Private
0.963
0.964
Bank Mandiri
State-
Owned
0.956
0.959
Bank Cimb
Niaga
Mixed
Private
0.944
0.946
BPD Jabar &
Banten
Regiona
l State-
Owned
0.938
0.939
Bank Negara
Indonesia
State-
Owned
0.933
0.935
Bank Permata
Mixed
Private
0.93
0.932
Bank OCBC
NISP
Mixed
Private
0.922
0.924
Bank Central
Asia
National
Private
0.915
0.918
Bank Ina
Perdana
Mixed
Private
0.914
0.907
Bank Capital
Indonesia
National
Private
0.905
0.911
Bank of India
Indonesia
Mixed
Private
0.905
0.907
Bank Mega
National
Private
0.899
0.903
Bank Maybank
Indonesia
Mixed
Private
0.889
0.892
Bank Agris
National
Private
0.874
0.882
Bank Bukopin
National
Private
0.873
0.875
Bank Nusantara
parahyangan
Mixed
Private
0.868
0.87
Bank Sinarmas
National
Private
0.86
0.862
Bank Mayapada
International
Mixed
Private
0.852
0.856
Bri Agroniaga
National
Private
0.852
0.861
Bank MNC
Internasional
National
Private
0.834
0.842
Bank Artha
Graha
Internasional
National
Private
0.822
0.826
Bank QNB
Indonesia
Mixed
Private
0.812
0.825
Bank Bumi
Artha
National
Private
0.79
0.803
Bank Maspion
Indonesia
National
Private
0.741
0.761
Bank Ganesha
Mixed
Private
0.708
0.739
Bank Harda
Internasional
National
Private
0.701
0.728
Bank
Mitraniaga
National
Private
0.667
0.691
Average
0.887
0.892
In the DEA method, the highest relative efficient
value is the efficiency value 1, and from the 340
DMU efficiency result, this study investigates how
consistent a bank to be efficient, that is by looking at
the frequency of the bank achieves efficiency scores
1. It appears that banks which most often get
efficiency scores 1 are Bank Rakyat Indonesia and
Bank Nationalnobu which have a maximum
efficiency score of 8 years from 10 years of
observation, so those two banks can be regarded as
the most consistent banks that operating efficiently.
The next banks that are quite consistent with
efficiency score 1 are Bank Mandiri 7 times, Bank
Tabungan Negara 6 times and two banks as much as
five times, the Bank Tabungan Pensiunan Nasional
and Bank Victoria International. From this, it shows
that 3 of the six banks that are most consistent in the
frontier efficiency are state-owned banks. The total
banks that have been at the highest efficiency value
are 21 banks (62%) of the 34 banks studied, and 13
banks never have efficiency value 1.
From figure 3 it shows that the average
efficiency based on input oriented and output-
oriented is not differ significantly, and in a trend, the
average Indonesian banking efficiency had grown
since 2008 from 0.818 to 0.91 in 2017. In the two
years beginning in 2008 and 2009 the efficiency of
Indonesian banking during the global crisis was seen
to be the lowest in 10 years of research, began to
increase in 2010 to 2013, and after that was quite
stable until 2017. This result shows that Indonesian
banks managed to rise from the global crisis
gradually and showed that Indonesian banking
efficiency was stable in the last five years of the
study period (2013 to by 2017).
ICIB 2019 - The 2nd International Conference on Inclusive Business in the Changing World
60
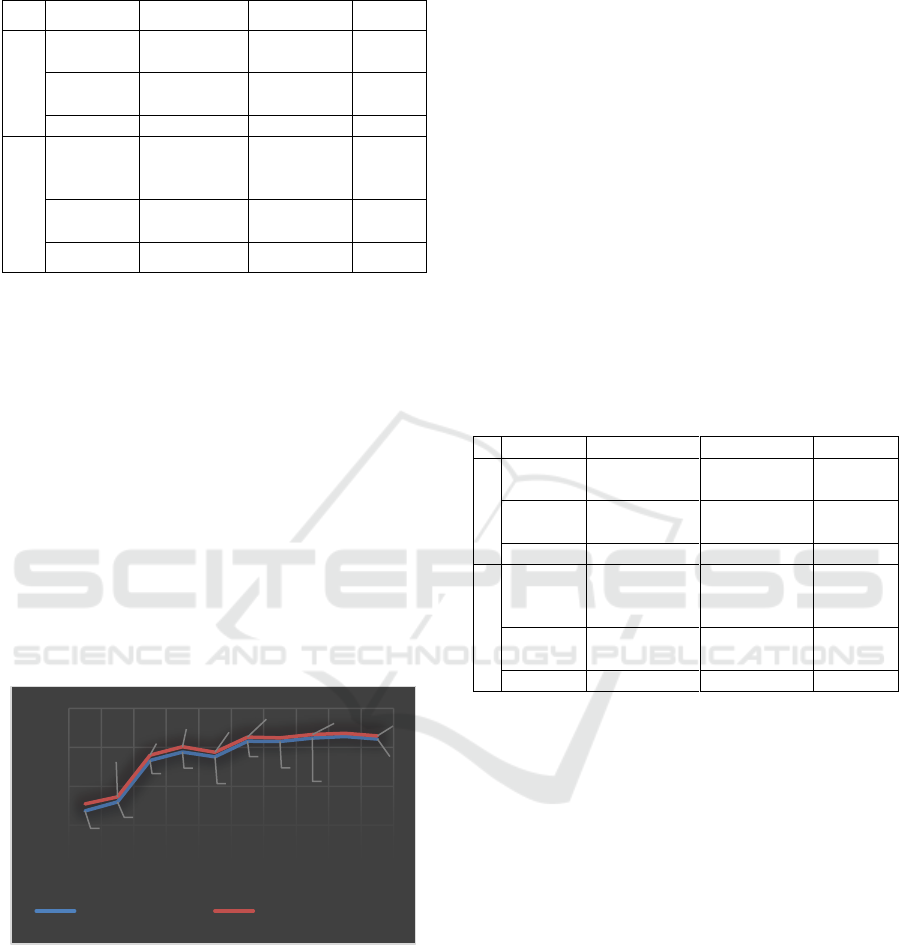
Table 2: Summary Projection Variable Input Oriented.
From the previous results it can be seen that
there are still inefficiencies in the operation of
Indonesian banking, in order to achieve desired
efficiency values it is necessary to change variables
input or output, in the Input Oriented method, the
emphasis is prioritized to reduce inputs to obtain
efficient results. This change in input or output is
carried out by looking at the reference of an efficient
bank.
From table 3, using input-oriented, banking
sector needs to optimize the variable of fixed assets
which is quite significant, by 12.17%, besides that it
needs to decrease input the personnel cost by 5.84%
and optimization of third-party funds by 4.86%. Not
only changes in input, but also need to do a little
change in output as mentioned in table 3.
Figure 3: Average efficiency of 2008 to 2017.
Fixed assets are large enough to contribute to
inefficiencies because these inputs cannot always
contribute optimally in producing output.
Efficient banks that used as references are
different for each bank, in this input oriented, the
most widely used banks as reference are the Bank
Tabungan Negara 184 times, then Bank QNB
Indonesia 136 times, Bank Agris 132 times, Bank
Ina Perdana 119 times, Bank CIMB Niaga 97 times
and Bank Rakyat Indonesia 92 times.
Using the output-oriented method, changes
needed to achieve efficient values are emphasized by
increasing variables output, as shown in table 3
below.
From the table 3 shows that the method Output
oriented need to do a significant optimization of
fixed asset variables, by 8%, besides needing to
increase output Net Interest income by 5.44%,
investment by 5.64% and loans by 5.32%. Not only
changes in output and optimization of fixed assets
but also need to be made a little change in other
inputs mentioned in table 4. Fixed assets are large
enough to contribute to inefficiencies because these
inputs cannot always contribute optimally in
producing output.
Table 3: Summary Projection Variable Output
Oriented.
Variable
Current
Projection
Changes
Input
Fixed
Asset
874,937
768,492
-12.17%
Personn
el Cost
486,417
458,005
-5.84%
Deposit
25,440,456
24,204,164
-4.85%
Output
Net
Interest
Income
1,708,208
1,722,576
0.84%
Invest-
ment
8,783,933
8,864,670
0.92%
Loan
20,951,668
21,069,052
0.56%
Efficient banks that are used as references are
different for each bank, in this output oriented, the
most widely used bank as a reference is Bank
Tabungan Negara 188 times, then the QNB Bank
Indonesia 140 times, Bank Agris 117 times, Bank
Ina Perdana 115 times, Bank CIMB Niaga 100 times
and Bank Rakyat Indonesia 101 times.
From the results of banking efficiency research
listed on the Indonesian stock exchange, then
efficiency by the groupings of ownership can be
seen in table 4. From the results of these studies, it
shows that Government Banks are relatively more
efficient than other banks. This is because the
community dominantly trusts the government banks
because they have been operating longer, have
extensive networks, supported by the government,
synergized with other BUMNs and have far greater
assets. The results of this study are aligned with the
research from Wong and Deng (2016) where the
results show that state banks in ASEAN showed
increased efficiency during the study period
0,818
0,830
0,883
0,894
0,888
0,908
0,908
0,912
0,914
0,911
0,827
0,836
0,890
0,901
0,894
0,913
0,912
0,916
0,918
0,915
0,750
0,800
0,850
0,900
0,950
2008 2009 2010 2011 2012 2013 2014 2015 2016 2017
Avg Input Oriented Eff Avg Output Oriented Eff
Variable
Current
Projection
Changes
Input
Fixed
Asset
874,937
804,971
-8.00%
Personnel
Cost
486,417
478,888
-1.55%
Deposit
25,440,456
25,353,247
-0.34%
Output
Net
Interest
Income
1,708,208
1,801,138
5.44%
Invest-
ment
8,783,933
9,279,640
5.64%
Loan
20,951,668
22,066,642
5.32%
Indonesian Listed Bank Efficiency in 2008 – 2017 using Data Envelopment Analysis (DEA)
61
compared to private banks. Government banks that
have the highest efficiency value are Bank BRI with
efficiency values of oriented input 0.991 and 0.992
output oriented so that the area improvement of
government bank is 0.025 (maximum value minus
average value) for oriented inputs and 0.024 for
output oriented.
Local government banks that have an efficiency
of 0.96 are also more efficient than the average
banking efficiency listed on the exchange, which is
0.89. This is because local governments support
local government banks in synergy with other
companies belonging to the provincial government.
The regional government bank with the highest
efficiency value is BPD Jawa Timur with an
efficiency value of 0.975 for input oriented or output
oriented, the area of improvement of regional
government banks is 0.019 for input oriented and
0.018 for output oriented.
Table 4: Average efficiency based on bank ownership.
Bank Based on
Ownership
Average
efficiency
(input
oriented)
Average
efficiency
(output
oriented)
State-Owned
0.966
0.968
Local Government
0.956
0.957
National Private &
Foreign (Mixed)
0.903
0.908
National Private
0.837
0.846
Indonesian Banking
0.887
0.892
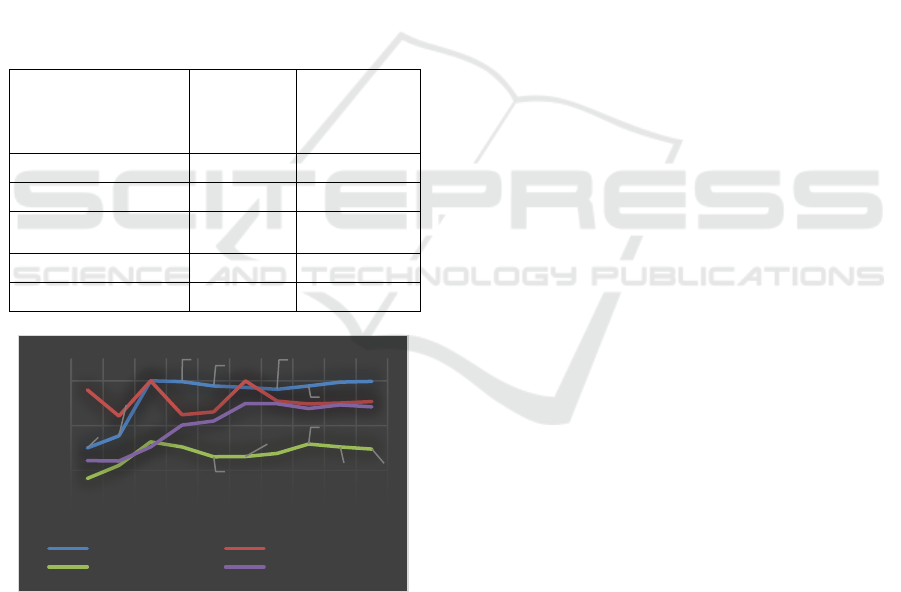
Figure 4: Average efficiency based on ownership.
Banks that are owned by National and Foreign
Private have an average efficiency of 0.9, which is
relatively higher than average and higher than
national private-owned banks, this indicates that
when foreign parties acquire private banks and there
is foreigners management interference, the tendency
to have better efficiency compared to banks that are
only owned by the national private sector. Mixed
banks of the national and foreign private sector with
the highest efficiency value are Bank Victoria
International with a value of 0.99 for input and
output oriented so that the improvement area for
national and foreign private mixed banks is 0.087 for
input oriented and 0.082 for output oriented.
National private banks are the group of banks
with the lowest average efficiency, 0.837 and 0.846
lower than the average of the Indonesian banking
industry listed on the Indonesia stock exchange
0.887 and 0.892. The national private bank with the
highest efficiency value is Mestika Dharma Bank
with a value of efficiency of oriented input 0.985
and output-oriented 0.986 so that the area of
improvement of national private banks is 0.148 for
input oriented and 0.14 for output oriented.
From Figure 4, it can be seen that in 2008 only
local government banks that had an efficiency of
close to 1, other banks were affected by the 2008
crisis, and gradually improved their efficiency. The
group of regional government banks was not too
affected by the 2008 crisis because they did not
invest much in foreign investment. In 2010, state-
owned banks became the most effective and
relatively stable bank group until the end of the
study period, which is 2017. Local government
banks appear to have fluctuating efficiency, although
always above the average, in 2008 and 2013 even
local government banks have the best efficiency
compared to other bank groups. National private
banks and foreign national private mixed banks do
not differ significantly in the value of their
efficiency from 2008 to 2010, after that the group of
foreign national private mix banks increased their
efficiency and were stable from 2013 to 2017.
Meanwhile, the national private bank group from
2011 to 2017 are in the range of average efficiency
values of 0.83 to 0.85 which is the lowest efficiency
value compared to other groups.
The results of data processing by looking for the
Pearson coefficient and Spearman coefficient
correlation between input-oriented efficiency
variables with DEA method and financial
performance ratio variables can be seen in table 5.
The p-value value of all correlation
measurements is obtained p-value <0.001, meaning
that there is a correlation between all the pairs of
variables tested. It is noticeable also that in general
there is a correlation with the level of low relation
between the efficiency of banking with a ratio of
financial performance as ROA and BOPO are using
the Pearson coefficient, ROE, NIM and LDR with
Pearson and Spearman. Only ROA and ROA using
0,850
0,877
1,000
0,998
0,989
0,986
0,981
0,988
0,997
0,999
0,782
0,812
0,864
0,853
0,831
0,831
0,838
0,859
0,853
0,848
0,700
0,800
0,900
1,000
2008 2009 2010 2011 2012 2013 2014 2015 2016 2017
State-owned Local Govenrment
National Private Mixed Private
ICIB 2019 - The 2nd International Conference on Inclusive Business in the Changing World
62

Spearman coefficient have a moderate level of
relationship. The correlation results are low because
the financial performance ratio only uses a
comparison of variables in the bank's financial
statements, so it only compares within itself.
Table 5: Correlation coefficient between Efficiency and
Performance Ratio.
Input
Oriented
Efficiency
Output
Oriented
Efficiency
Return On Asset (ROA)
Pearson Coefficient
0.344
0.342
Spearman Coefficient
0.452
0.449
Return On Equity (ROE)
Pearson Coefficient
0.31
0.307
Spearman Coefficient
0.371
0.365
Net Interest Margin (NIM)
Pearson Coefficient
0.266
0.267
Spearman Coefficient
0.233
0.234
BOPO
Pearson Coefficient
-0.236
-0.236
Spearman Coefficient
-0.467
-0.465
Loan to Deposit Ratio (LDR)
Pearson Coefficient
0.256
0.251
Spearman Coefficient
0.261
0.26
Total Asset
Pearson Coefficient
0.338
0.341
Spearman Coefficient
0.463
0.46
While the level of efficiency using the DEA method
is a relative comparison to the efficiency of other
banks in one group of research objects. These results
reinforce the statement that DEA measures the
relative efficiency of various organizational units
that can reveal the right relationship between inputs
and outputs diverse, which previously could not
accommodate through traditional ratio analysis.
From table 5 it is also seen that there is no
correlation with a high level of relationship between
total assets owned by banks with the value of
efficiency in either input oriented or output oriented.
The results of research show on the level of
efficiency that there are several banks whose asset
values are far below the average of total banking
assets but have been the most efficient banks, for
example, Bank Nationalnobu, Bank Victoria
International, Bank Ina Perdana, and Bank Mestika
Dharma. These banks have been at the frontier of
efficiency for at least four years, but in a positive
relationship, it seems that many banks with
substantial assets often have better efficiency. This
result is inversely proportional to the results of the
study from Sufian (2007) where banks in Singapore
which have smaller assets tend to be more efficient
than banks that have more considerable total assets.
5 CONCLUSIONS
Based on the data from the research and analysis of
the calculation of the efficiency value using the
DEA VRS method of input oriented and output
oriented, the conclusions that can be obtained by
researchers are as follows:
From the 34 banks listed on the Indonesia Stock
Exchange, with a period of efficiency comparison
research using the Data Envelopment Analysis
method, Variable Return to Scale, Input Oriented
and Output Oriented, it shows that Bank Rakyat
Indonesia is the most efficient bank with an average
efficiency value 0.99 using either input oriented or
output oriented. Bank Rakyat Indonesia is also the
most consistent bank, as seen from the frequent
showing of efficiency 1 with Bank Nationalnobu as
much as eight years of the observation period. In
general, Indonesian banks seem to experience
improved efficiency and show a stable value from
2013 to 2017. This result also shows that no
significant differences between input oriented or
output oriented so that the next research can choose
one of them.
In order listed Indonesian banking sector to
achieve efficient conditions, using input oriented or
output oriented, it is seen that fixed asset is the most
significant variables that need to be optimized, there
are gaps 12,17 % which is not optimal based on
input oriented and needs to be optimized by 8%
based on output oriented.
Based on the comparison of banking efficiency
grouped by type of ownership, it shows that state-
owned banks are the most efficient group of banks
followed by regional government-owned banks and
banks belonging to a mixture of national and foreign
private banks, the latter being national privately-
owned banks.
Correlation analysis results show that there is a
correlation with the level of relations that are
relatively low to moderate between the value of
banking efficiency using the DEA method and the
performance ratios contained in banking financial
statements such as ROA, ROE, NIM, BOPO, LDR,
and total assets.
Indonesian Listed Bank Efficiency in 2008 – 2017 using Data Envelopment Analysis (DEA)
63

Based on this study, advise for the banking
sector are Increasing efficiency can be done by
reducing or optimizing input variables and
increasing output variables, or a combination of
both. In order to improve its efficiency, banks can
use other banks that have maximum efficiency
values as a reference, for example, Bank Rakyat
Indonesia and Bank Tabungan Negara for large
banks or Victoria banks and QNB banks for
relatively small banks. Small-scale National Private
Banks can merge with other National Private banks
to increase efficiency, or by mergers or acquisitions
with foreign banks. Banking also needs to do a
benchmark with other banks rather than only rely on
their financial performance ratio to understand their
efficiency level.
REFERENCES
Adusei, M., 2016, Determinants of bank technical
efficiency: Evidence from rural and community banks
in Ghana, Cogent Business & Management 2016, 3
Al-Farisi, A. S., Hendrawan, R.. 2010. Measuring
Efficiency as Intermediation Approach Between
Conventional and Sharia Bank in Indonesia. Journal
of Finance and Banking, 14 (3), 501-508
Gulati, R., Kumar, S., 2017, Analysing banks’
intermediation and operating efficiencies using the
two-stage network DEA model: The case of India.
International Journal of Productivity and
Performance Management, Vol. 66 Issue: 4, pp.500-
516
Hendrawan, R., Nasution, A.A., 2018, Assessing Banking
Profit Efficiency Using Stochastic Frontier Analysis,
Journal of Finance and Banking Review, Vol. 3 Issue:
4, pp.67-66
Hendrawan, R., Nugroho, K.W.A., 2018,
Telecommunication Sector Reform in Southeast Asia:
A New Rationality, Global Journal of Business and
Social Science Review, Vol 6, Issue: 4, pp 147-154
Khan, S.J.M., Samsudin, S. and Islam, R., 2017 Efficiency
of banks in Southeast Asia: Indonesia, Malaysia,
Philippines, and Thailand. International Journal of
Social Economics, Vol. 44 Issue: 12, pp.2302-2312
Paradise, J.C., Sherman, H.D., and Tam, F.K., 2018, Data
Envelopment Analysis in the Financial Services
Industry, A guide for practitioners and analysts
working in Operations Research using DEA.: Springer
International Publishing AG. Cham, Switzerland
Saha, A., Hock-Eam, L., and Yeok, S.H., 2018,
Deciphering drivers of efficiency of bank branches,
International Journal of Emerging Markets, Vol. 13
Issue: 2, pp.391-409
Shahwan, T.M., Hassan, Y.M., 2013, Efficiency analysis
of UAE banks using data envelopment analysis,
Journal of Economic and Administrative Sciences,
Vol. 29 Issue: 1, pp.4-20
Sufian, F., 2007, Trends in the efficiency of Singapore's
commercial banking groups: A non-stochastic frontier
DEA window analysis approach. International
Journal of Productivity and Performance
Management, Vol. 56 Issue: 2, pp.99-136
Wong, W.P., Deng, Q., 2016, Efficiency analysis of banks
in ASEAN countries. Benchmarking: An International
Journal, Vol. 23 Issue: 7, pp.1798-181
ICIB 2019 - The 2nd International Conference on Inclusive Business in the Changing World
64
