
Spatial Model of Canopy Density in Mangrove Forest
of Percut Sei Tuan
Nurdin Sulistiyono
12*
, Khairil Amri
1
, Pindi Patana
1
, Achmad Siddik Thoha
1
1
Department of Forest Conservation, Faculty of Forestry, Universitas Sumatera Utara, Jl. Tridarma Ujung No.1 Kampus
Universitas Sumatera Utara, Medan North Sumatra 20155, Indonesia
2
Center of Excellence for Natural Resources-Based Technology, Mangrove and Bio-Resources Group,
Universitas Sumatera Utara, Medan North Sumatra 20155, Indonesia
Keywords: Canopy Density, Remote Sensing, GIS, Percut Sei Tuan, NDVI
Abstract: Information about canopy density is needed in many ways, for example, in estimating forest degradation and
forest quality. Utilization of vegetation index values on satellite imagery can be used to predict canopy density
distribution. This study aims to predict canopy density distribution in mangrove forests. The methodology
used is using regression analysis by connecting Normalized Difference Vegetation Index (NDVI) value with
canopy density values in the field. The NDVI value is derived from Landsat 8 satellite images, while the
canopy density percentage is obtained by using a camera. The spatial distribution of canopy density is obtained
through spatial modeling using Geographic Information System (GIS). The results showed that the NDVI
value of the linear regression model could be used to predict the density distribution of mangrove forest
canopy with r square value of 59.0% and sig value <0.005.
1 INTRODUCTION
Land cover changes in mangrove forest into other
land uses such as agriculture, mining, and settlement
are the causes of deforestation in secondary mangrove
forests in North Sumatra (Basyuni et al., 2018). in
another hand, the existence of mangrove ecosystems,
is very important for supporting survival in coastal
zones (Duke et al., 2007). Therefore, efforts are
needed for rehabilitating mangrove forests so that the
mangrove forests fungction can optimally.
Information about canopy cover is needed in
environmental rehabilitation planning activities
(Azizia et al., 2008), including in the mangrove
ecosystem. Canopy cover is defined as the proportion
of forest floor covered by a tree canopy projected
vertically (Jennings et al, 1999). Monitoring changes
in canopy cover is needed as an initial effort to
determine rehabilitation priority areas.
The utilization of vegetation indices on satellite
images such as NDVI can be used to predict the
spatial distribution of canopy density (Wachid et al.,
2017). This study aims to predict the spatial
distribution of mangrove forest canopy cover in
Percut Sei Tuan.
2 MATERIALS AND METHOD
2.1 Studi Area
The data collection process was carried out on the
mangrove forest landscape in Percut Sei Tuan
Subdistrict, Deli Serdang Regency, North Sumatra
Province. The geographical position of the mangrove
forest landscape in Percut Sei Tuan is located at
latitude 3.68
o
N - 3.77
o
N and at longitude 98.70
o
E -
98.83
o
E. The map of the research area can be seen in
Figure 1.
42
Sulistiyono, N., Amri, K., Patana, P. and Thoha, A.
Spatial Model of Canopy Density in Mangrove Forest of Percut Sei Tuan.
DOI: 10.5220/0008388000420045
In Proceedings of the International Conference on Natural Resources and Technology (ICONART 2019), pages 42-45
ISBN: 978-989-758-404-6
Copyright
c
2019 by SCITEPRESS – Science and Technology Publications, Lda. All rights reserved
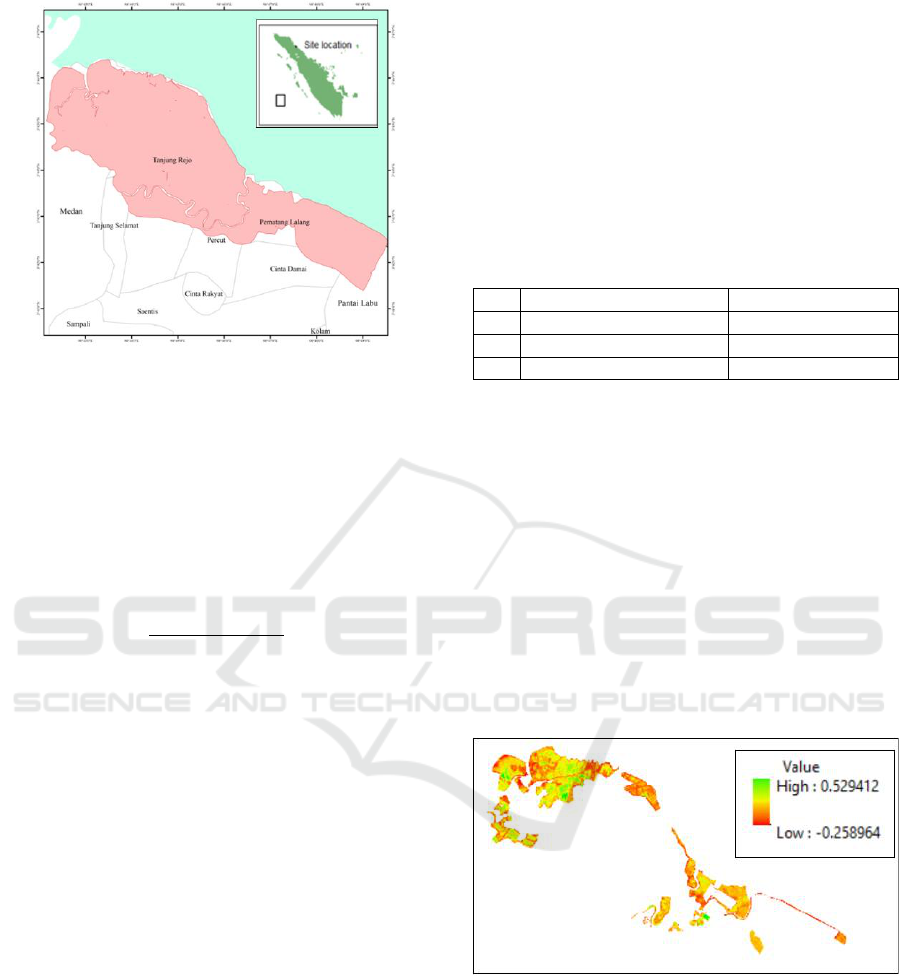
Figure 1: Site research location
2.2 Analysis of Vegetation Indices
NDVI is one of the most widely used vegetation
indices in remote sensing including estimating
canopy density. In this study NDVI values were
obtained from Landsat satellite images 8 Path / Row
129/57 recording on July 1, 2016. The NDVI formula
was calculated by equation (Rouse et al., 1973):
NDVI =
(NIR-R)
(1)
(NIR + R)
where :
NIR : Digital value in Near Infrared bands
R : Digital value in the Red band
2.3 Analysis of Canopy Density
Measurement of canopy density in the reseach
location is conducted through photographing canopy
density from the bottom at the center point of a
30x30m sized plot. Furthermore, canopy density
photos are processed using the canopy cover free
android application to get the value of the canopy
density percentage.
Estimation of canopy density distribution is done
by regressing 30 plots of value data on canopy cover
measurements in the field with NDVI values on
landsat satellite images 8. The ordinary least square
regression equation model used in this study is:
Linear:
Y = a + bx
(2)
Exponential:
y = a exp
bx
(3)
Information :
Y : canopy density (%)
x : NDVI
a, b : constanta
The classification of canopy density criteria in this
study refers to Departemen Kehutanan (2005). Criteria
for canopy density classification can be seen in table
1.
Table 1: Criteria for canopy density classification
No
Criteria
Score
1
Low canopy density
< 50 %
2
Medium canopy density
50 – 69 %
3
High canopy density
> 70 %
3 RESULT AND DISCUSSION
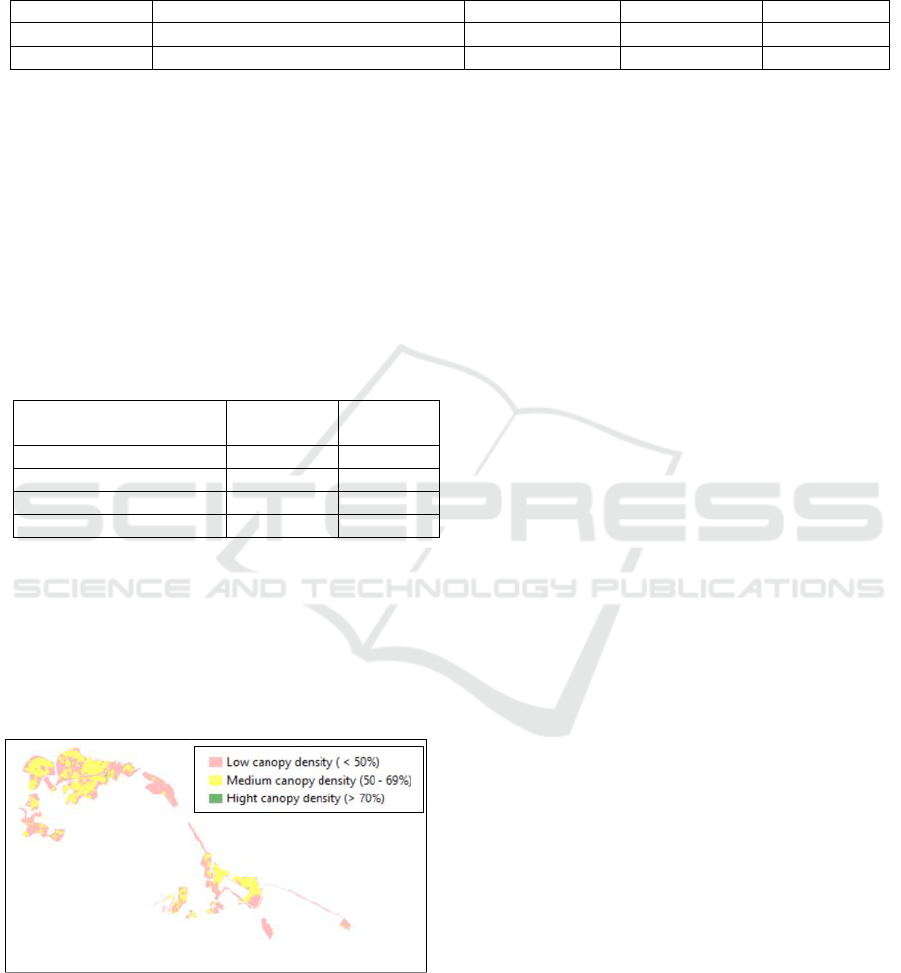
3.1 Distribution of NDVI
Based on NDVI analysis using landsat 8 satellite
imagery in 2016, mangrove forest cover has a
minimum NDVI value range of -0.259 and a
maximum NDVI value of 0.529 (Figure 2). The
greater the NDVI value indicates the closure of
vegetation cover, on the contrary the smaller the
NDVI value shows that vegetation cover is
increasingly rare (Sulistiyono et al., 2018).
Figure 2: Spatial distribution of NDVI in mangrove forest
in Percut Sei Tuan
3.2 Model Prediction of Canopy Density
The results of statistical tests that describe the
relationship between canopy density and NDVI can
be seen in table 1. The ANOVA (analysis of variance)
test results on the two regression models
tested, obtained information that the NDVI value can
be used to predict canopy density (sig ANOVA
<0.05). Based on the determination coefficient value
(R square), the best canopy density estimator model
Spatial Model of Canopy Density in Mangrove Forest of Percut Sei Tuan
43
is a linear model with an R square value of 59%. The
results of this study are relatively similar when
compared with the results of the Wachid et al (2017)
study which produced an r square value of 59.89% in
mangrove vegetation in Teluk Jor.
Table 1: Result of statistical models using OLS regression
Model
Regression
Sig ANOVA
R square
R
Linear
y = - 0.457 + 13.862 NDVI
0.000
0.590
0.768
Exponential
y = 50.881 e
11.983 NDVI
0.000
0.451
0.671
Based on the selected linear regression model, the
area and percentage of canopy density in each class
can be seen in table 2. The low canopy density class
is 606.80 ha (57.8%), while the high canopy density
class is only 2.25 ha (0.21%). This indicates that the
landscape of the mangrove forest in Percut Sei Tuan
is dominated by vegetation with a low canopy
density. This can also be an indication that the level
of disturbance to the mangrove vegetation in Percut
Sei Tuan is quite high.
Table 2: Class canopy density in mangrove forest Percut Sei
Tuan
Class of canopy density
Area
(ha)
Percentage
(%)
Low canopy density
606.80
57.80
Medium canopy density
440.86
41.99
High canopy density
2.25
0.21
Total
1,049.91
100.00
The spatial distribution of canopy density in the
mangrove forest landscape of Percut Sei Tuan can be
seen in Figure 3. The distribution of the class of low
density canopy (pink color) is distributed along the
outer land line dominated by Avicennia sp. Low
density canopy classes are also widely seen in former
pond areas.
Figure 3: Spatial distribution of canopy density class in
mangrove forest in Percut Sei Tuan
4 CONCLUSIONS
The result showed that NDVI approaches can
estimate the forest canopy cover with r
square value
59.0 %. Low canopy density (57.8%) is majority
canopy density in mangrove forest of Percut Sei
Tuan.
ACKNOWLEDGEMENTS
This study was partly supported by a TALENTA
Grant 2017 (No. 104/UN5.2.3.1/PPM/KP-
TALENTA USU/2017) from Sumatera Utara
University.
REFERENCES
Azizi, Z., Najafi, A., Sohrabi, H. 2017. Forest canopy
density estimating, using satellite images. The
International Archives of the Photogrammetry, Remote
Sensing and Spatial Information Sciences 2008; Part
B8, 37 : 1127-1130.
Basyuni, M., Sulistiyono, N. 2018. Deforestation and
reforestation analysis from land-use changes in North
Sumatran Mangroves. 1990-2015. IOP Conf. Series:
Materials Science and Engineering 309 (2018) 012018.
doi:10.1088/1757-899X/309/1/012018.
Departemen Kehutanan Direktorat Jenderal Rehabilitasi
Lahan dan Perhutanan Sosial., 2005. Pedoman
inventarisasi dan identifikasi lahan kritis mangrove.
Manual Procedure for mangrove critical land
identification.
Duke N. C., Meynecke J. O., Dittmann, S., Ellison A. M.,
Anger K., Berger U., Cannicci S., Diele K., Ewel K. C.,
Field C. D. 2007. A world without mangroves? Science,
317(5824), 41-42.
Jennings, S. B., Brown, N. D., Sheil, D. 1999. Assessing
forest canopies and understory illumination: canopy
closure, canopy cover and other measures. Forestry
72(1): 59–74.
Rouse J. W., Haas R. H., Schell J. A., Deering D. W. 1973.
Monitoring vegetation systems in the Great Plains with
ERTS. In: Fraden S.C., Marcanti E.P., Becker M.A.
(eds): 3rd ERTS-1 Symposium, NASA SP-351,
Washington, D.C., Dec 10–14, 1973: 309–317.
ICONART 2019 - International Conference on Natural Resources and Technology
44

Sulistyono, N., Basyuni, M., Slamet, B., 2018. Land surface
temperature distribution and development for green
open space in Medan city using imagery-based satellite
Landsat 8, Friendly City 4 ‘From Research to
Implementation For Better Sustainability’. In IOP
Conf. Series: Earth and Environmental Science 126 (1),
012128 doi:10.1088/1755-1315/126/1/012128
Wachid, M. N., Hapsara, R. P., Cahyo, R. D., Wahyu, G.
N., Syarif, A. M., Umarhadi, D. A., Fitriani, A. N.,
Ramadhanningrum, D. P., Widyatmanti, W. 2017.
Mangrove canopy density analysis using Sentinel-2A
imagery satellite data. In IOP Conf. Series: Earth and
Environmental Science 70, 012020. do i
:10.1088/1755-1315/70/1/012020
Spatial Model of Canopy Density in Mangrove Forest of Percut Sei Tuan
45
