
Monitoring the Spatial Distribution of Mangrove Ecosystem Damage
in Percut Sei Tuan
Nurdin Sulistiyono
1,2
, Khairil Amri
1
, Pindi Patana
1
and Achmad Siddik Thoha
1
1
Department of Forest Conservation, Faculty of Forestry, Universitas Sumatera Utara, Jl. Tridarma Ujung No.1 Kampus
USU Medan North Sumatra 20155, Indonesia
2
Center of Excellence for Natural Resources-Based Technology, Mangrove and Bio-Resources Group, Universitas
Sumatera Utara, Medan North Sumatra 20155, Indonesia
Keywords: Damage of Mangrove Ecosystem, GIS, Remote Sensing, Percut Sei Tuan.
Abstract: Mangrove ecosystem has many economic and ecological benefits, but the presence of mangrove forests is
increasingly threatened. Information about the damage of mangrove ecosystems is very much needed in
mangrove rehabilitation activities. This study aims to get information about the level of damage to the
mangrove ecosystem in Percut Sei Tuan for the period 2006 - 2016. The approach of the methodology used
is overlain technique by giving weight and scores to the types of land use factors, canopy density and soil
resistance to abrasion. The use of Geographic Information System (GIS) technology and remote sensing is
used as a tool to determine the distribution of mangrove damage in the period 2006 to 2016. The results of
the study indicate that the level of damage of the mangrove ecosystem in Percut Sei Tuan tends to increase.
In 2006 it was identified 3,217.59 ha (70.55%) and increased in 2016 by 3,648.71 ha (80.01%). While the
mangrove ecosystem that experienced a high level of damage to mangrove damage increased from 292.77 ha
(6.42%) to 452.33 ha (9.92%).
1 INTRODUCTION
Mangrove ecosystems are ecosystems that are located
between marine ecosystems and land ecosystems.
The existence of mangrove ecosystems is very
important in supporting the survival of life in coastal
areas (Dahdouh-Guebas et al., 2005; Duke et al.,
2007). Mangrove ecosystems have an important role
in supporting capture fisheries activities (Fitri et al.,
2018) which are very beneficial for improving socio-
economic community (Nagi & Abubakr, 2013).
The existence of mangrove ecosystem continues
to experience pressure both in terms of quantity and
quality. Conversion of mangrove ecosystems is
another use, especially for oil palm and pond
plantations (Ilman et al., 2016) are the main causes of
deforestation and mangrove forest degradation. This
causes the damage level of the mangrove ecosystem
to be greater so that efforts are needed to rehabilitate
the mangrove ecosystem to make it better.
The utilization of GIS and remote sensing
technologies can be used to estimate the damage
distribution of mangrove ecosystem (Zhang et al.,
2016; Yunus et al., 2018). The Remote sensing and
GIS technology can help monitor the condition of
mangroves on a large scale. Through spatial
modeling, the distribution of the level of damage to
mangroves can be mapped so that it can provide
information that is useful in planning the
rehabilitation of mangrove ecosystems in the future.
This study aims to obtain information about the level
of mangrove damage in Percut Sei Tuan by utilizing
GIS and remote sensing.
2 MATERIALS AND METHOD
2.1 Study Area
This research was conducted on the mangrove
ecosystem in Percut Sei Tuan, Deli Serdang Regency
which consisted of 3 villages namely Tanjung Rejo,
Percut, and Pematang Lalang Village. The mangrove
ecosystem in this study is an area that has a land
system KJP (Kajapah), KHY (Kahayan) and PTG
(Puting). These three types of land system are areas
38
Sulistiyono, N., Amri, K., Patana, P. and Thoha, A.
Monitoring the Spatial Distribution of Mangrove Ecosystem Damage in Percut Sei Tuan.
DOI: 10.5220/0008387900380041
In Proceedings of the Inter national Conference on Natural Resources and Technology (ICONART 2019), pages 38-41
ISBN: 978-989-758-404-6
Copyright
c
2019 by SCITEPRESS – Science and Technology Publications, Lda. All rights reserved
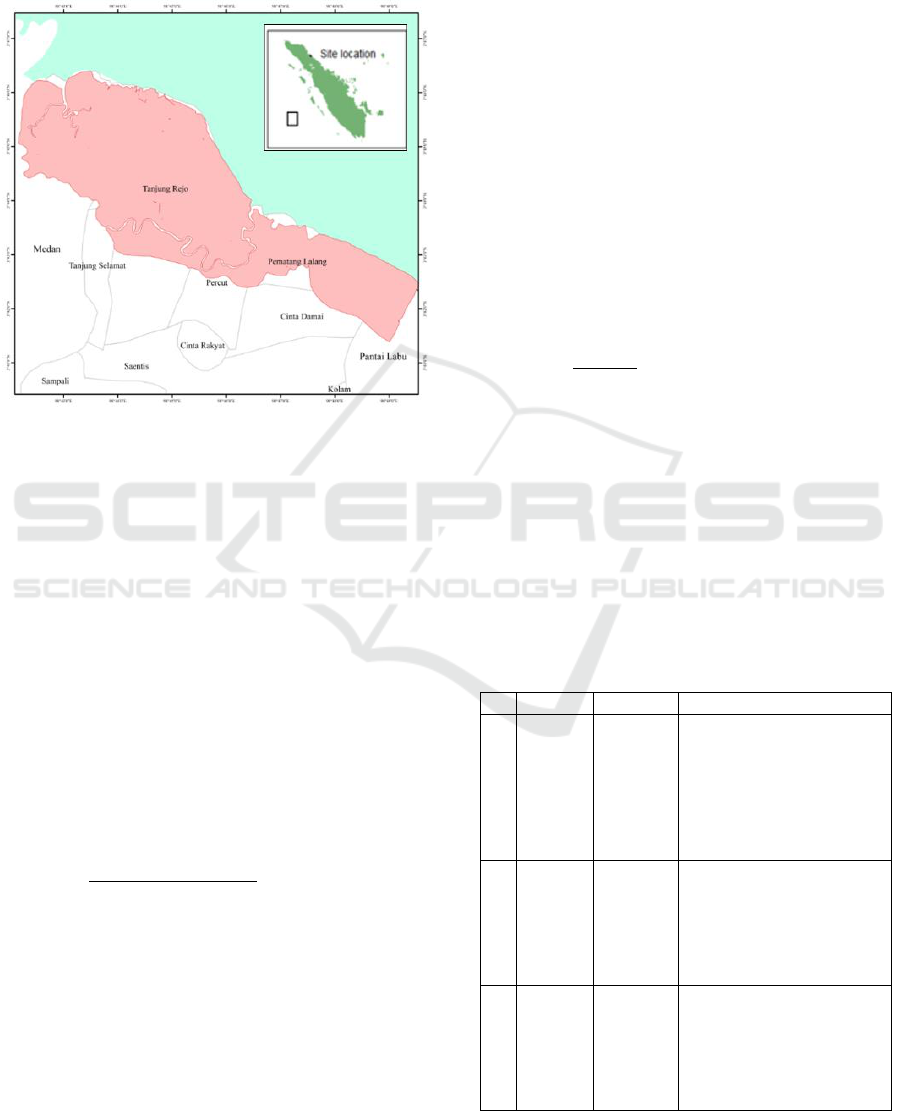
where mangrove forests can potentially grow well.
Existing mangrove forests are part of the mangrove
ecosystem. The location map of the research area can
be seen in Figure 1.
Figure 1: Location of site research.
2.2 Analysis of Land Use
Classification of land cover obtained using the on-
screen digitizing method refers to the research of
Alkan et al. (2010) and Abdelwahed et al. (2011). The
satellite image used is Google Earth satellite imagery
in 2006, 2011 and 2016. The process of geometric
correction is done by georeferencing on satellite
images with GPS points obtained from the field.
The validation process was carried out on land
cover in 2016 by conducting ground checks on 121
locations in the field. Determination of the accuracy
value of the land cover classification results in this
study using the error matrix refers to the study of
Churches et al (2014) and Olofsson et al (2014). Kappa
Accuracy equation with the formula as follows:
(1)
Where :
N = Number of all pixels used for observation
r = Number of rows on the error matrix (number
of classes)
X
kk
= Number of pixels in the corresponding class (on
the diagonal of the matrix)
Xk+ = ∑Xij (number of all columns in row i)
X+k = ∑Xij (number of all columns in row j)
2.3 Analysis of Mangrove Ecosystem
Damage
The spatial model of mangrove damage refers to the
inventory guidelines and identification of critical
mangrove land (Departemen Kehutanan, 2005).
Table 1 shows the criteria used to determine the level
of criticality or mangroves damage.
a. Types of land use that can be classified into three
categories, namely: 1) forest (forested area), 2)
intercropping ponds and plantations and 3) non-
forest vegetation areas (settlement, industry,
agriculture, non-intercropping ponds, rice fields
and bare land)
b. Canopy density, perhaps from the value of the
Normalized Difference Vegetative Index (NDVI)
satellite image of the Landsat 8 path/row :
129/057. Canopy density class can be classified
into high canopy density, medium canopy density,
and low canopy density.
NDVI =
𝑁𝐼𝑅−𝑅𝐸𝐷
𝑁𝐼𝑅+𝑅𝐸𝐷
(2)
Information:
NIR : digital number of near-infrared band
RED : digital number of red band
c. Land resistance to abrasion can be obtained from
the land system map. In this case, soil types can
be categorized into three categories, namely soil
types that are not erosion sensitive (clay texture),
soil types that are sensitive to erosion (mixed
textures) and soil types that are very sensitive to
erosion (sand texture).
Table 1: Weighted and score of mangrove ecosystem
damage.
No
Criteria
Weighted
Score
1
Land Use
(LU)
45
3 :forest
2 :pond of tumpang sari
and plantation
1:Settlements, industries,
pond of non tumpang
sari, agriculture, rice
fields and bare land
2
Canopy
Density
(CD)
35
3 :high of CD (0.43 ≤
NDVI ≤ 1.00)
2 :medium of CD (0.33 ≤
NDVI ≤ 0.42)
1 :low of CD or (-1.00 ≤
NDVI ≤ 0.32)
3
Soil
resistance
to
abrasion
(LRA)
20
3 :soil insensitive to
erosion (clay texture)
2:soil sensitive to erosion
(mixed texture)
1:soil very sensitive to
erosion (sand texture)
%100)(
2
r
k
kk
r
k
r
k
kkkk
XX
N
XXX
N
Kappa
Monitoring the Spatial Distribution of Mangrove Ecosystem Damage in Percut Sei Tuan
39
The damage level of mangrove ecosystem is as
follows:
1. Value 100–166: high damage
2. Value 167–233: damaged
3. Value 234–300: not damaged
3 RESULT AND DISCUSSION
3.1 Land Use Change
The results of the kappa accuracy test to measure the
level of validity of land use classification in the 2016
mangrove ecosystem amounted to 95.21% (good).
Based on the results of land use classifications that
have been carried out, information was obtained that
the area of mangrove forest Percut Sei Tuan from
2006 to 2016 continued to decline (Table 2). In 2006,
the area of mangrove forest was identified as 1.457.32
ha (31.85%), then decreased in 2011 by 1.140.37 ha
(24.92%), and in 2016 the remaining area of Percut
mangrove forest was 1.062.94 ha (23.23%).
On the other hand, the area of plantations and
settlements continues to experience a significant
increase. The increase in the area of plantations and
these settlements has an impact on the reduction in
the area of mangrove forests in Percut Sei Tuan.
Changes in land use from forests to plantations and
settlements are the main causes of deforestation in
Percut mangrove forests.
Table 2: Land use of mangrove ecosystem in Percut Sei Tuan base on google earth satellite.
Land Use
Area (Ha)
Percentage (%)
2006
2011
2016
2006
2011
2016
Water body
211.91
211.92
214.87
4.63
4.63
4.7
Forest
1,457.32
1,140.37
1,062.94
31.85
24.92
23.23
Bare area
4.89
5.9
44.67
0.11
0.13
0.98
Settlement
49.57
51.59
53.52
1.08
1.13
1.17
Palm oil plantation
97.14
1,211.44
1,426.57
2.12
26.48
31.18
Agriculture of wet land
1,110.53
623.37
476.68
24.27
13.62
10.42
Agriculture or dry land
112.16
112.39
124.9
2.45
2.46
2.73
pond
1,531.95
1,218.49
1,171.33
33.48
26.63
25.6
Total
4,575.48
4,575.48
4,575.48
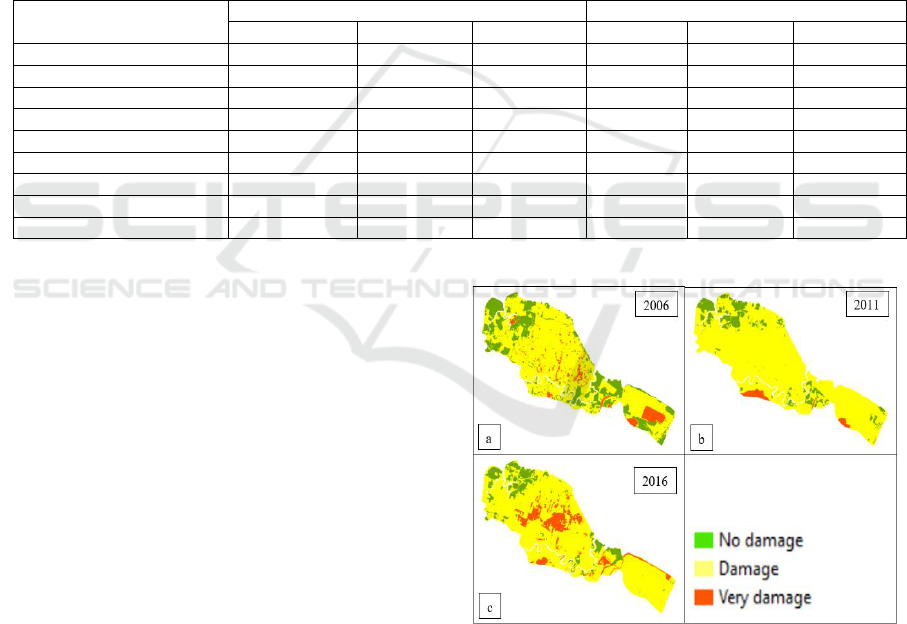
3.2 Damage Level of Mangrove
Ecosystem
Spatial modeling of mangrove ecosystem damage is
done to determine the impact of land use changes that
occur in the mangrove ecosystem in Percut Sei Tuan.
Damage of the mangrove ecosystem is the impact of
deforestation and forest degradation that occurs in the
mangrove ecosystem (Basyuni and Sulistiyono,
2018). This is important to note considering that the
mangrove ecosystem in Percut Sei Tuan is one of the
migratory bird habitat areas along the northeast coast
of Sumatra. Another hand, the mangrove ecosystem
in Percut Sei Tuan is also a tourist location that has
an economic impact on the local community. Spatial
distribution of mangrove damage can be seen in
Figure 2.
Figure 2: Damage level of the mangrove ecosystem in
Percut Sei Tuan.
The amount of mangrove damage to the Percut Sei
Tuan mangrove ecosystem which is the impact of
deforestation and forest degradation from 2006 to
2016 can be seen in Table 3.
ICONART 2019 - International Conference on Natural Resources and Technology
40
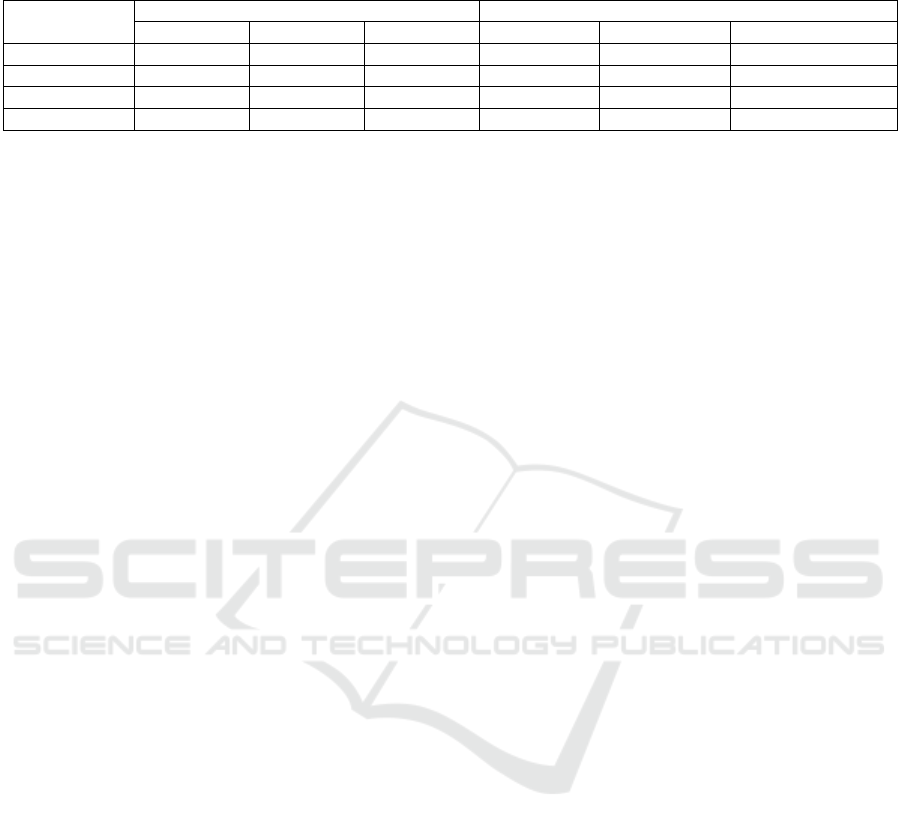
Table 3: Damage level of mangrove ecosystem in Percut Sei Tuan.
Damage level
Area (ha)
Percentage (%)
2006
2011
2016
2006
2011
2016
Not damaged
1,050.05
465.43
459.38
23.03
10.21
10.07
Damaged
3,217.59
3,995.40
3,648.71
70.55
87.61
80.01
Very damaged
292.77
99.58
452.33
6.42
2.18
9.92
Total
4,560.41
4,560.41
4,560.41
100.00
100.00
100.00
The level of mangrove damage that occurred from
2006 to 2016 was even higher. This can be seen from
the smaller area of not damaged mangrove
ecosystem. In 2006, there was 1,050.05 ha (23.03%)
of identified undamaged mangrove ecosystems, then
decreased in 2011 to 465.43 ha (10.21%) and
declined again in 2016 to 459.38 ha (10.07%). The
land use change of mangrove forest to another land
use many occur in the mangrove ecosystem Percut
Sei Tuan, especially for oil palm plantations, ponds,
and settlements. This is a major cause of damage to
the mangrove ecosystem in Percut Sei Tuan, which is
increasing.
4 CONCLUSIONS
Deforestation and forest degradation in the mangrove
ecosystem Percut Sei Tuan has caused mangrove
damage that occurred from 2006 to 2016 increase.
The conversion of mangrove forest to other land uses
is a major cause of damage to the mangrove
ecosystem.
ACKNOWLEDGEMENTS
This study was partly supported by a TALENTA
Grant 2017 (No. 104/UN5.2.3.1/PPM/KP-
TALENTA USU/2017) from Universitas Sumatera
Utara.
REFERENCES
Abdelwahed A. M., Farrag F. A., Abdelhafiz, A., Besheer
M. A., 2011. Potential of using high resolution satellite
images for mapping applications, Journal of
Engineering Sciences, Assiut University, Vol. 39, No 3,
pp.513 -528, May 2011
Alkan M. A., Oruç, M. A., Kayabaşı, D.., Sefercik, U. G.,
2010. Spatial and temporal GIS analysis of change
detection using ikonos images: A Case Study Of
Zonguldak ISPRS Istanbul Workshop 2010 on
Modeling of optical airborne and spaceborne Sensors,
WG I/4, Oct. 11-13, IAPRS Vol. XXXVIII-1/W17.
Basyuni. M., Sulistiyono, N., 2018. Deforestation and
reforestation analysis from land-use changes in North
Sumatran Mangroves. 1990-2015.IOP Conf. Series:
Materials Science and Engineering 309 (2018) 012018.
doi:10.1088/1757-899X/309/1/012018.
Churches, C. E., Wampler, P. J., Sun, W., Smith, A. J.,
2014. Evaluation of forest cover estimates for Haiti
using supervised classification of Landsat data.
International Journal of Applied Earth Observation
and Geoinformation 30 (2014) 203–216.
http://dx.doi.org/10.1016/j.jag.2014.01.020
Dahdouh-Guebas, F., Jayatissa, L. P., Di Nitto, D., Bosire
J. O., Lo Seen, D., Koedam, N. 2005 How effective
were mangroves as a defence against the recent
tsunami? Current Biology 15:R443-R447.
Departemen Kehutanan Direktorat Jenderal Rehabilitasi
Lahan dan Perhutanan Sosial., 2005. Manual Procedure
for mangrove critical land identification.
Duke, N. C., Meynecke, J. O., Dittmann, S., Ellison, A. M.,
Anger, K., Berger, U., Cannicci, S., Diele, K., Ewel, K.
C., Field, C. D. 2007 A world without mangroves?
Science 317:41-42.
Fitri, A., Basyuni, M., Wati, R., Sulistiyono, N., Slamet, B.,
Harahap.Z. A., Balke. T., Bunting, P., 2018.
Management of mangrove ecosystems for increasing
fisheries production in Lubuk Kertang Village. North
Sumatra. Indonesia. AACL Bioflux. Volume 11. Issue
4. http://www.bioflux.com.ro/aacl.
Ilman M., Dargusch, P., Dart, P., Onrizal., 2016. A
historical analysis of the drivers of loss and degradation
of Indonesia’s mangroves. Land Use Policy 54. 448–
459.
Mohd Zulkifli, Mohd Yunus, M. Z. M., Ahmad, F. S.,
Ibrahim, N., 2018. Mangrove vulnerability index using
GIS. AIP Conference Proceedings 1930, 020007
(2018); https://doi.org/10.1063/1.5022901
Nagi H. M., Abubakr M. M., 2013 Threats status to the
mangrove ecosystem along the coastal zone of Yemen.
Journal of King Abdulaziz University: Marine Sciences
24:101-117.
Olofsson, G. M., Foody, M., Herold, S. V., Stehman, C. E.,
Woodcock, Wulder, M.A., 2014. Good practices for
estimating area and assessing accuracy of land change,
Remote Sensing of Environment, vol. 148, pp. 42-57.
Zhang, K., B. Thapa, M. Ross, Gann, D., 2016. Remote
sensing of seasonal changes and disturbances in
mangrove forest: a case study from South Florida.
Ecosphere 7(6):e01366. 10.1002/ecs2.1366
Monitoring the Spatial Distribution of Mangrove Ecosystem Damage in Percut Sei Tuan
41
