
Prediction and Classification of Heart Disease
using AML and Power BI
Debmalya Chatterjee
1
and Saravanan Chandran
2
1
Software Engineer, GGK Technologies Hyderabad, India
2
Department of Computer Science and Engineering, National Institute of Technology Durgapur, India
Keywords: Machine Learning, Heart Disease Prediction, Heart Disease Classification.
Abstract: Machine Learning (ML) is transforming the industries from delivering normal products to deliver intellect
products. Large sets of data points are analysed by the computers and the relationship modelling is applied in
a predictive way in real time to obtain accurate results. Machine Learning is adopted in healthcare problems
for increasing efficiencies, saving money, and saving lives. The cost of medical treatment is reduced and the
healthcare processes are optimized throughout the organization with the support of ML. ML improves
healthcare delivery and patient health. Machine learning improves diagnosis and treatment options, also
empowers individuals to take control of their health. Diagnosis advancements, predictive healthcare,
medicines, and helping patients through ML interface produces better results. Heart Disease relates to many
numbers of medical complications related to the heart. In recent years, ML has spread its knowledge in every
field. In healthcare, the usage of ML has been significantly increased. This research work aims at the
prediction of heart disease and classification of heart disease using Machine Learning algorithms. The
experimental results are classified into five heart disease stages using values 0, 1, 2, 3, and 4, value 0 for no
heart disease and 4 for severe heart disease. The Area Under the Curve (AUC) values depict the accuracy
level of the prediction using this proposed model. The results are displayed using the data set in the form of
charts that is easy to analyse the number of people having chest pains. The ML analytical report added up in
the form of charts or other visuals, the results are reported informatively. This analysis is helpful for doctors
and the medical industry for several case studies.
1 INTRODUCTION
Heart disease affects the circulatory system which is
associated with several illness. Two common
categories of the heart diseases are Cardiomyopathy
and Cardiovascular Disease (CVD). CVD results in
severe illness, disability, and even casualty. Coronary
Heart Disease (CHD) caused by narrow coronary
arteries which in result reduce the supply of blood and
oxygen supply to the heart. CHD encompassed
myocardial infarctions, generally known as heart
attacks and angina pectoris or chest pain. Also, a
blood clot cause a blockage in the coronary artery
develops heart attack. Some of the common factors of
the heart disease are High cholesterol, High blood
pressure, Smoking, Diabetes, Heredity, Obesity,
usage of steroid and similar stimulants, etc.
According to the World Health Statistics 2012 report,
one in three adults has raised blood pressure which
causes around half of all deaths from heart disease
and strokes. In healthcare sector, efficient automated
heart prediction system and heart disease
classification system is essential.
Machine Learning have been utilized in various
application in the recent years. Machine learning
algorithms are used in language processing, robot
control, combinatorial optimization, speech
recognition, handwriting recognition, face
recognition, medical data analysis, etc. In healthcare,
machine learning algorithm are utilised to identify
disease and diagnose the stages of a disease. Several
research works utilised machine learning algorithms
to identify Heart Disease and stages of the heart
disease. The chest pain is the common symptom of a
heart disease, the chest pain can be of either typical
angina, atypical angina, non-anginal pain or
asymptomatic. The machine learning algorithm is a
tool to assist the medical practitioners. The healthcare
industry is enhanced by machine learning algorithms
which improved the treatment accuracy, reduced
time, reduced cost, and reduced complexity.
508
Chatterjee, D. and Chandran, S.
Prediction and Classification of Heart Disease using AML and Power BI.
DOI: 10.5220/0008381505080515
In Proceedings of the 11th International Joint Conference on Computational Intelligence (IJCCI 2019), pages 508-515
ISBN: 978-989-758-384-1
Copyright
c
2019 by SCITEPRESS – Science and Technology Publications, Lda. All rights reserved

2 RELATED WORKS
Over the last 10 years, more number of people died
because of heart disease (Jaymin Patel et al. 2016).
The researchers analyse the classification tree
techniques in data mining. WEKA tool is an open
source software tool used by the researchers for this
research work. This software consists of the various
machine learning algorithms for Data Mining
applications. The objective of this research was to
compare different classification techniques perform
for a heart disease dataset. The J48 algorithm, logistic
model trees algorithm, and Random Forest algorithm
were used to perform the classification on UC Irvine
(UCI) repository. The J48 achieved train error
0.1423221 and test error 0.1666667, logistic model
tree algorithm achieved train error 0.1656716 and test
error 0.237931, and random forest algorithm
achieved train error 0 and test error 0.2. The J48
technique turned out as the best classifier for
predicting heart disease. The building time of this
algorithm was much less and achieved higher
accuracy.
Another research work was published using
machine learning algorithms (Prerana et al., 2015).
They elaborated the research work in five sections,
first one described the theoretical knowledge about
reducing attributes from dataset, second was the
implementation of the machine learning algorithms
Naïve Bayes and PAC Algorithm for predicting heart
disease, big data was processed using Hadoop Map-
Reduce programming in the third section, in the
fourth section deployment of centralized system,
happened on cloud platform and conclusion along
with the future scope came in the fifth phase. The UCI
dataset was considered for the experiment and 13
attributes were involved in the experiment. As an
input, the big data file containing patient records was
used and the dataset fed into the classification model.
Two models were used namely Naïve Bayes
Classifier and Probabilistic Analysis and
Classification. These algorithms were implemented
to determine the heart disease risk and then the
comparison was made in the form of graph. The
experimental analysis revealed that the Naivebayes
continuous variable achieved accuracy 89.80%,
Naivebayes Discrete variable achieved 95.21%
accuracy, and Probabilistic Analysis achieved better
accuracy 97.48%.
Heart disease prediction system was introduced
with different classifier techniques (Sonam Nikhar et
al., 2015). This article focus on analysis of algorithms
comparing accuracy of the algorithms. The
techniques used were ID3 decision tree algorithm,
Naïve Bayes classifier and K-means clustering.
Decision tree handles missing values and removes
outliers. The decision tree can be built even the data
is not cleaned. Main disadvantage of ID3 algorithms
is over-fitting and difficult to implement. The Naïve-
Bayesian classifier considers the variables as
independent variable and predicts without proper
relation cases. K-means clustering clusters dataset on
nearest-neighbor principle with the help of data
similarity. They used R tool for the experiment. They
observed decision trees produces inaccurate results,
Naïve Bayes results accurate if the data is cleaned and
maintained well. The ID3 can clean dataset but unable
produce accurate results. But combination of Naïve
Bayes and K-means produces accuracy results.
This article focused on different algorithms,
where combinations of several target attributes were
predicted (K Srinivas et al., 2011). Effective heart
attack prediction methods were presented using data
mining techniques. The authors have provided an
efficient approach to extract the significant patterns
from the data warehouse of heart disease to predict
the heart attack efficiently based on calculated
significant weightage. Those patterns were frequent
and having the value greater than predefined
threshold were selected. The study used National
Behavioural Risk Factor Surveillance System
(BRFSS) data to assess CVD rates. This research was
performed in coal mining areas after and before the
control for individual level covariates. This includes
smoking, obesity, alcohol consumption, and others.
They tested the hypothesis checked that CVD rates
will be significantly elevated around the coal mining
region residents after controlling for covariates.
In this article (Niti Guru et al., 2007), authors
proposed a system based on neural networks. Further,
it is trained using Back Propagation algorithm. The
system proposed was trained for 78 patient’s records.
The doctor provided the patient data then the system
generated a list of all possible diseases from which
the patient may suffering. This system assists doctor
to avoid human mistakes.
This article (Sellappan Palaniappan, 2008)
proposed a prototype Intelligent Heart Disease
Prediction System (IHDPS) using Decision Tree,
Naïve Bayes, and Neural Network models. It had six
major phases: business understanding, data
understanding, data preparation, modeling,
evaluation, and deployment. Two data mining
classification modelling techniques were used in
developing this system. DMX query language and
functions were used for building and accessing the
models. They used for model training, model
creation, prediction, and content access of the model.
Prediction and Classification of Heart Disease using AML and Power BI
509
They used Cleveland Heart Disease database, which
has 909 records with 15 medical attributes. The
dataset it split into training (455 records) and testing
(454 records) dataset. Test dataset used for validating
and train the models. The purpose of using the
Classification matrix method was to evaluate the
effectiveness of the models. Test datasets were
evaluated with the trained models to check the
accuracy and effectiveness before they were deployed
in HDPS. In this article, authors used pie charts, lift
charts, and bar charts to explain the performance level
of each technique for Naïve Bayes, Decision tree, and
Neural Network. Five mining goals were defined,
Naïve Bayes complied 4, decision trees complied 3,
and neural network complied 2. This system serves as
a training tool to train the medical students for
diagnosing purposes of the patients with heart
disease. Also, provide decision support to assist the
doctors in making better clinical decisions.
Naïve Bayes learning and C4.5 decision trees are
the most commonly used classifier algorithms. In this
article (Chotirat “Ann” Ratanamahatana et al.), the
authors used 10 data sets from UCI repository and
used Gaussian distribution for creating one synthetic
dataset which contains 1,200,000 instances with 20
attributes and 2 classes. Among the 10 datasets, in 5
datasets, Naïve Bayesian classifier outperformed
C4.5 and for the other 5 datasets C4.5 outperformed
Naïve Bayesian classifier. In this article to improve
Naïve Bayesian learning, authors used C4.5 decision
trees to select features. This method proved to be very
fast and successful. The selective Bayesian classifier
proved to be at least as accurate as C4.5, Naïve Bayes,
and Augmented Bayes. Learning was faster than both
C4.5 and Naïve Bayes for each of the domains. This
article suggested that C4.5 decision trees select noble
features for Naïve Bayesian classifier by avoiding
redundant attributes. With 10% training examples the
high accuracy SBC achieved which shown indication
of the fact that for probabilistic induction, these
features lead to higher accuracy for both in Bayesian
classifier and C4.5.
3 PROPOSED WORK
In this research work, Two-Class Boosted Decision
Tree classification algorithm is used. This machine
learning algorithm is used to create a machine
learning model based on the boosted decision trees
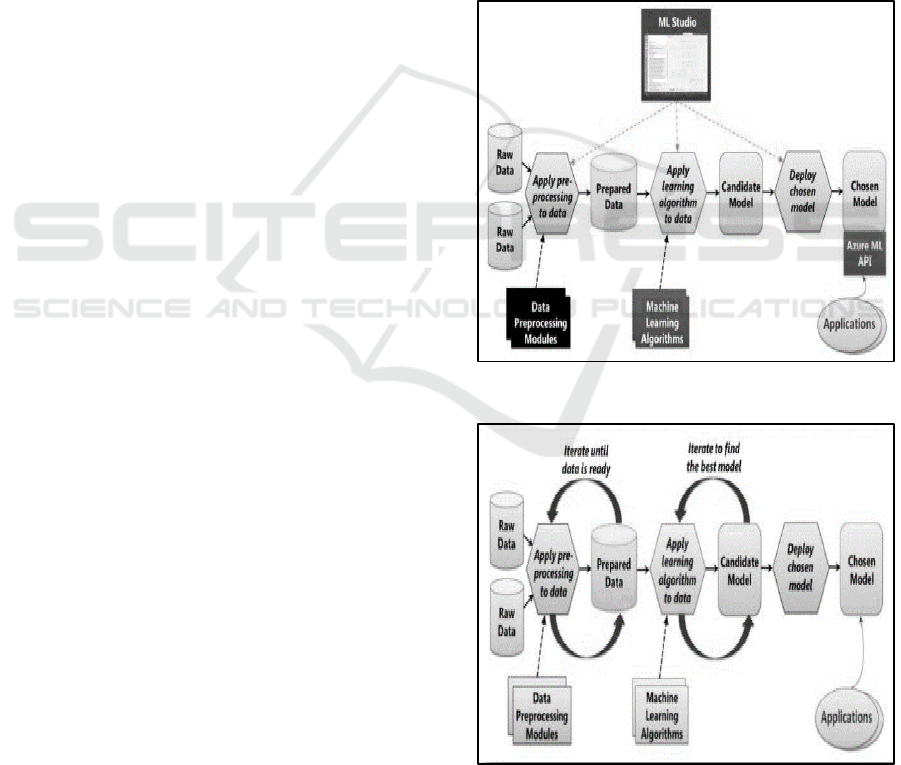
algorithm. Following figure 1 and 2 shows flow of
machine learning and Azure Machine Learning
(AML) algorithm.
This is an ensemble learning method where the
second tree corrects the errors of the first tree, the
third tree corrects errors of the first and second tree.
The process depends on the number of trees. Entire
ensemble of the trees produces the prediction. The
following is the configuration of the boosted decision
tree algorithm:
Boosted Decision tree is added to the experiment.
Based on the training model, trainer mode is set as
─Single Parameter – configuration is defined- a set
of values provided as arguments.
─ Parameter Range – multiple values are specified
to calculate the optimal parameters and Tune Model
Hyper parameters are used to find the optimal
configuration. Combination of values are determined
that produces the best model.
Figure 1: Flow of Machine Learning Algorithm.
Figure 2: Flow of AML Algorithm.
NCTA 2019 - 11th International Conference on Neural Computation Theory and Applications
510

Maximum number of terminal nodes are specified
those are created in a tree by Maximum number of
leaves per tree option. The size of the tree increases
by maximizing this value. This results better
precision but requires higher training time.
To create any terminal node in a tree, the number
of cases required is defined in Minimum number
of samples per leaf node. Increasing this value
results in increasing the threshold for creating new
rules. For example, if the value is 5, the minimum
test cases is 5 that meet the same conditions.
Step size is defined in the learning rate as a number
between 0 and 1. This rate defines converging rate
on the optimal solution. The optimal solution is
higher if the step size is too big. If it’s too small,
training takes longer time to converge on the
solution.
The total number of trees to be created is defined
in number of trees to be created in the ensemble.
Creating more decision trees will inversely affect
the training time but better coverage is achieved.
This value controls the number of trees displayed
while visualizing the training model. For example
to produce a tree the value is set to 1. This shows
n iterations with 1 tree.
A non-negative integer is used as random seed
value. Reproducibility across run is ensured that
have same data and parameters. The default value
is 0. The initial value is obtained from the system
clock.
To create a group of unknown values in the
training and validation sets, allow unknown
categorical levels option is selected. The model
will accept only the contained values in the dataset
if this option is not select.
The model is trained
─ If the Create trainer mode is set to Single
Parameter, a tagged dataset and the Train Module
is connected.
─ If the Create trainer mode is set to Parameter
Range, a tagged dataset, and the Train Module is
connected using Tune Model Hyper parameters.
The set of trees generated are visualized from the
Tune Model Hyper parameters.
Tune Model hyper parameters is used to determine
the optimum parameter settings by performing a
parameter sweep on a trained model. The choice for
the parameter sweep are Entire Grid, Random Sweep,
and Random Grid.
Two methods supported by TMH to find the
optimum settings:
Integrated train and tune: Parameter sweep is used
to train a model. The parameters are selected while
the others remain fixed.
Cross validation with tuning: The data is divided
into number of folds prior to testing. Best accuracy
achieved but take longer time to train.
In the properties pane of this model, two different
drop-down box presents, one for classification
algorithms and another for regression. The metrics for
regression is ignored for classification algorithm.
There are basically two ways to tweak parameters in
TMH, by hand or by parameter-sweep. Parameters
tuned by hand is either slow or long but it provides
direct feedback about how algorithm works.
Parameter sweep won’t set hard coded values for the
ML model. It provides range by selecting “Parameter
Range” as trainer mode. Here the label is selected.
There are three parameter sweeping mode:
Random sweep: In this case, n random guesses
happened from all the possible parameter provided
with the model.
Entire grid: This option is best for limited number
of parameter sets. It takes lot of time as it covered
all parameter combinations. It calculates all the
possibilities.
Random grid: With all the possibilities, a grid is
created. From that limited number of random tries
out instead of all. It provides great insight of how
the combinations of parameters perform.
For maximum experiments with TMH, Random
sweep or Random grid is selected instead of entire
gird as it is very slow in computation.
4 RESULTS AND DISCUSSION
Azure machine learning is used for performing the
research experiment. The UCI Machine Learning
repository is used to train this model. The original
dataset contains 76 attributes among which 14
attributes are considered for the research analysis.
Cleveland database has been considered from where
all these attributes are captured.
Attribute Information:
1. (age), 2. (gender), 3. (cp), 4. (trestbps), 5. (chol), 6.
(fbs), 7. (restecg), 8. (thalach), 9. (exang), 10.
(oldpeak), 11. (slope), 12. (ca), 13. (thal), 14. (num)
The data has been imported from the URL via HTTP,
as AML provides flexibility to import data from
different places. The format of the data is in CSV
format. While importing the data via URL, the URL
must have the site full path with the filename and
extension. Cached results has been checked to avoid
reloading the data every time. Following figure 3
Prediction and Classification of Heart Disease using AML and Power BI
511
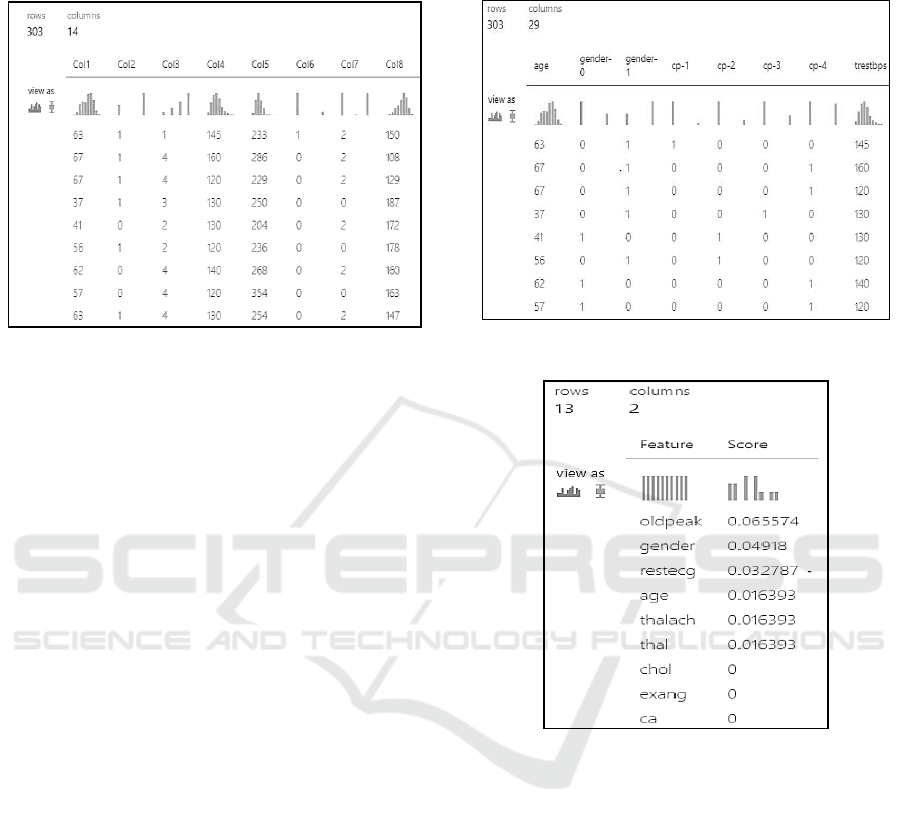
shows the data set where 8 columns are visible among
the 14. The dataset has 303 rows.
Figure 3: Heart Disease Dataset (Raw Table).
Edit metadata to assign column names to all the
columns. Again, performed edit metadata into the
dataset to categorize the dataset. In this step, the
categorical option is selected and the columns are
arranged in categorical.
There are columns which have some values
missing. Thus, those rows having missing values are
removed if there are many numbers of rows.
Otherwise, those missing values have been replaced
with the mode value with minimum and maximum
missing value ratio being correspondingly 0 and 1.
Few values of 'ca' and 'thal' columns is missing which
replaced by the mode values.
The main part of this system is using R Script to
set the heart disease diagnosis. The 1-based optional
input ports are mapped to variables. The two values 0
and 1 of the 'num' column which used for diagnosis
of heart disease is then evaluated considering the
dataset. Then the corresponding dataset is selected to
send the Output to Dataset Port.
The model is trained in two ways. In one flow,
Convert to Indicator value is enabled and in another
it is not enabled. The use of Convert to Indicator value
is to make the dataset more granular. The gender
column is divided into gender-0 and gender-1. The cp
(chest pain) column divided into cp-1, cp-2, cp-3 and
cp-4. Likewise, other columns are divided. Following
figure 4 shows the resultant table.
The data is split into two parts 80% and 20%. On
the 80% data, the machine learning algorithm is
applied and the remaining 20% data is considered in
score model to check the accuracy. The algorithms
applied are: Two Class Boosted Decision Tree and
Tune Model Hyper parameters. On using of Two
Class Boosted Decision Tree and applying it on Tune
Model Hyper parameters the following figure 5 is the
results achieved.
Figure 4: Granular Level Data.
Figure 5: Permutation Feature Dataset Result.
The result that achieved after this step, fed into score
model and permutation feature importance. Based on
the test dataset (20%) and the trained model, the
permutation feature importance computes a set of
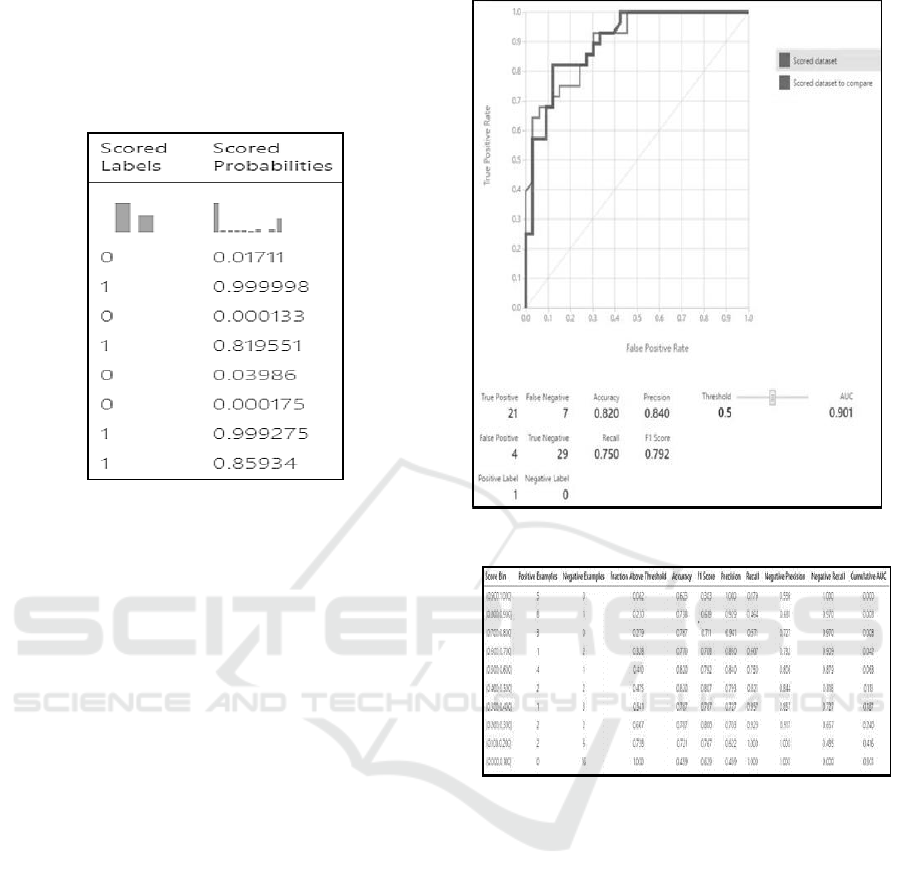
feature importance scores. Score model produces
scored labels and scored probabilities. Scored labels
contain values 0 and 1. These values are based on
scored probabilities. If the scored probabilities are >
0.50 then scored label is 1 and when < 0.50 then it is
0. The value 0 and 1 depicts that in which class the
feature is falling into, whether class 0 or class 1.
Following figure 6 shows the result of score
model. The actual result is achieved from Evaluate
Model. This generates several information like True
Positive, False Positive, True Negative, False
Negative, Accuracy, Precision, Recall, and F1 Score.
True Positive means the prediction of the ML system
and the actual result is same. False Positive means the
NCTA 2019 - 11th International Conference on Neural Computation Theory and Applications
512
prediction of ML system is false but the patient has a
heart disease. True negative means the ML system
predict correctly that the patient has a heart disease.
False Negative means the prediction of the ML
system is incorrect.
Figure 6: Score Model Result.
Accuracy is defined as the proportion of the total
number of correct predictions (Fawcett, Tom, 2006).
Accuracy = (TP + TN) / (TP + TN + FP + FN)
Precision is the percentage of selected items that are
correct.
Precision = TP/(TP+FP)
The recall is the percentage of correct items that are
selected.
Recall = TP/(TP+FN)
F1 Score is the harmonic mean of Recall and
Precision.
F1 Score = 2TP / (2TP + FP + FN)
According to the Predicted Result data, the accuracy
of the prediction system is 82%, Precision is 84%,
Recall is 75%, and F1 score is 79.2%. The AUC curve
of the same has been shown in the following figure 7.
The AUC value is 90% which is a very good value for
a threshold of 5. All the values above the threshold
value belong to a first class and all the values below
that belong to a second class.
For this experiment, TP=19, TN=30, FN=9, FP=3
Accuracy=(TP+TN)/(TP+TN+FP+FN)=0.803=80.3%
Precision = TP/(TP+FP) = 0.863 = 86.3%
Recall = TP/(TP+FN) = 0.6785 = 67.8%
F1 Score = 2TP / (2TP + FP + FN) = 0.76 = 76%
Following figure 8 shows a detailed results, the
positive examples, negative examples, fraction above
threshold, accuracy and other details.
Figure 7: AUC Curve 2.
Figure 8: Result of Model.
4.1 Analytical Study using Bi
After successful completion of the machine learning,
power bi is used to create reports for analysis
purposes in the form of bar charts and clustered
column charts. The following figure 9, shows the
comparison result of the count of the number of
people those having chest pains.
The chest pain has been categorized into four, i.e.
cp-0 is typical angina, cp-1 is atypical angina, cp-2 is
non anginal pain and cp-3 is asymptomatic.
From the chart, it is noticed the number of people
having typical angina, the number of people having
atypical angina and furthermore. For the current
dataset, maximum number of people, i.e., 23 peoples
are having asymptomatic chest pains followed by 20
peoples who are having non-anginal pain. Following
figure 10 shows the number of people are in a
Prediction and Classification of Heart Disease using AML and Power BI
513
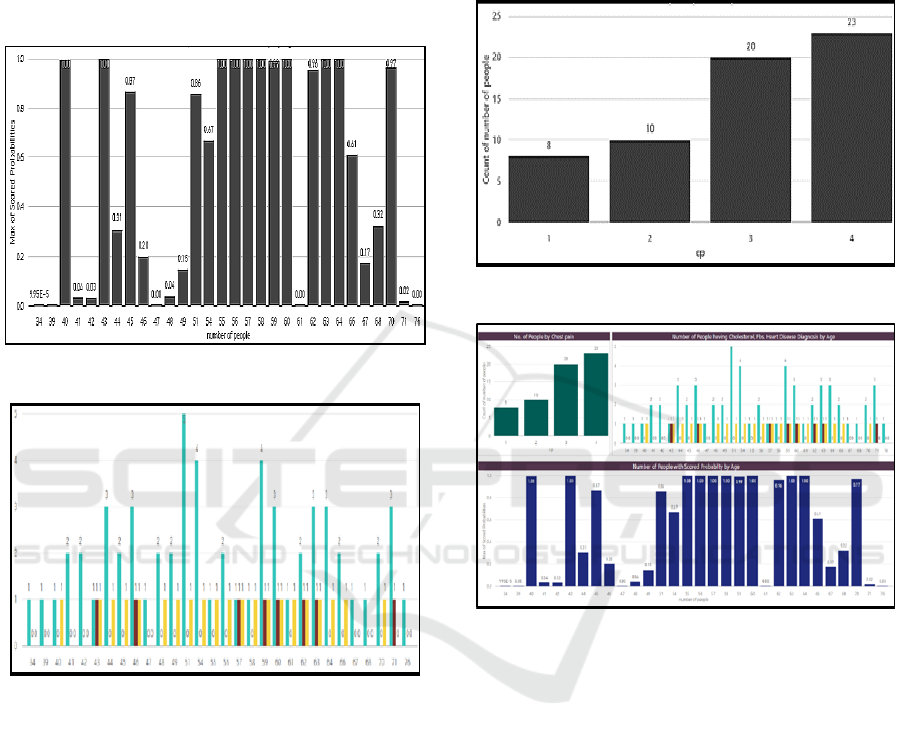
particular age. The yellow bar specifies a value
dealing with number of people with angiographic
heart problem. For e.g., there are three people of age
44, among them one of the person do have this
problem. The maroon bar shows the data of fasting
blood sugar. There are three people of age 71, from
the chart it is noticed that one of the three persons
have very high blood sugar in fasting.
Figure 9: Number of people vs. Chest pain.
Figure 10: Number of people with Cholesterol, Fbs, Heart
Disease by age.
These are the analysis performed on that data set
taken from UCI machine learning heart disease data
set. The score probabilities are shown in the following
figure 11 in comparison with the number of people.
The total BI report is shown in the following figure
12 that includes all the chart in the same page helps
any doctor or any medical person to analyse the data
without much effort.
The report contains the count of the number of
people having what Chest Pain, the count of the
number of people based on their age having
cholesterol, fbs, heart disease diagnosis data and the
resultant data with the number of peoples.
This experimental results are compared with
Prerana et al., 2015 experimental results. In their
experiment, Naivebayes continuous variable
achieved accuracy 89.80%, Naivebayes Discrete
variable achieved 95.21% accuracy, and Probabilistic
Analysis achieved better accuracy 97.48%. In this
experiment 86.3% precision is achieved. Thus, in the
future a hybrid model will be developed to achieve
better accuracy.
Figure 11: Resultant Data with Number of People.
Figure 12: Total Power BI Report.
5 CONCLUSION
There are several data source from where healthcare
related data are availed for processing, predicting, and
analysis of various diseases. The dataset are selected
based on the criteria to be predicted. The main part of
machine learning is data, the more data produces
better results. In this research work, AML has been
used for processing and identifying the person has
heart disease or not. The 80% of the dataset are
chosen randomly for training and the remaining 20%
data are used to check how much the prediction was
accurate. Here, the classification algorithm has been
used for machine learning. Power BI has been used in
order to make some analytical study which proves to
be very much helpful for the healthcare and medical
studies. The AML is a very latest technology. Still,
NCTA 2019 - 11th International Conference on Neural Computation Theory and Applications
514

research is going on machine learning using AML.
The comparison has been done on Naive Bayes and
ANN. This work can be extended by using any other
classification algorithms to achieve much better
accuracy and also try to get better predictive result
from the system.
REFERENCES
Jaymin Patel, Tejal Upadhyay, Samir Patel, “Heart Disease
Prediction Using Machine learning and Data Mining
Technique”, IJCSC, Vol. 7, No. 1, pp. 129-137,
September 2015 – March 2016.
Prerana T H M, Shivaprakash N C, Swetha N, “Prediction
of Heart Disease Using Machine Learning Algorithms-
Naïve Bayes, Introduction to PAC Algorithm,
Comparison of Algorithms and HDPS”, International
Journal of Science and Engineering, Vol. 3, No. 2, pp.
90-99, 2015.
Sonam Nikhar, A.M. Karandikar, “Prediction of Heart
Disease Using Machine Learning Algorithms”,
International Journal of Advanced Engineering,
Management and Science (IJAEMS), Vol. 2, Iss. 6,
June 2016.
K. Srinivas, G. Ragavendra and A. Govardhan, “A Survey
on prediction of heart morbidity using data mining
techniques”, International Journal of Data Mining &
Knowledge Management Process (IJDKP), Vol.1,
No.3, pp.14-34, May 2011.
Niti Guru, Anil Dahiya, Navin Rajpal, “Decision Support
System for Heart Disease Diagnosis Using Neural
Network”, Delhi Business Review, Vol. 8, No. I, Jan–
Jun 2007.
Sellappan Palaniappan and Rafiah Awang, “Intelligent
heart disease prediction system using data mining
techniques”, International Journal of Computer Science
and Network Security, Vol.8, No.8, pp. 343-350, 2008.
Chotirat “Ann” Ratanamahatana and Dimitrios Gunopulos,
“Scaling up the Naïve Bayesian Classifier: Using
Decision Trees for Feature Selection”, Computer
Science Department University of California Riverside,
CA 92521 1-909-787-5190
Fawcett, Tom, “An Introduction to ROC Analysis”, Pattern
Recognition Letters. 27 (8): 861–874, 2006.
Prediction and Classification of Heart Disease using AML and Power BI
515
