
Collaboration Spotting Cite: An Exploration System for the
Bibliographic Information of Publications and Patents
Andr
´
e Rattinger
1,2
, Jean-Marie Le Goff
1
and Christian Guetl
2
1
IPT-DI, CERN, Espl. des Particules, Meyrin, Switzerland
2
Institute of Interactive Systems and Data Science, Graz University of Technology, Graz, Austria
Keywords:
Bibliometrics, Information Retrieval, Relevance Feedback, Visual Analytics, Patent Analysis.
Abstract:
Collaboration Spotting is a knowledge discovery web platform that visualizes linked data as graphs. This
platform enables users to perform operations to manipulate the graph to see and explore different facets of
complex networks with multiple node and edge types. It combines information retrieval and graph analysis
to effectively explore arbitrary data-sets. The platform is designed in a way that non-expert users without
data science knowledge can explore it. For this, the data has to be specifically crafted in a form of a schema.
The paper explores the platform in a bibliometrics context and demonstrates its search and relevance feedback
mechanisms which can be applied through the navigation of an underlying knowledge graph based on publi-
cation and patent metadata. This demonstrates a novel way to interactively explore linked datasets through the
combination of visual analytics for graphs with the combination of relevance feedback.
1 INTRODUCTION
Defining and solving problems often starts with the
exploration of data. Exploring publication and patent
metadata and the textual content is a complex and
time consuming task especially when a person is new
to particular domain. Without a clear view on what
is available or having some particular knowledge of
a domain it is difficult to know which way a prob-
lem can be solved or if it is even solvable with what
is at hand. As a newcomer to a new scientific field,
it takes a great amount of time because one can eas-
ily get overwhelmed by the massive amount of pub-
lications and information that is available. Finding
the most relevant authors, papers, companies, univer-
sities or topics of a field can be a challenge that takes
up a lot of time. If someone wants to create a new
invention for example, searching the patents for ex-
isting work or similar work is a very time-consuming
task that takes expert knowledge in the choice of key-
words and categories. Collaboration Spotting is a tool
that can help with this data exploration problem. It is
designed so that it can work with any kind of data,
but preferably it should be heavily linked data or even
a knowledge graph associated with textual content.
Collaboration Spotting Cite is a specific version of
the Collaboration Spotting platform developed at IN-
STITUTION to explore bibliometric data from pub-
lications and patents. It enables user to view differ-
ent facets of their connected data and manipulate cer-
tain aspects of it, such as the selection of subsets or
the viewpoint on the data. The version combines this
graphical navigation with information retrieval pro-
cedures. The first step as later shown in this paper is
retrieving a list of indexed documents and automati-
cally transforming them to a graph based on a schema
blueprint. Afterwards the user navigation in the graph
takes place where the user has different option to ma-
nipulate the graph so that the system shows a subset
which is closer to his information need. In addition
a new search can than be performed using the users
input from the navigation as relevance feedback for
a renewed retrieval. The remainder of this paper is
organized as follows: The next section outlines some
related work on science mapping and information re-
trieval with relevance feedback. Section 3 contains
a description of the Collaboration Spotting platform
with its navigation and retrieval mechanisms. Section
4 demonstrates how the platform can be used with ci-
tation data and Section 5 concludes the paper and out-
lines future work.
548
Rattinger, A., Goff, J. and Guetl, C.
Collaboration Spotting Cite: An Exploration System for the Bibliographic Information of Publications and Patents.
DOI: 10.5220/0008366105480554
In Proceedings of the 11th International Joint Conference on Knowledge Discovery, Knowledge Engineering and Knowledge Management (IC3K 2019), pages 548-554
ISBN: 978-989-758-382-7
Copyright
c
2019 by SCITEPRESS – Science and Technology Publications, Lda. All rights reserved
2 RELATED WORK
Mapping science and scientific processes through ci-
tation data has been explored by (Small, 1999), where
multiple approaches are reviewed and the data is ar-
ranged in different ways. In addition, there are multi-
ple visualization applications for general graph based
data (Bastian et al., 2009) as well as co-citation net-
works or bibliometric networks. The available view-
ers provide different tools to view and visualize the
graph based on its properties as well as performing
different manipulations on the graph data. A sim-
ilar tool as the work presented here is VOSviewer.
VOSviewer (van Eck and Waltman, 2009) is a tool for
the visualization of bibliometric data and combines
this with natural language processing to also create
term co-occurrence networks from textual informa-
tion. Collaboration Spotting is a tool which also can
be applied to generic data, and offers information re-
trieval methods and novel ways to navigate through
the data which the normal bibliometric visualization
tools do not provide. CiteSpace (Chen, 2006) is an-
other tool that helps to explore and visualize the sci-
entific knowledge domains. Key differences are in
how the retrieval aspects of the navigation are han-
dled. Similar to VOSviewer, CiteSpace does not offer
information retrieval functionality, which is included
in collaboration spotting. The correct information in
the visualization platforms have to be provided be-
forehand from external datasets. In the case of CiteS-
pace they can also be directly downloaded from the
Web of Science search interface. The procedure in
Collaboration Spotting has the advantage of users be-
ing able to rapidly performing multiple searches and
even being able to combine them to create a suitable
result graph for their data exploration. In comparison
to other systems, the data can come directly from the
indexed documents, but a manual blueprint of the data
mapping has to be created. Parts of the retrieval pro-
cess relies on methods that can be described as rele-
vance feedback through graph navigation. Relevance
feedback as a way to refine the information retrieval
process has been well defined and explored in liter-
ature (Rocchio, 1971) (Salton and Buckley, 1990),
and there are a lot of approaches who use the fully
automated pseudo-relevance feedback method to re-
fine queries to good success (Cao et al., 2008). In
addition, there are even methods of utilising pseudo
relevance feedback for citation recommendation (Liu
et al., 2014), but the authors do not know of any meth-
ods that directly use graph exploration and navigation
as a mechanism for the application of relevance feed-
back.
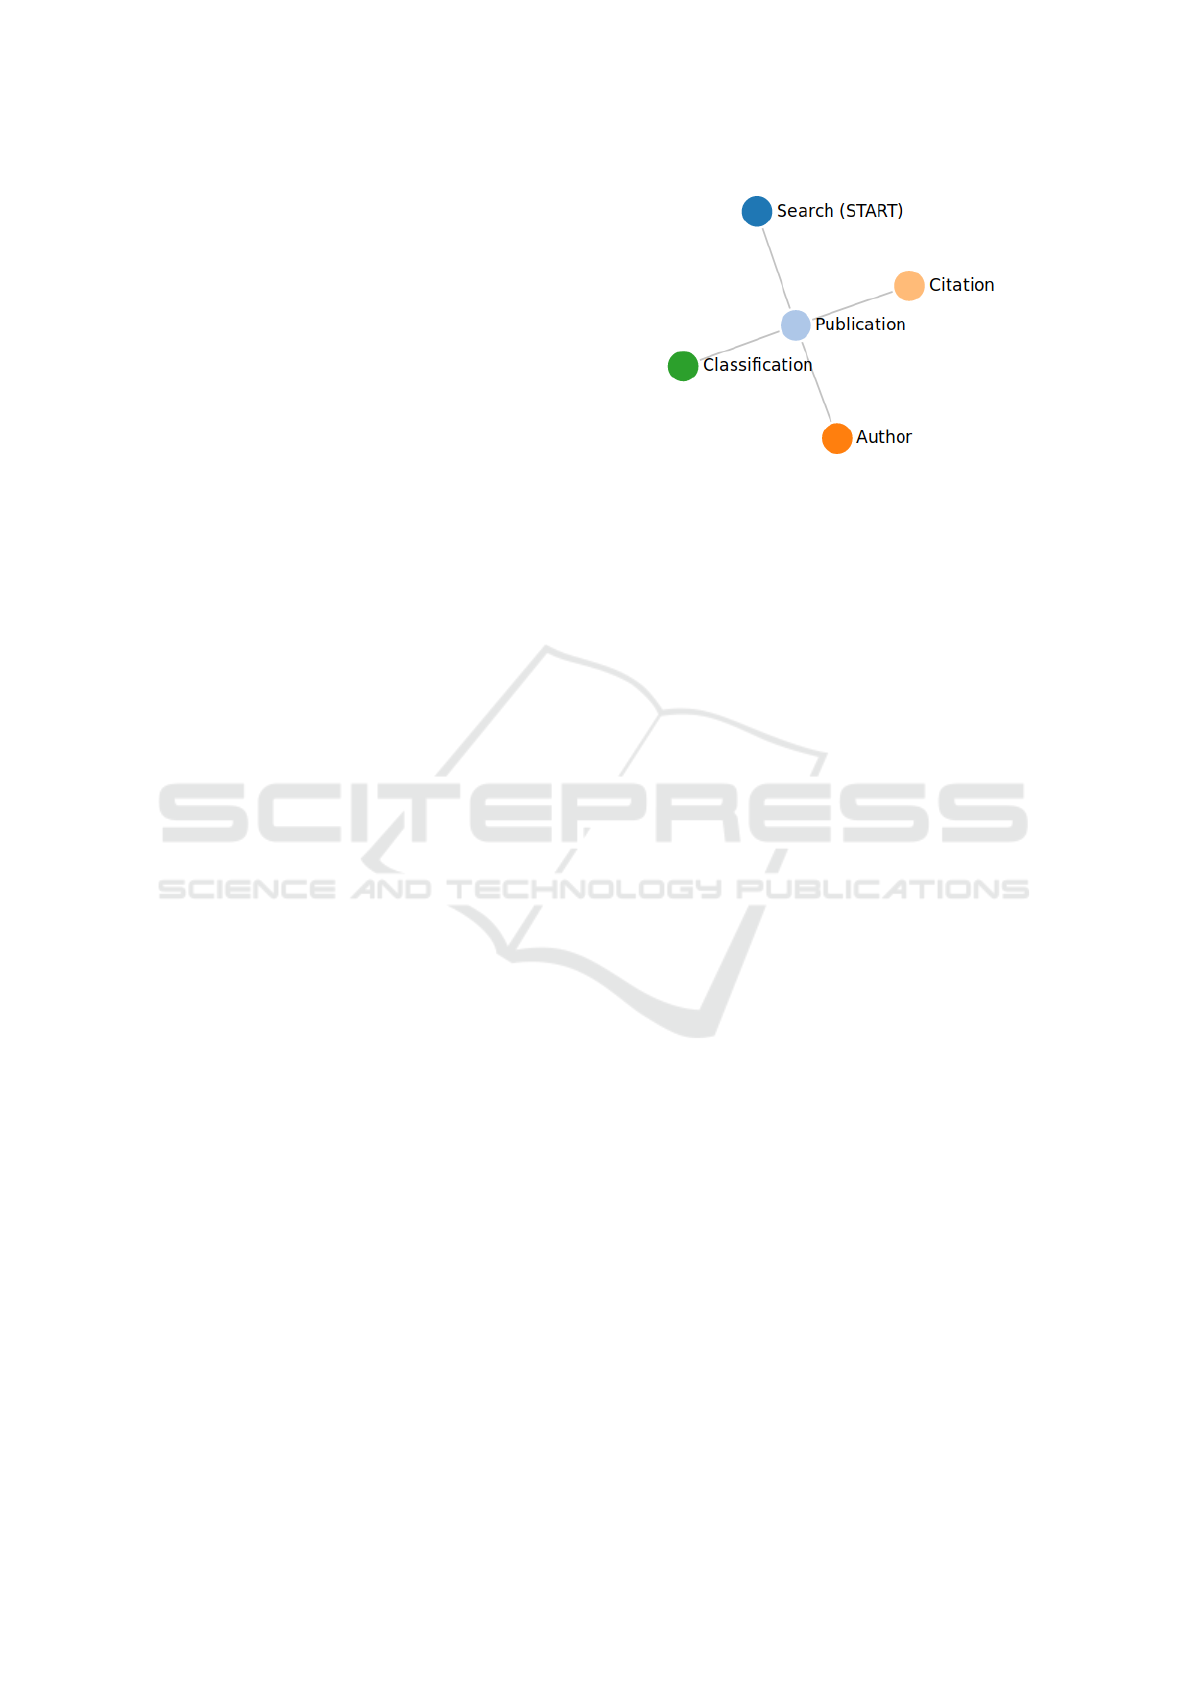
Figure 1: A principle representation of a schema as it is
used for the transformation of the data and the navigation
in the graph. The publication builds the central point for
navigation between available metadata. Search (START)
represents the connection to the search keywords or seed
document the graph is based on, publication references the
actual document.
3 COLLABORATION SPOTTING
CITE
Collaboration Spotting is a visualisation and naviga-
tion platform for exploring and manipulating large
and complex data-sets (Agocs et al., 2017). It com-
bines aspects of information retrieval and visual ana-
lytics to let users explore their data without having a
background in data science or other related fields. A
typical search and navigation process in the Cite ver-
sion of the web application is performed in multiple
steps: Retrieval of the relevant documents and con-
struction of the graph, Navigation and exploration of
the data and finally refining the search through rele-
vance feedback. The following sections explain each
of the stages in more detail.
3.1 Information Retrieval and Graphs
The system operates in the following way: First, the
user performs a full text search on the indexed docu-
ments and the retrieval process returns a list of items
and their relevance. The Collaboration Spotting plat-
form is not limited to text documents, but the search
procedures have been optimized for this application.
Parts of the retrieval process are described in more de-
tail in (Rattinger et al., 2018a). The retrieval process
takes either full documents or keywords defined by
the user to perform the initial search, as for search of
patents and publications source documents are mostly
available. In this case, keywords are extracted from
the different sections and weighted by tf-idf (Ramos
et al., 2003). The list of result documents is then
transformed into a graph according to a predefined
Collaboration Spotting Cite: An Exploration System for the Bibliographic Information of Publications and Patents
549
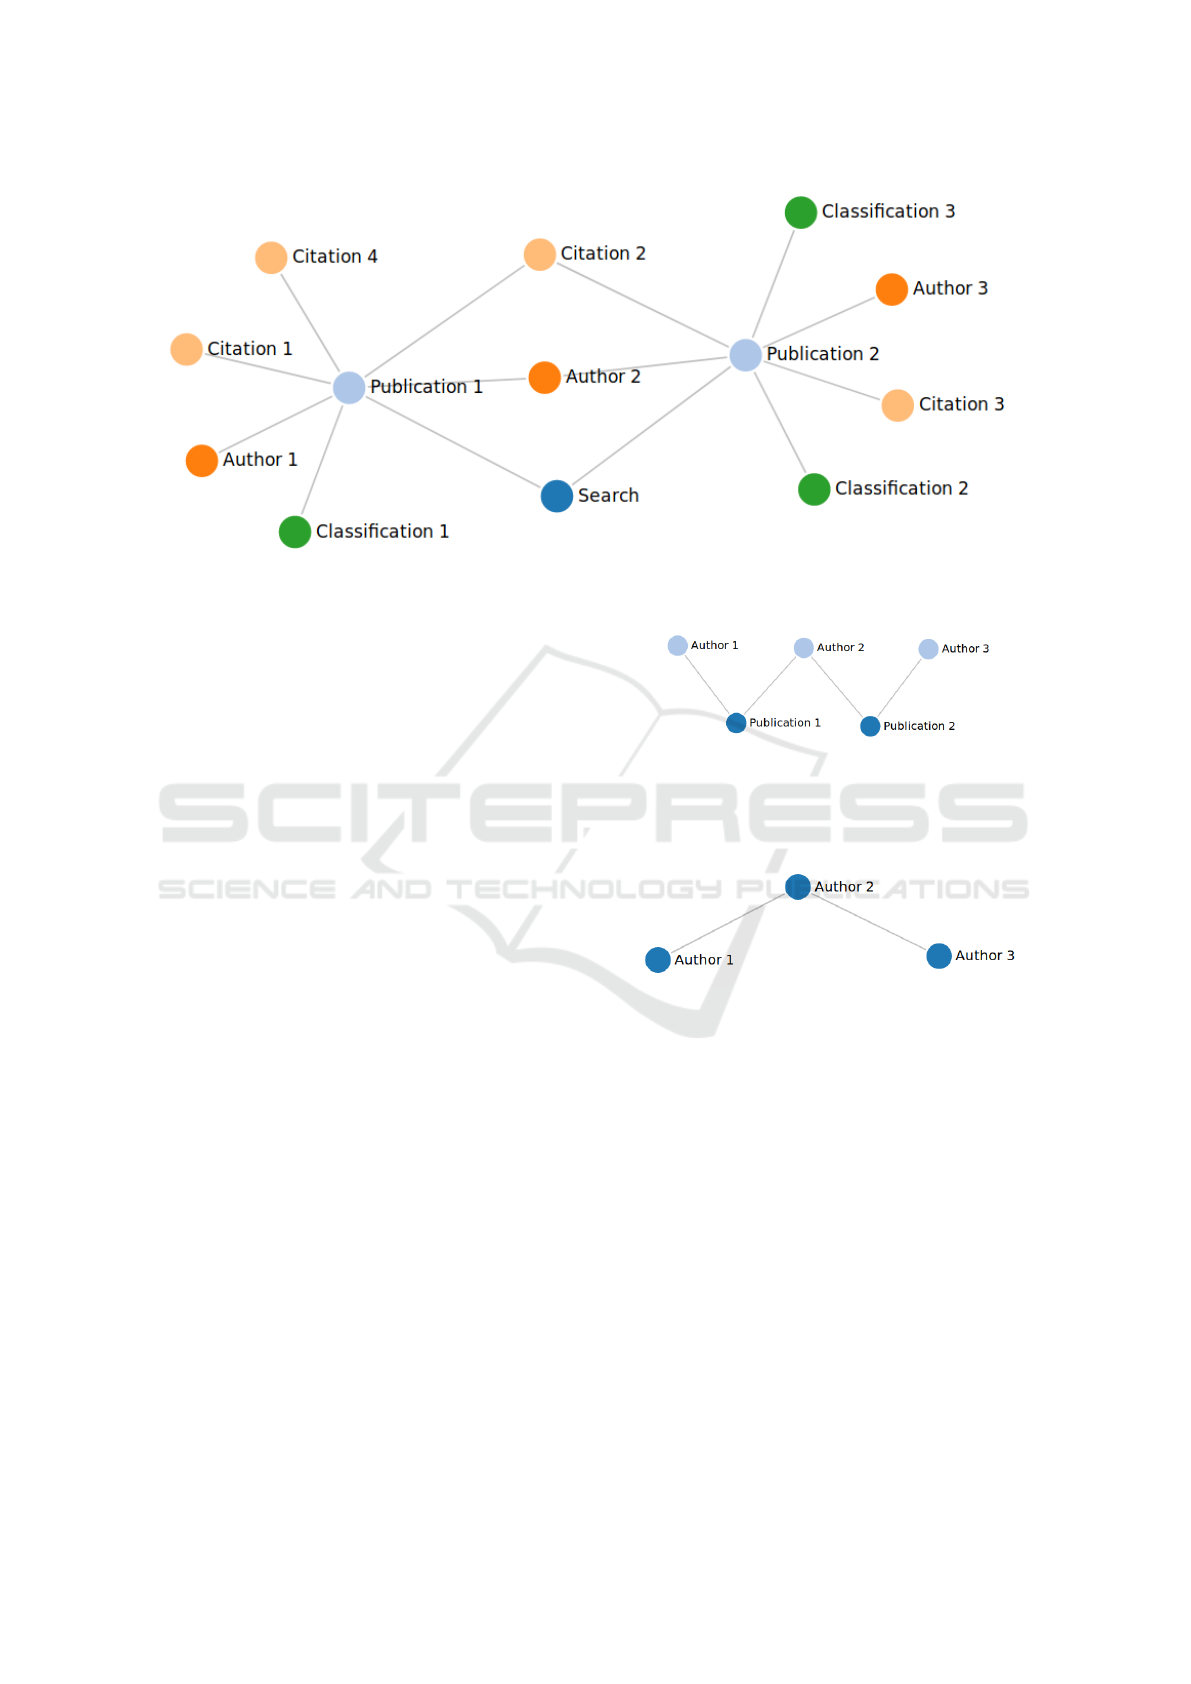
Figure 2: A sample graph based on the schema. The publications have multiple elements that connect them which enables the
navigation in the system. As classifications do not have any connection to more than a single node, they would also not have
any connections in the facets view.
schema. The schema acts as a blueprint for trans-
formation and for later navigation in the graph and
provides the knowledge to the system on how data
has to be transformed to fit into the graph structure.
For publications and patents, a star-like schema is
the simplest schema for transformation and naviga-
tion with the text document forming the central ele-
ment in the system. Other more extensive schemas are
possible for the navigation as well, but overly com-
plex schemas might be difficult for a user to construct
or make it difficult to interpret the data. This might
be alleviated by specific domain knowledge. A ba-
sic star schema can be seen in Fig. 1. In this simple
example, there is only a limited amount of metadata
in the graph. The document is in addition attached to
a search nodes, which allows for the combination of
different search graphs, which is an additional search
refinement or expansion mechanism. The search node
provides the initial starting point for further naviga-
tion. One of the facets of this graph is then visualized
starting from this search node. The search node for a
single search has only a single instance and is named
after the keywords or the seed document. Fig. 2
shows a sample graph based on the previous schema.
Each of the nodes in the schema other than the start-
ing search node will have multiple instances with con-
nections between them. A node of a certain type will
never be connected to another node of the same type
directly. This is an important principle on how the
navigation takes place later on. The procedure of vi-
sualizing and performing graph navigation operations
is explained in the next section.
Figure 3: Extract of only the facets publications and authors
from the sample graph. this is the basis for the final repre-
sentation in the application. In this example the publication
nodes are used as a reference node to visualize relationships
between authors.
Figure 4: The remaining graph as seen by the user in the col-
laboration spotting application. Only nodes from the single
facet ”author” are represented in the final graph.
3.2 Graph Navigation
An important aspect of Collaboration Spotting is how
a graph that has been created by the search can be ex-
plored. The principle is always the following: The
user chooses a single facet of the data. A facet of the
data corresponds in this case to one of the nodes in
the schema shown in Fig. 1 (author, citation, classi-
fication, publication). In the next step only the rele-
vant facets for the navigation are selected as can be
seen in Fig. 3. In this example the user selects the
facet ”author” which should be visualized from the
perspective of the publications. We call the publica-
tion nodes in this case the ”reference” nodes, as they
are used as a basis for the resulting graph. As long as
a connection exists, any direction can be visualized.
KDIR 2019 - 11th International Conference on Knowledge Discovery and Information Retrieval
550
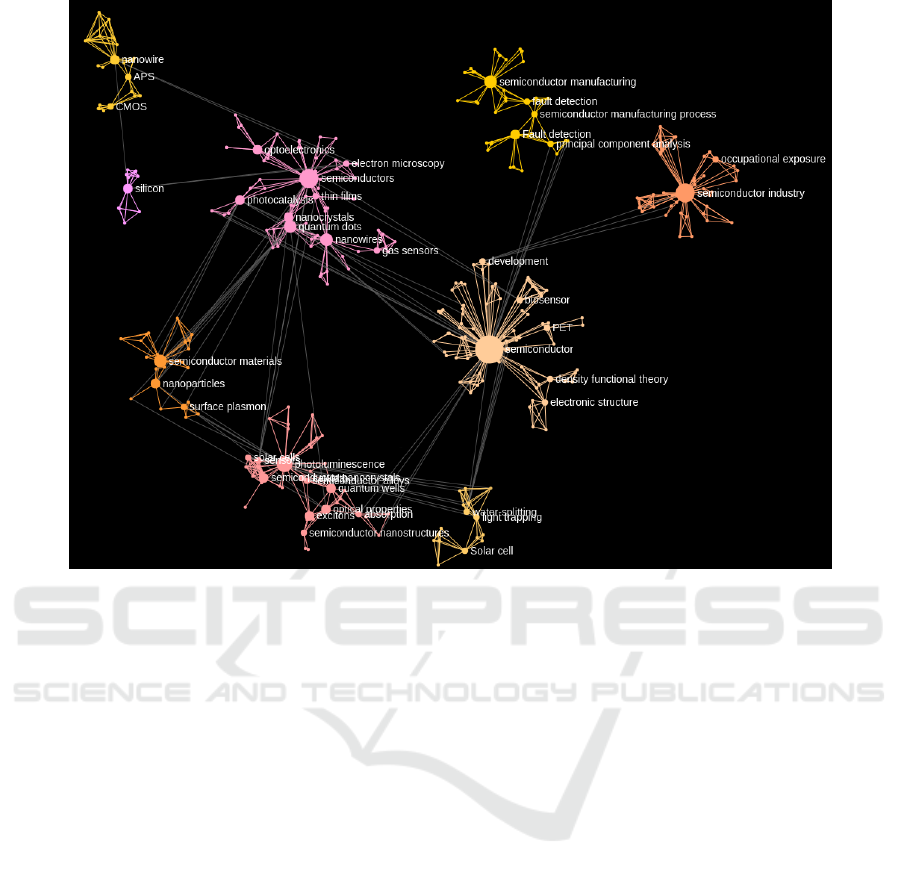
Figure 5: Screenshot of the facet keywords in collaboration spotting. This represents a different view of the same knowledge
graph after a facet switch.
The resulting graph from this user interaction, which
is called navigation in collaboration spotting can be
seen in Fig. 4. The same process can be repeated
with the citation facet. It is notable that the system
does not allow direct connections between the same
type of facet. This means that the citation facet is rep-
resented as a separate type from the publication facet.
In addition, before visualizing the results, the louvain
community detection algorithm (Blondel et al., 2008)
is applied. Fig. 6 shows an example of an author
network for the search of the keyword ”superconduc-
tor”. The user can then either change his view to an-
other facet of the graph or select a subset of the graph
to further explore. Subsets can be either the detected
communities, connected components or one or more
nodes separately selected by the user. Other selec-
tions based on graph metrics would also be possible,
but are not in the system at the moment. This can be
done by coloring based on separate metadata proper-
ties and then selecting on the basis of them. Based on
the selection that the user has made, a new graph is
now created in the same fashion explained in the be-
ginning of this section, but only based on the selected
reference nodes. Changing from the author view with
a subset of central authors, one can arrive at another
facet through navigation, as seen in the collaboration
spotting screenshot seen in Fig. 5. In this way, the
graph selection can be applied to publication, patent
or other highly connected textual data. Another possi-
bility is to combine multiple keyword searches to see
how they overlap or what they have in common. As
the resulting networks are always connected to an en-
try facet, called ”Search”, it is possible to select mul-
tiple ones at the same time, to combine the search re-
sults. Additional descriptions about technical aspects
and mathematical descriptions of the navigation oper-
ations can be found at (Agocs et al., 2017).
3.3 Relevance Feedback
The user can arrive at a entirely new version of the
graph, through the navigation process. This happens
either by filtering by the selection of subsets or by
the combination of multiple searches. With this, the
user might have arrived at a better expression of their
search interest than just their initial keywords or doc-
ument as they can only provide limited information
(no synonyms, user might not know the field well ini-
tially). The system can apply the following relevance
feedback mechanism to the new refined subset of the
graph:
As the central node in the blueprint is always con-
Collaboration Spotting Cite: An Exploration System for the Bibliographic Information of Publications and Patents
551

nected to a text document, we find a vector represen-
tation for each of the documents. For this purpose
document embeddings based on the doc2vec models
(Mikolov et al., 2013), (Le and Mikolov, 2014) were
trained. The training of those document embeddings
for patents and the application to information retrieval
with bibliographic information is described in (Rat-
tinger et al., 2018b), (Rattinger et al., 2018a). The
process for publications is the same as the one for
patents. A separate doc2vec model was trained for
each of the document types. Next, every document
from the graph the user selected is assigned a vector
by the model. A clustering algorithm (Hartigan and
Wong, 1979) is then applied to find clusters of top-
ics. We select the N closest documents for the new
graph, where N is a hyper-parameter defined by the
user. This hyper-parameter will be set automatically
in the future. The newly performed search creates a
new search node to attach the latest retrieved search
results, so that the user can continue his refinement
process as it is possible to repeat the same process as
many times as the user wants.
4 USE-CASE
This section presents a typical use-case in bibliomet-
ric search with collaboration spotting. A subset of
articles is selected based on the user keywords. This
presents the current system and the data which it is
utilized with and shows some of the capabilities in
graph exploration.
4.1 Data
Collaboration Spotting can run on any data-set that
contains highly connected data. Two different types
of data are used in the current version, publications
and patents. The metadata records and textual in-
formation of publications come from the Web of
Science
TM
Core Collection (Analytics, 2017). Patent
texts and data come from the PATSTAT database de-
veloped by the European Patent Office (EPO) (Of-
fice, 2017) and full text documents provided by the
United States Patent Office (USPTO)
1
. The subset
that is chosen for the current system is made up of
all patent documents between 2004 and 2016. This
still provides the system with an enormous amount of
data to work with as it consists out of 2,843,182 doc-
uments for the patents alone.
1
https://bulkdata.uspto.gov/
Figure 6: Sample author network for the search keyword
”superconductor”. All the examples of connected compo-
nents, communities, single nodes or combinations of all
three can be used for further navigation and selection.
4.2 Application
A user searches for a very general abbreviation ”tsv”,
which results in documents from different domains,
notably one domain related to physics called “through
silicon via”, a chip interconnection technique and an-
other topic related to the medical domain called “taura
syndrome virus”. Fig. 7 shows the citation network
resulting from the search. As mentioned before there
are multiple ways to color the nodes, in the example
they were colored by the automatically detected com-
munities. Notable is the big pink community in the
upper left corner. The user can now select a commu-
nity with right-click and switch to another network
view such as the keyword network shown in Fig. 5
or use this new selection to start a new refined search
from the documents referenced by the selection. In
this case all of the communities other than the one that
references “taura syndrome virus” could be chosen.
Fig. 8 shows the keywords of the new selection after
the facet switch has been undertaken from citations
giving an overview which keywords are important for
this particular community of citations. The general
most relevant keywords weighted by tf-idf after this
process also change so they do not include taura, syn-
drome or virus anymore. With this, another search
only based on the most important keywords could be
performed as well.
KDIR 2019 - 11th International Conference on Knowledge Discovery and Information Retrieval
552
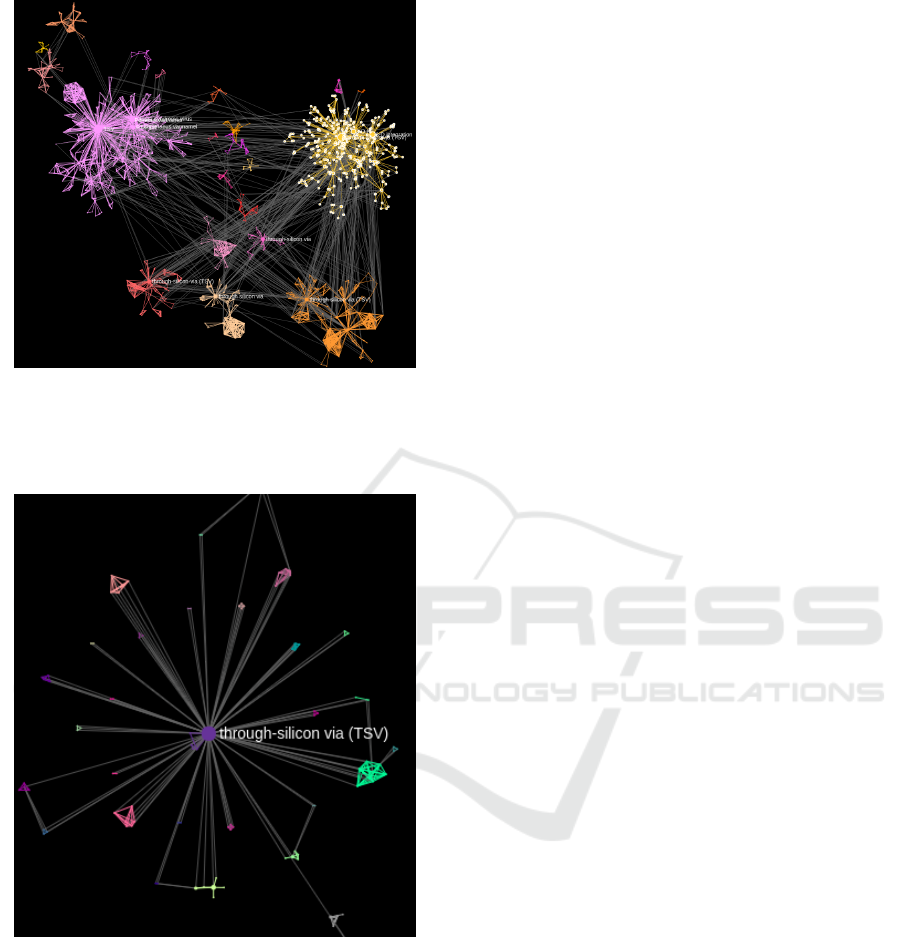
Figure 7: Selection of a community from the search. A
search displays this citation network. In the upper right cor-
ner the user selected a community which should be used for
further navigation or to create a new search based on his
relevance feedback.
Figure 8: Network of the new selection made by the user
included newly calculated communities.
5 CONCLUSION AND FUTURE
WORK
This paper demonstrates the information retrieval and
navigation mechanism of the Collaboration Spotting
web platform. The platform enables its users to ef-
fectively navigate complex data-sets and make use of
the navigation capabilities to refine the search process
and create more relevant search results. This is shown
with a qualitative example of a sample research prob-
lem where a subset based on a community in the cita-
tion graph is chosen to show a more pertinent version
of another facet of the graph, the keyword graph. This
keyword graph can then be used for another retrieval
run based on document embeddings. This refinement
process can be repeated multiple times by the user
to create a better knowledge graph representing the
search interest.
The search functionality in Collaboration Spotting
Cite is still a work in progress, and need to be eval-
uated on a quantitative basis. Some of the optimal
values for the hyper-parameters have to be identified.
The number of relevant documents retrieved by the
relevance feedback method has to be specified by the
user at the moment and could be automated. The
proximity of the embedded documents to the cluster
center or the relevance of the document to the im-
proved search in the ranking would be two methods
for automation. The way to represent the search as
a graph and to utilize this graph to represent the en-
hanced search interest of the user is a novel way to
effectively explore and search even if the user is not
familiar with the explored data or the person is new to
a field and wants to find out the most important con-
cepts, people or institutions.
REFERENCES
Agocs, A., Dardanis, D., Forster, R., Le Goff, J.-M., Ou-
vrard, X., and Rattinger, A. (2017). Collaboration
spotting: A visual analytics platform to assist knowl-
edge discovery. ERCIM NEWS, (111):46–47.
Analytics, C. (2017). Web of science core collection. Cita-
tion database. Web of Science.
Bastian, M., Heymann, S., and Jacomy, M. (2009). Gephi:
an open source software for exploring and manipulat-
ing networks. In Third international AAAI conference
on weblogs and social media.
Blondel, V. D., Guillaume, J.-L., Lambiotte, R., and Lefeb-
vre, E. (2008). Fast unfolding of communities in large
networks. Journal of statistical mechanics: theory
and experiment, 2008(10):P10008.
Cao, G., Nie, J.-Y., Gao, J., and Robertson, S. (2008).
Selecting good expansion terms for pseudo-relevance
feedback. In Proceedings of the 31st annual interna-
tional ACM SIGIR conference on Research and de-
velopment in information retrieval, pages 243–250.
ACM.
Chen, C. (2006). Citespace ii: Detecting and visualizing
emerging trends and transient patterns in scientific lit-
erature. Journal of the American Society for informa-
tion Science and Technology, 57(3):359–377.
Hartigan, J. A. and Wong, M. A. (1979). Algorithm as
136: A k-means clustering algorithm. Journal of the
Collaboration Spotting Cite: An Exploration System for the Bibliographic Information of Publications and Patents
553

Royal Statistical Society. Series C (Applied Statistics),
28(1):100–108.
Le, Q. and Mikolov, T. (2014). Distributed representations
of sentences and documents. In International confer-
ence on machine learning, pages 1188–1196.
Liu, X., Yu, Y., Guo, C., and Sun, Y. (2014). Meta-path-
based ranking with pseudo relevance feedback on het-
erogeneous graph for citation recommendation. In
Proceedings of the 23rd acm international conference
on conference on information and knowledge manage-
ment, pages 121–130. ACM.
Mikolov, T., Chen, K., Corrado, G., and Dean, J. (2013).
Efficient estimation of word representations in vector
space. arXiv preprint arXiv:1301.3781.
Office, E. P. (2017). Patstat - worldwide patent statistical
database.
Ramos, J. et al. (2003). Using tf-idf to determine word rele-
vance in document queries. In Proceedings of the first
instructional conference on machine learning, volume
242, pages 133–142. Piscataway, NJ.
Rattinger, A., Le Goff, J.-M., and Guetl, C. (2018a). Local
word embeddings for query expansion based on co-
authorship and citations.
Rattinger, A., Le Goff, J.-M., Meersman, R., and Guetl,
C. (2018b). Semantic and topological patent graphs:
Analysis of retrieval and community structure. In
2018 Fifth International Conference on Social Net-
works Analysis, Management and Security (SNAMS),
pages 51–58. IEEE.
Rocchio, J. J. (1971). Relevance feedback in information
retrieval. The SMART retrieval system: experiments
in automatic document processing, pages 313–323.
Salton, G. and Buckley, C. (1990). Improving retrieval per-
formance by relevance feedback. Journal of the Amer-
ican society for information science, 41(4):288–297.
Small, H. (1999). Visualizing science by citation mapping.
Journal of the American society for Information Sci-
ence, 50(9):799–813.
van Eck, N. and Waltman, L. (2009). Software survey:
Vosviewer, a computer program for bibliometric map-
ping. Scientometrics, 84(2):523–538.
KDIR 2019 - 11th International Conference on Knowledge Discovery and Information Retrieval
554
