
Preventing Failures by Predicting Students’ Grades through an
Analysis of Logged Data of Online Interactions
Bruno Cabral and Álvaro Figueira
a
CRACS / INESCTEC, University of Porto, Rua do Campo Alegre 1021/55, Porto, Portugal
Keywords: Data Mining, e-Learning, Machine Learning, Online Interaction Comparison, Prediction of Failures, Learning
Management System.
Abstract: Nowadays, students commonly use and are assessed through an online platform. New pedagogy theories that
promote the active participation of students in the learning process, and the systematic use of problem-based
learning, are being adopted using an eLearning system for that purpose. However, although there can be
intense feedback from these activities to students, usually it is restricted to the assessments of the online set
of tasks. We propose a model that informs students of abnormal deviations of a “correct” learning path. Our
approach is based on the vision that, by obtaining this information earlier in the semester, may provide
students and educators an opportunity to resolve an eventual problem regarding the student’s current online
actions towards the course. In the major learning management systems available, the interaction between the
students and the system, is stored in log. Our proposal uses that logged information, and new one computed
by our methodology, such as the time each student spends on an activity, the number and order of resources
used, to build a table that a machine learning algorithm can learn from. Results show that our model can
predict with more than 86% accuracy the failing situations.
1 INTRODUCTION
Nowadays, students are usually evaluated using
online platforms. As such, educators had to change
their teaching methods by making the transition from
paper to digital media. The use of a diverse set of
questions, ranging from questionnaires to open
questions is common in most higher education
courses. In many courses today, the assessment
methodology also promotes the student participation
in “forums”, downloading and uploading modified
files, or even participation in online group activities.
At the same time, new pedagogy theories that
promote the active participation of students in the
learning process, and the systematic use of problem-
based learning, are being adopted using a learning
management system (LMS) for that purpose. While
the interaction between students and the system itself
is being unfolded during the course duration, each
time a student opens a new page or accesses a digital
resource, that action is being logged in the system as
a record that marks the beginning of such activity.
In this article we describe a methodology to
compare students’ interaction patterns during an
a
https://orcid.org/0000-0002-0507-7504
academic course and by using that comparisons to
create the ability of accurately predicting grades. To
access the interactions with the LMS, we utilise the
automatic generated log from the Moodle system. We
use a standard metric to compute how close is an
interaction pattern from one student to another. Then,
we establish a link between each individual path and
the best available matching path. Comparing different
student paths, we can determine the similarity
between them. If a student has a high similarity with
another student who obtained a high final grade, we
can then hypothesise that the first student will
therefore achieve a very similar grade.
The main goal of this study is, therefore, to
establish a comparison between different student
paths and verify if any relation between similarity and
student performance can be established. This study
focuses on the data collected from one single course
over three years, where it is ensured that the teaching
methods, evaluations, teacher and contents were the
same. This selection was done to ensure that the
conditions are similar and that there exists as little
variation as possible in the context settings.
Cabral, B. and Figueira, Á.
Preventing Failures by Predicting Students’ Grades through an Analysis of Logged Data of Online Interactions.
DOI: 10.5220/0008356604910499
In Proceedings of the 11th International Joint Conference on Knowledge Discovery, Knowledge Engineering and Knowledge Management (IC3K 2019), pages 491-499
ISBN: 978-989-758-382-7
Copyright
c
2019 by SCITEPRESS – Science and Technology Publications, Lda. All rights reserved
491

2 BACKGROUND
2.1 Previous Studies
Recent research on learning analytics has focussed on
LMS' data for modelling the student performance to
predict students’ grades and to identify which
students are at risk of failing a course (Romero,
2010), as well as trying to establish a relation between
the participation/usage of an LMS and performance
(Figueira, 2016). Most of these studies focus on direct
features such as total time online, number of clicks,
and some predictors taken from the different modules
used as forums, quizzes, etc (Conijn et al, 2017).
Studies conducted by Gašević (2016), Joksimović
and Hatala (2015) show how a problem can emerge
as data from multiple classes is used to create the
predictive model, as it cannot be ensured that multiple
courses have the same approach and assign the same
significance to the LMS in the learning process.
Naturally, different teachers have different methods
of giving lectures, using online environments, and
their evaluation methodologies. Therefore, we can
conclude that these types of studies, do not ensure that
the data collected for studying maintain a small
variation in the environment in which the data was
collected. Moreover, Conijn (2017) concluded that
the portability of the prediction model between
different courses is not reliable. On the other hand,
they conclude that these types of models can still be
successfully applied to a single course. More recently
(Figueira, 2017a) showed that mining Moodle log
data is a promising way to predict performance, and
that taking into account the online accesses to course
material (Figueira 2017b) emerges as an important
feature in the data mining process to grade prediction.
The work from Romero (2013) inspired our
motivation for this study and emerges from early
detected situations where a student may fail in a
course, but there is still time to circumvent the
problems, provided there is feedback to the student
and the teacher. Lykourentzou (2009) has already
tried to create such a system but, as the used algorithm
was a neural network, the feedback is quite reduced,
being limited to a yes/no black box. Recently, Estacio
et al. (2017) conducted research aiming at
determining whether students’ learning behaviour
can be extracted from action logs recorded by
Moodle. The authors concluded that a vector space
model can be used to aggregate the action logs of
students and quantify them into a single numeric
value. However, they also concluded that there is a lot
of variability in terms of the correlation between
activity level and academic performance.
2.2 Run-Length Encoding
Our approach will rely on a transformation of all the
sequences of activities into strings consisting of
numbers and characters. These strings are then used
to establish a comparison between different students
and assign a score of similarity. The strings are
encoded using a data compression method: “Run-
Length Encoding” (RLE), which is a simple form of
data compression, where "runs" (consecutive data
elements) are replaced by the number of occurrences
and the respective data value.
There are many different compression methods.
Generically, a compression method can have two
types: lossless or lossy. Lossless compression ensures
that none of the original data is lost when it’s
compressed, whereas by using a lossy compression
method some of the original data is lost during the
compression process and cannot be retrieved when
the data is decompressed. Depending on the situation,
there are times when lossy compression is preferable
however, for example, when a smaller file size is
desired or if the data loss is not noticeable. But in
cases where, any type of data loss is unacceptable,
then the lossless compression is preferred even
though the file size is probably significantly bigger.
RLE can also be used to transform several
separate strings into a single string, maintaining the
same level of detail of information but in a much
simpler to use format. That is the extent to which we
will be using RLE encoding. In the case of this study
we converted an interaction path into a string and then
into a RLE-encoded string.
2.3 Comparing the Encodings
One of the objectives of this study is to compare
student interactions. Our framework to create the
comparisons is to place each path as a point in a multi-
dimensional space. By converting an RLE-encoded
string to a point in such multi-dimensional space and
using a distance metric we are able to make the
comparisons. In this study we used the Euclidean
Distance.
The Euclidean Distance represents a straight line
between two points, present in a Euclidean Space
(Breu et al, 1995). This distance is equal to the root of
square difference between coordinates of a pair of
objects.
The distance between points is therefore the
similarity between them: the smaller the number is,
the closer the points are and by extension the similar
the paths.
KDIR 2019 - 11th International Conference on Knowledge Discovery and Information Retrieval
492

3 PREPARING THE DATA
3.1 Course, Population and Dataset
The undergraduate, first-year, course of “Technical
Communication” (DPI1001) was used as a case
study. It is part of a bachelor's degree course in
Computer Science. The main objective of this course
is to prepare students to communicate using different
means: through articles, reports and thesis; to assess
other articles, to create electronic presentations e to
communicate orally their research findings or
surveys. While electronic and oral presentations are
evaluated manually, the written texts and their
assessment by the peers are done using the
“workshop” activity in the Moodle system. DPI1001
also uses tests in the form of quizzes.
The course data is composed of 522 students
enrolled between the years 2016 and 2018, with an
average of 174 students per year. The logs provided
by the Moodle system are comprised of a total of
90416 records, where each record described an action
taken by a student. The sample contains all the
information automatically registered by the platform,
about all the activities and resources the students used
during the 2015/16, 2016/17 and 2017/18 school
years.
3.2 Understanding the Logs
The dataset is originally comprised of nine fields,
which are automatically generated by Moodle.
Time and Date of Entry, in the format
dd/mm/yyyy, hh:mm (25/12/17, 18:42);
User’s Full Name, represents the full name of the
student that performed the action;
Affected User, if an action affects a given user,
the name of the affected user is registered;
Event’s Context, the name of the activity in
which the action occurred (Page: Evaluation
Components);
Component, indicates which component this
event is associated to (Page);
Event’s Name, (Course module viewed);
Description, a more extensive description of what
happened (The user with id '23075' viewed the
'page' activity with the course module id '80587'.)
Source describes the type of device used to access
the system.
IP Address, the IP address of the caller.
3.3 Date Split and Transformation
The initial fields and the information contained in
each one are insufficient to describe online
interactions in a manner that can give insights about
attitudes and usage patterns. Therefore, more fields
were created, by extracting new information directly
from the log files. A new set of 14 fields were created
during this transformation, bringing the total to 22.
One example is the split of the time into three distinct
fields.
3.4 Activity/Resource Identification
Just as the Time field has been divided into three
components (year, day/month, start time), the same
logic was applied to the field Description, in order to
identify the activities and resources being used. The
Description field is a sentence that contains on itself
information to identify a student (Student Nr), the
action that occurred in the system (Action), which
activity was accessed by that action (Activity,
Affected Activity), the activity id (Activity Id) and its
name (Activity Name).
One of the characteristics of the text contained in
the Description field, is that the written text follows a
given pattern which allow us to decompose the
sentence in the above six components.
As an example, consider the following sentence:
«The user with id '23127' viewed the 'page'
activity with the course module id '80587'»
The referred pattern ensures that the first and last
element located between two apostrophes is the
Student’s Nr and Activity Id respectively. Using the
Activity Id and a database of activities we created, we
obtain the Activity Name. Everything before the
Students Nr and after Activity Id is irrelevant and
therefore can be removed.
Hence, the remaining sentence is:
«viewed the 'page' activity with the course
module id»
The pattern establishes that the first word in this new
sentence is the Action that was logged. At the same
time everything following the last "the" is the
Affected Activity. By removing these elements, we
get the remaining sentence:
«'page' activity with»
Lastly by removing the "with" word we get the
Activity.
Therefore, the decomposition of the original sentence
generates the following fields.
Students Nr, 23127;
Preventing Failures by Predicting Students’ Grades through an Analysis of Logged Data of Online Interactions
493

Action, viewed;
Activity, page activity;
Affected Activity, course module id;
Activity Id, 80587;
Activity Name, Final Grades.
3.5 Computing Activities’ Duration
Moodle is not able to keep a record of when a user
has left a web page. Hence, it is not able to determine
how much time a student spent in that session. This
implies that in order to determine the time spent in an
activity (Session Duration), and the finishing time, we
must perform some computations and use heuristics.
We present the generic algorithm to compute
these values from the logs.
Listing 1: Algorithm to compute activity duration.
For i = 0 To allRecords
If entry
i
.
viewed = FALSE Then
For j
= i – 1 DownTo 0
If entry
j
.name = entry
i
.
name Then
dif entry
j
.start – entry
i
.start
If dif ≤ 6 hours Then
If dif ≤ 30 mins Then
entryᵢ.duration dif
entryᵢ.end entry
j
.start
entryᵢ.session_duration dif
Else
entryᵢ.duration 30 mins
entryᵢ.end entry
i
.
start + 30 mins
entry
j
.viewed TRUE
Else
Break
For i = 0 To allRecords
If entryᵢ.duration = EMPTY Then
For j
= 0 To allAverageRecords
If entryᵢ.acvity = average_acvity
j
.acvity Then
entryᵢ.duration average_acvity
j
.
duration
entryᵢ.end entry
i
.
start + entryᵢ.duration
These time registers, Session Duration and End Hour,
are related because the latter helps to determine the
first. The program runs through the dataset, from the
current position to position 0. When an entry is found
with the same Student Nr (entry
j
) as the one searched
for (entry
i
), a check is made to ensure that no more
than 6 hours have elapsed between the two entries.
Only in this case is the subtraction between the Start
Hour found (entry
j
.start) with the Start Hour
(entry
i
.start) of the entry sought. Subsequently, the
result is added to the Session Duration field of the
requested entry (entryᵢ.duration). The End Hour of an
entry (entryᵢ.end) is then calculated by adding the
Start Hour with Session Duration. If there’s no value
associated with the Session Duration, because it
exceeded the six-hour limit, then the average amount
of time spent in that activity (average_acvity.duration)
is assigned. This value is determined by calculating
the average time spent, by the students in that activity.
The average time spent in each activity is in a separate
dataset that originates from the analytical studies
performed on the initial dataset.
3.6 Computational Heuristics
For the computation of session duration, we created
three fields that are used only to speed up the
calculations and the subsequent generation of graphs.
These are the Viewed, Maintained in Activity and
Session Length fields. The first two are Boolean
values, initialized with False.
The Maintained in Activity only becomes True if
the Session Duration is less than or equal to 30
minutes. This time was considered enough to ensure
that the student remained in session, in other words,
if there is no other entry (no other interaction with the
system) we assume that the maximum time spent in
an activity is 30 minutes. This value originates in
analytical studies done on the dataset and also from
the insight /experience of the teacher who lecture the
course.
The Viewed field serves to assist in the process of
determining the Duration Time. When a given entry
is used to determine the Session Duration of another
entry, the value of the Viewed field becomes True,
which ensures that this registry will never be used
again, thus reducing the possibility of errors
occurring in the determination of Session Duration. If
the Session Duration is less than or equal to 30
minutes, this value will occupy the equivalent Session
Length. This measure serves to ensure that this new
field can be obtained, containing the actual duration
of the session. This information is essential for the
creation of a forecast and graphics model to predict
grades as we can later see on Figure 3.
3.7 Data Cleaning and Preparation
As it happens in many data mining processes, not all
records are useful for feeding a machine learning
model because they contain errors, missing values,
etc. In our case we had drop several records as well:
actions performed by the teacher or by courses
assistants. We also removed entries related to
students that dropped the course, for several reasons
not necessarily due to the course itself. This kind of
data was, therefore, removed because it wouldn’t
contribute with any relevant information to the
generation of a predictive model.
The final step is to organize the data, where we
sorted all records to ensure that the entries for the
KDIR 2019 - 11th International Conference on Knowledge Discovery and Information Retrieval
494

same students are clumped together and sequential.
This process also provides insight on what is relevant
to detect anomalies in the interactions. Our sorting
order will group all entries by the student name, by the
year and by the date in ascending form, ie the first
record of a student in the dataset always corresponds to
the first entry that he made, all the following entries
correspond to the rest of the activities throughout the
school year, with the first entry being the earliest and
the last being the most recent entry.
4 THE FEATURES
4.1 Features
The exploratory analysis of the new aggregated data
(described in the previous section) provided insights on
which features to choose to build the predicting model.
A total of 20 features raised from this study. We
describe each one in the next subsections.
4.1.1 After Time (AT)
Feature “After time” counts the number of minutes to
access an activity after it was made available. In the
case of DPI1001, is divided in AT1 and AT2. While
AT1 focus on the “Group Choice” activity, AT2 focus
on “Registration for oral presentation”.
4.1.2 After Being Available (AV )
Feature “after being available” counts the number of
days a student took to access an activity after it was
made available. It tracks the lecture handout activities
and determines how many days it took the student to
access those resources. In the case of DPI1001, this
feature is split in AV1, AV2 and AV3 referring to three
lecture handouts.
4.1.3 Before Test (BT)
This feature is sub-divided into BT1, BT2 and BT3.
Each one indicates the number of days, between the
first access to “Lecture 01”, “Lecture 02”, “Lecture
03”, and the day of the corresponding tests, “Quiz 01”,
“Quiz 02” and “Quiz 03”, respectively.
4.1.4 Clicks, Download and Forum
Clicks registers the total number of clicks made by the
student while using the platform. Download records
the number of lecture materials downloaded by the
student. Forum counts the number of entries related
with the use of the Forum activity.
4.1.5 Test Time (TT)
Test Time indicates the number of minutes that a
student spent on a test. In the case of DPI1001 it has 3
instances, one for each of the three quizzes taken
during the course.
4.1.6 Time in or out of Danger Zone
(TIDZ/TODZ)
TIDZ and TODZ, represent the number of times that
submissions occur in or out of the “danger zone”,
defined as being the last 10 minutes before a deadline.
As there are two submissions in the DPI 1001 course,
there exists two TIDZ and two TODZ, which are
related to the “article” submission and the “electronic
presentation” submission.
4.1.7 Total Time Online (TTO)
The total amount of minutes that a student spent
actively using the platform.
4.1.8 Total
Feature Total is a special case. It relates to a process of
comparing different online interaction paths and is
explained in depth in Section 5.
4.2 Correlation Analysis
A correlation matrix for the whole set of features was
then generated by comparing every feature with all the
remaining features. Each cell in the matrix shows how
high the correlation between the two is. If a cell in this
matrix has a value higher than 30%, we can assume
that the two features are related. In these situations, it
is advisable to remove high-correlated data to prevent
bias in the results.
As depicted by the correlation matrix, in Figure 1, a
total of five features, AV1, AV2, TotalTimeOnline,
Clicks and Download, were considered too similar
when compared to the remaining features. These
features had a correlation higher than 30% and
therefore were excluded.
The remaining features were considered valid to help
the model to determine what the final grade of the
student will be, based on his interactions with
Moodle. From the original 21 features, 5 were
removed for being highly correlated. These resulting
17 features are then applied to the decision tree,
which only used 9 features.
Preventing Failures by Predicting Students’ Grades through an Analysis of Logged Data of Online Interactions
495
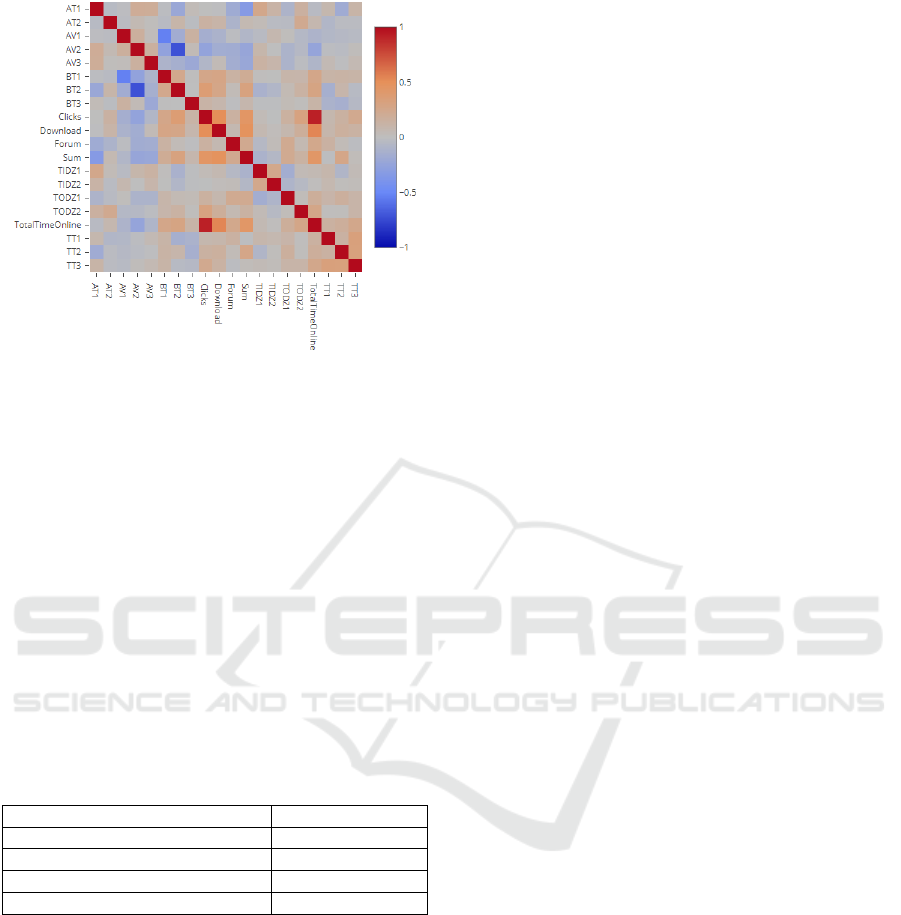
Figure 1: The Correlation Matrix.
5 RUN-LENGTH ENCODING
THE ACTIVITIES
5.1 Pre-encoding
By studying the transformed log files that indicates
the amount of time, number of visits per activities as
well as the insight of the teacher that lectured the
course, we were able to identify which activities were
the most impactful for the grades. From those studies
10 types of activities were identified has being the
most influential in the final grade of a student. We
identify each one in Table 1.
Table 1: Activities’ Types.
Lecture 00
Lecture 01
Quiz 01
Lecture 02
Quiz 02
Lecture 03
Quiz 03
Group Choice
Article Submission and Revision
Final Grades
For easier identification each activity is given a letter
as a label (A,B,C…J).
5.2 Time Frame
In our institution, the second semester is comprised of
103 days. Therefore, in order to do a full and
extensive comparison, the days considered, by each
student, will encompass Day 1 up to Day 103. This
time frame was preferential, when compared to the
one that only considers the days in which students
have executed an action, because it ensures that every
single student has the same number of days in the log
and, therefore, allows accurate comparisons between
students.
5.3 Different Scenarios
After the encoding was done, three distinct types of
entries, were identified:
Type Done, describes the times when a student
visited a certain activity or activities and, all or just
some of them happened to be of the same category as
those already defined. The output generated is a
number followed by a letter; this sequence is then
repeated n times, in which n ϵ {1, 2, …, 10};
Type Empty is the most common type, it is used
when the students don't have any registered entry for
that day, this happens when the platform was not used
on that day and therefore no record is present. It is
represented by using a blank space;
Type Not Done, this type occurs in situations in
which the students visited one or more activities on
that day, but this activity was not present in the
categories previously defined in Table 1.
6 COMPARISONS
The comparisons between student's interaction
patterns bases itself on the assumption that a sequence
of activities done by a student with a high final grade
when compared with any other that follows this same
sequence, results in a high grade.
Therefore, we compare every student x with any
other student that got a high grade (in our case, higher
than 17, out of 20). Let us set HG as the group of
students’ in those conditions. Then, the comparison
allows us to verify if the sequence of activities taken
by student x is similar to the one taken by any student
y ϵ HG. After comparing the interaction sequence of
two students, x and y, the resulting numerical value
that measures the difference between them indicates
if the predicted final grade of student x might also be
high.
6.1 Measuring the Interaction Distance
The metric used for measuring the interaction
distance is based on the concept of distance in a multi-
dimensional orthogonal space. The data associated to
every day is converted into a point format so that it
can be applied to a 10-dimension space (the number
of relevant activities and resources).
This transformation follows the simple method of
assigning a coordinate to every type of activity and
KDIR 2019 - 11th International Conference on Knowledge Discovery and Information Retrieval
496

then replacing the position of said coordinate with the
amount of time that the student spent there.
We exemplify this situation by taking the
following RLE string: 1A33C12J, which describes a
sequence of interactions and time spent with them.
Our transformation of this string will generate the
point (1,0,33,0,0,0,0,0,0,12). This process is then
applied to every entry in our database.
Having a string transformed into a point
belonging to a n-dimensional space, the Euclidean
distance can then be used for comparisons between
points of that space. The computed distance between
two points is a measure of proximity in the interaction
patterns: the smaller the distance, the closer the points
are to each other; in turn this indicates if a given
sequence is, or not, similar to another.
Applying this process to student x, will allow the
comparison between student x and all the students y ∈
HG. Once terminated the process, we can identify the
student y, who has an interaction path that most
closely reassembles that of student x.
6.2 Comparing Interaction Sequences
After having identified the best y with which to make
a comparison to, the comparison is actually made.
Applying the mathematical formula bellow (1) we
calculate the variation that occurred in a single day of
Student x when compared to his ideal match in the
HG set.
Comparisons account for the amount of different
activities a student visited – α – and how much time
he spent in every activity when compared to the
closest match (Δt). Which is then divided by the
number of minutes in a day.
∑(𝛼 +
Δ𝑡
3600
)
(1)
Basically, a small number means a smaller
deviation from the ideal path taken by a high grader,
hence, the bigger the probability of student x
achieving a good grade.
A side by side comparison is then done between
the two encoded strings. One being the one we are
classifying and the other one the one that most closely
resembles the first and that got a high-grade.
Example 1.
In this case let’s suppose both students visited the
same activities, so α will be 0 since every activity is
the same. Let us suppose that the sequences to
analyse are x = 12A56B6C and y = 11A64B7C. Then, by
applying the formula (1), we obtain a score ≈ .00278.
Example 2.
Let’s assume there are some differences between the
two sequences. For example, the compare sequence is
missing a big portion of its elements. Suppose we
have the sequences x = 6A38C13G and y = 64C. As
those elements are missing α will be given a value of
2, because activities A and G are missing in the
second sequence. Then term Δt will be calculated by
subtracting the matching sequences and then by
adding the time spent on the remaining unmatched
sequences. Then, by applying the formula (1), we
obtain the score ≈ 2.0125.
6.3 Aggregation of Similarities
In the end, the values obtained for each day are
summed up and the resulting total is the new feature
“Total”. The smaller the value, the closer is that
student's activity sequence to the student in the HG
set, with which the comparison was made. Therefore,
it will be higher the probability of him having a better
grade.
7 THE PREDICTING MODEL
Our goal with this methodology is to predict the grade
of a student having as a base his online interaction
with the learning management system.
However, this is to serve the student by giving
him, and the teacher, a tool that can issue a warning
when and if he is taking a set of interaction patterns
that can lead him to fail the course.
Therefore, our target variable doesn’t need to have
all values as the evaluation scale in the Institution. We
would only need to define two categories: failing and
not failing. Moreover, the model is blind to
classifications given in intermediary evaluations of
students as it only focusses on the interaction patterns
with the Moodle system.
Hence, we created three categories for resulting
grade, as described in Table 2. By grouping the grades
in this way, we define Class A as being a potential
failing grade, Class B as a “border line” grade
because the student can swap from a failing/passing
grade very easily and, Class C as a “safe situation”,
which indicates a healthy behaviour concerning the
interactions taken with the system.
Table 2: Categories and Grade distribution.
Category
Grade Interval
A
1 – 8
B
9 – 11
C
12 – 20
Preventing Failures by Predicting Students’ Grades through an Analysis of Logged Data of Online Interactions
497
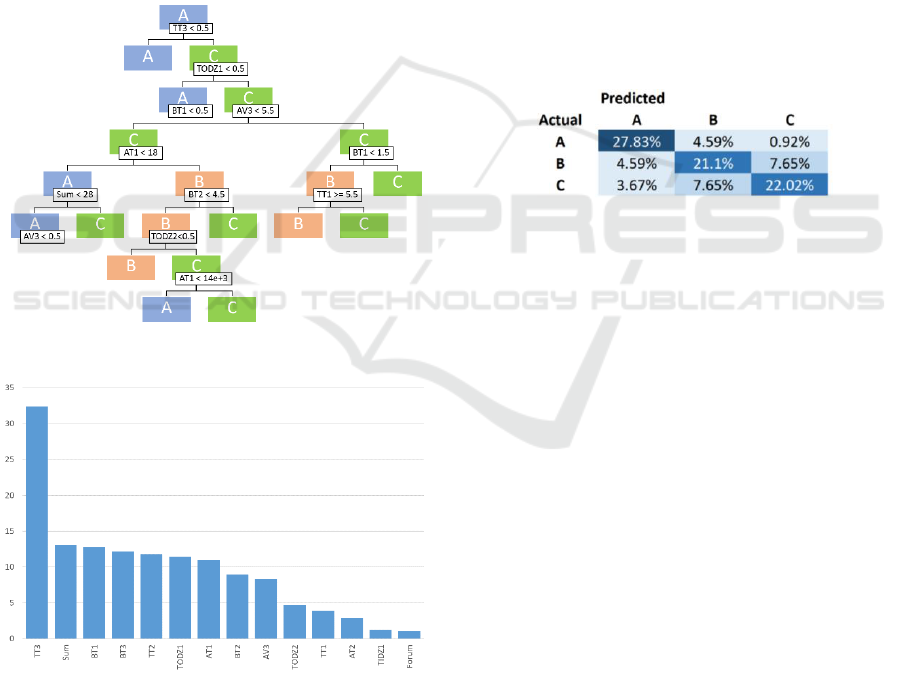
Once defined the target variable a decision tree
algorithm was applied to the dataset using the three
categories as a target variable and the features as
predictor variables.
Using the package 4.1-13 of R and the
Exploratory, tool, version 5.0.3, we generated the
decision tree for this dataset (depicted in Figure 2)
and determined the relative importance of all the
features, as can be seen in Figure 3.
Interestingly we see that the tree used some
features (early submissions, avoid danger zones)
which are in line to the findings of Mlynarska et al.
(2016).
We can observe that every class is represented,
and we are able to analyse the prediction process by
identifying which features are used to predict the
grade and assess the situation of a given student.
Figure 2: The final generated decision tree.
Figure 3: Relative importance of the used features.
Furthermore, in Figure 3, which shows the relative
importance of each feature, we can determine that
although TT3 is classified as being the most
important in the predictive process. Sum, BT1, BT2,
TT2, TODZ1, AT1, BT2 and AV3 are also important
in the process of distinguishing between the three
situations.
Figure 4 shows that the model is accurate when
predicting failing grades (class A) also presents a high
accuracy when trying to predict low and high passing
grades, class B and C, but it also shows that the model
sometimes is confused when trying to classify a
student grade as being type B or C. This situation is
due to some similarities in the behaviour of both
student groups.
Based on the results from TP, TN, FP, FN (not
represented due to lack of space) we obtained the
following accuracy, precision, recall and f1-score.
The model presents on average a high F-score
(70.8%) and accuracy rate (80.6%), meaning it is able
to predict the actual results of the class given a set of
features. The high recall (70.9%) and precision rate
(70.8%), show that the model is capable of generate
results that are relevant. A low misclassification rate
(19.3%) ensure that the prediciton made by the model
are the correct ones.
Figure 4: Assessment of the predictive quality.
All this factors show the quality of the model, which
can be classified as being accurate and competent,
whith high chance of predicting the correct final
grade, given a dataset of students and their behaviour.
8 CONCLUSION
In this paper we presented a system capable of
predicting if a student will potentially fail in a course,
by looking at his online interaction behaviour in that
course. The system uses features taken from past
student experiences and uses a machine learning
algorithm which was fed with three years of students’
online interactions.
By applying the features to a decision tree
algorithm, we ranked the importance each feature has
in the predictive process. The obtained results during
the evaluation of the obtained decision tree, clearly
show that the system is indeed effective at identifying
students who are at risk of failing the course.
In the paper we described the transformations
applied to the original data in order to extract more
precise information regarding student’s online
actions and access to resources in the learning
KDIR 2019 - 11th International Conference on Knowledge Discovery and Information Retrieval
498

management system, and to compute some “hidden”
information like the duration of activities. In the end
we submitted a 17-feature matrix with more than 300
observations to create a decision tree model capable
of predicting final grades on a 3-point scale. This
scale was created to highlight a) the problematic
grades that need attention by the student and the
teacher, b) the fail-or-pass situations, for warnings,
and c) all the rest.
The evaluation of the model allows us to conclude
that the predictive model achieves all its proposed
goals. In particular, the model can identify the three
defined situations with a good average accuracy
(above 70%). Furthermore, the quality of the
predictions for the lower grades (class A), where the
model is most needed, achieve an accuracy above
86%.
The achieved results from the evaluation of the
model are quite promising to continue this research
path to create automatic systems that can raise
warnings and forewarning both to students and
teachers about academic behaviours that can
potentially lead to failing situations.
ACKNOWLEDGEMENTS
This work is financed by National Funds through the
Portuguese funding agency, FCT – “Fundação para a
Ciência e a Tecnologia”, within the project:
UID/EEA/50014/2019.
REFERENCES
C. Romero and S. Ventura, "Educational Data Mining: A
Review of the State of the Art," in IEEE Transactions on
Systems, Man, and Cybernetics, Part C (Applications
and Reviews), vol.40, no.6, pp. 601-618, Nov. 2010.
Dragan Gašević, Shane Dawson, Tim Rogers, Danijela
Gasevic, Learning analytics should not promote one
size fits all: The effects of instructional conditions in
predicting academic success, The Internet and Higher
Education, Volume 28, Pages 68-84, 2016.
Estacio, R. and Raga Jr, R. (2017), "Analyzing students
online learning behavior in blended courses using
Moodle", Asian Association of Open Universities
Journal, Vol. 12 No. 1, pp. 52-68.
https://doi.org/10.1108/AAOUJ-01-2017-0016.
Figueira, A (2016). Predicting Grades by Principal
Component Analysis A Data Mining Approach to
Learning Analyics. 2016 IEEE 16th International
Conference On Advanced Learning Technologies
(ICALT), Book Series: IEEE International Conference
on Advanced Learning Technologies, 465-467 (3).
Figueira, A (2017a). Communication and resource usage
analysis in online environments: An integrated social
network analysis and data mining perspective. 2017
IEEE Global Engineering Education Conference,
EDUCON 2017, Athens, Greece, April 25-28,
2017, Book Series: EDUCON, 1027-1032.
Figueira, A (2017b). Mining Moodle Logs for Grade
Prediction: A methodology walk-through. Proceedings
of the 5th International Conference on Technological
Ecosystems for Enhancing Multiculturality, TEEM
2017, Cádiz, Spain, October 18 - 20, 2017, Book
Series: TEEM, Part F132203(44), 44:1-44:8.
H. Breu, J. Gil, D. Kirkpatrick and M. Werman, "Linear
time Euclidean distance transform algorithms" in IEEE
Transactions on Pattern Analysis and Machine
Intelligence, vol. 17, no. 5, pp. 529-533, May 1995.
Lykourentzou, I., Giannoukos, I., Mpardis, G.,
Nikolopoulos, V. and Loumos, V. (2009), Early and
dynamic student achievement prediction in e-learning
courses using neural networks. J. Am. Soc. Inf. Sci., 60:
372–380. doi: 10.1002/asi.20970.
Młynarska, Ewa, Derek Greene, and Pádraig Cunningham.
"Indicators of good student performance in moodle
activity data". In arXiv preprint arXiv:1601.
02975 (2016).
R. Conijn, C. Snijders, A. Kleingeld and U. Matzat,
"Predicting Student Performance from LMS Data: A
Comparison of 17 Blended Courses Using Moodle
LMS" in IEEE Transactions on Learning Technologies,
vol. 10, no. 1, pp. 17-29, 1 Jan.-March 2017.
Romero, C., Espejo, P. G., Zafra, A., Romero, J. R. and
Ventura, S. (2013), Web usage mining for predicting
final marks of students that use Moodle courses.
Comput. Appl. Eng. Educ., 21: 135–146. doi:
10.1002/cae.20456
Srećko Joksimović, Dragan Gašević, Thomas M. Loughin,
Vitomir Kovanović, Marek Hatala, Learning at
distance: Effects of interaction traces on academic
achievement, Computers & Education, Volume 87,
Pages 204-217, 2015.
Preventing Failures by Predicting Students’ Grades through an Analysis of Logged Data of Online Interactions
499
