
The Added Value of OLAP Preferences in What-If Applications
Mariana Carvalho and Orlando Belo
ALGORITMI R&D Centre, Department of Informatics, School of Engineering, University of Minho,
Campus de Gualtar, 4710-057, Braga, Portugal
Keywords: Business Intelligence, What-If Analysis, On-Line Analytical Processing, Usage Preferences, OLAP Mining,
Multidimensional Databases, Hybrid Methodology, Decision-making Process.
Abstract: These days, enterprise managers involved with decision-making processes struggle with several problems
related to market position or business reputation of their companies. Collecting data and retrieving high-
quality set of information is one of the main priority tasks of enterprise managers involved in decision-making
processes. To overcome the difficulties that may arise from market competitiveness and gain some kind of
competitive advantage, it is important that these managers make the most of adequate tools in order to get the
right set of highly refined information. What-If analysis can help managers getting the competitive advantage
they need. It allows for simulating hypothetical scenarios and analyzing the consequences of specific changes
without harming business activities. In this paper, we propose a hybridization methodology, which combines
What-If analysis process with OLAP usage preferences, for optimizing decision processes. We present and
discuss the integration of OLAP usage preferences in the conventional What-If analysis with a case example.
1 INTRODUCTION
The incredible growth in gathering electronic data
and the increase competitiveness in business
environments are important factors to consider in
knowledge-based society. Companies need to make
better use of analytical information systems,
techniques and models for multidimensional data
exploration and analysis, trying to gain competitive
advantages from a better use of knowledge. An
increasing number of companies need to obtain
relevant information using tools and business data for
reducing redundant information, increasing profits
and saving time, reducing waste and optimizing
decisions. There has been a noticeable increase in the
number and quality of data retrieving and handling
processes created, developed or used by companies.
On-line analytical processing (OLAP) is one of
the most important tools used by companies in
decision-support systems. Navigating in
multidimensional data using OLAP operators allows
for exploring and analyzing data stored in high-
specialized structures: cubes. OLAP tools provide
means for business analytics as well as
multidimensional view over business data that are
very efficient logical ways for analyzing businesses
activities. A decision-support analysis process is an
interactive exploration of multidimensional
databases, often performed in ad hoc manner
allowing users to see data from different perspectives
of analysis. OLAP supports quite well decision
process, but it is not capable of giving anticipations
of future trends. What-If analysis (Golfarelli et al.,
2006) technology helps filling this gap. The OLAP
cube (Harinarayan et al., 1996) is the most adequate
data structure for supporting a What-If simulation due
to its characteristics (Golfarelli et al., 2006). It is a
well-known data structure for supporting information
analysis, being capable for representing historical
trends supporting information at different abstraction
levels.
The process of What-If analysis allows for
analyzing possible effects in the behavior of the
business caused by changing the variables’ values.
These effects cannot be noticed with a manual
analysis of historical data. What-If analysis permits
decision makers to manipulate parameters to make
hypothetical scenarios and get better decisions. In
other words, What-If analysis helps decision makers
for assessing beforehand what can happen in complex
systems as result of changing what can be consider a
normal business behavior. This technology is useful
because they can make decisions according to the
results without endangering the real business and get
What-If analysis scenarios for testing and validating
their business hypothesis to support their decisions.
In fact, What-If analysis can be a safer solution for
addressing any doubt and ensuring, if possible, that
Carvalho, M. and Belo, O.
The Added Value of OLAP Preferences in What-If Applications.
DOI: 10.5220/0008354301710180
In Proceedings of the 11th International Joint Conference on Knowledge Discovery, Knowledge Engineering and Knowledge Management (IC3K 2019), pages 171-180
ISBN: 978-989-758-382-7
Copyright
c
2019 by SCITEPRESS – Science and Technology Publications, Lda. All rights reserved
171

the subsequent decision will have some success.
Moreover, it allows for analyzing different scenarios
and perspectives of business, anticipating some
solutions.
Usually, the lack of user’s expertise during a
What-If design and implementation is one of the
pitfalls of the What-If analysis process. A user, who
may not be familiar with the What-If process or even
the business data, probably will not choose the most
correct parameters in an application scenario, leading
to poor results and inadequate outcomes. One
possible solution is to integrate OLAP usage
preferences (Golfarelli and Rizzi, 2009) (Jerbi et al.,
2009) in this process. In OLAP platforms, when
performing complex queries, it is likely that the
outcome will be a huge volume of data that may be
quite difficult to analyze. With OLAP usage
preferences, it is possible to filter the volume of data.
The returned data is adjusted to the users’ needs and
to the business requirements without losing data
quality. The extraction of OLAP usage preferences
according to each analytic session promoted by a user
may come as an advantage to decision-makers, since
it provides a very effective way to personalize the
outcome of queries of analytical sessions and
multidimensional data structures acting as their
decision-making support. OLAP preferences can
recommend axis of analysis that are strongly related
to each other, introducing helpful and useful
information to the application scenario under
construction.
The hybridization process (Carvalho and Belo,
2016) consists in the integration of the OLAP usage
preferences in the conventional What-If scenarios.
The hybridization process can suggest OLAP
preferences, providing the user the most adequate
scenario parameters according to its needs and
making What-If scenarios more valuable. Therefore,
in this paper, we propose a recommendation
methodology for assisting the user during the
decision-support analysis process; we present and
discuss the integration of OLAP usage preferences in
conventional What-If scenarios and present a case
example that illustrates the proposed hybridization
methodology. The remaining part of this paper
presents an overview about the importance of What-
If analysis and its application (Section 2), describes
the authors’ methodology and also show how the
What-If scenarios are created and enhanced using the
extracted OLAP preferences (Section 3). Next, in
section 4, a case example using the proposed
methodology is presented and analyzed, and with a
developed software platform, we show how the
process works, showing all the steps between the
extraction of the rules until the definition of the What-
If scenario. Finally, section 5 concludes the paper and
discusses some possible future research directions.
2 RELATED WORK
Over the last decade, the evolution of What-If
analysis was remarkable, as evidenced by several
papers that were published during this period.
Golfarelli et al., (2006) are a landmark in What-If
analysis. The authors present What-If analysis as a
solution methodology for the resolution of problems
in a business intelligence context. They analysed and
discussed some of the lessons learned and the
experience obtained after using What-If projects in
real business processes, where they found immature
technology, complexity of design and lack of design
methodology. They also suggest several tools that
present What-If features that help to ease users’
problems.
Kottemann et al., (2009) addressed unaided
decision support systems and decision support
systems aided with What-If analysis. These authors
presented a formal simulation approach, comparing
unaided and aided decision-making performance.
They verified that the performance differences
between the two cases are significant, concluding that
the effectiveness of the decision making strategies is
dependent on the environmental factors and on the
supporting tools; and though What-If analysis is very
helpful and popular in decision making, it is not 100%
effective. In the same year, Zhou and Chen (2009)
addressed What-If analysis in Multidimensional
OLAP environments. They paid special attention to
storage and organization of hypothetical modified
data, when dealing with What-If analysis, because
some cells of the data cube may change over time.
The solution proposed by Zhou and Chen (2009)
consists in storing the new hypothetical modified data
into a HU-Tree data structure (variant of r*-tree). This
allows for storing and managing hypothetical
modified cells using the hypothetical cube, instead of
modifying the original cube directly. When a What-If
analysis is processed, the original cube and the What-
If cube are manipulated simultaneously. In the next
year and following their previous work, Golfarelli
and Rizzi (2010) focuses on the resolution of a
particular problem of a real case study using the
What-If methodology they proposed before. In this
paper, they mainly focused on getting a precise
formalism for expressing conceptually the simulation
model. They achieve a simulation model that satisfies
several issues; for instance, with their methodology,
KDIR 2019 - 11th International Conference on Knowledge Discovery and Information Retrieval
172

they can model static, functional and dynamic aspects
in an integrated fashion, combining use cases, class
and activity diagrams, build specific What-If
constructs using the UML stereotyping mechanism,
and get multiple levels of abstraction using YAM2.
Later, Gavanelli et al. (2012) suggested
improving the traditional What-If analysis process,
typically based on a “generate and test” paradigm, by
integrating a combinatorial optimization and
decision-making component, which helps in
enriching and identifying the most interesting What-
If scenarios, which are then used when performing the
simulation. The authors apply their methodology in
social policy making. In the next year, Xu et al.
(2013) presented a specialized work that mainly
focused on improving the performance of What-If
query processing strategies for Big Data in an OLAP
system. They aimed to improve the classical delta-
table merge algorithm in the process of What-If,
taking advantage from the MapReduce framework.
Also, they explain a What-If algorithm of
BloomFilterDM (Bloom filter-based delta table
merging algorithm) and What-If algorithm of
DistributedCacheDM (distributed cache-based delta
table merging algorithm). Next, Hung et al. (2017)
presents a work that aims to address the What-If
analysis process when there are conflicting goals, i.e.,
multiple goals that are contradictory between each
other. The authors propose the use of data ranges for
the input scenario parameters in the What-If
simulation, for limiting the number of scenarios
explored. They present several ways for optimizing
input parameters to get a What-If analysis outcomes
that balances the conflicting goals.
What-If analysis has been widely used in several
areas, and it proved to be a useful technique for BI,
like data warehouses, relational databases and OLAP
cubes. Deutch et al (2013) described the Caravan
system, which was developed for performing What-If
analysis. With this system, it is possible to users to get
a personalized session, oriented to their needs,
displaying only relevant data and exploring different
answers within computed views. The novelty of this
system is the use of Provisioned Autonomous
Representations (PARs) to maintain the necessary
information of the What-If scenarios instead of
preserving the entire source database. Saxena et al.
(2013) aimed to use in-memory What-If analysis
using a query system to introduce new values. They
aimed essentially to maintain intact the real data cube,
not changing it, by introducing new values for
dimensions and measures and storing them as
scenarios. More recently, Hartmann et al., (2018)
focuses on predictive analytics, also known as What-
If analysis. They focused mainly in extract temporal
models from current and past historical facts with the
intention of creating predictions of the future. Their
intent was to solve the problems inherent to predictive
analytics, like the complexity and the diversity of the
data models, using novel data model to support large-
scale What-If analysis on time-evolving graphs,
called Many-World Graph.
3 THE METHODOLOGY
3.1 Conventional What-If Analysis
What-If analysis allows for simulating changes in
historical data, creating hypothetical scenarios and
helping to predict the future. To do this, we altered
the data in order to assess the effects of the changes.
The user is accountable to change the value of one or
more business variables and set the scenario
parameters in a specific scenario, taking into
consideration the analysis goals. The What-If process
then calculates the effect of the impact of the change
of the business variables, presenting the user a new
changed scenario, called the prediction scenario
(Figure 1). It is the responsibility of the user to accept
or recalculate the obtained scenario (Golfarelli et al.,
2006).
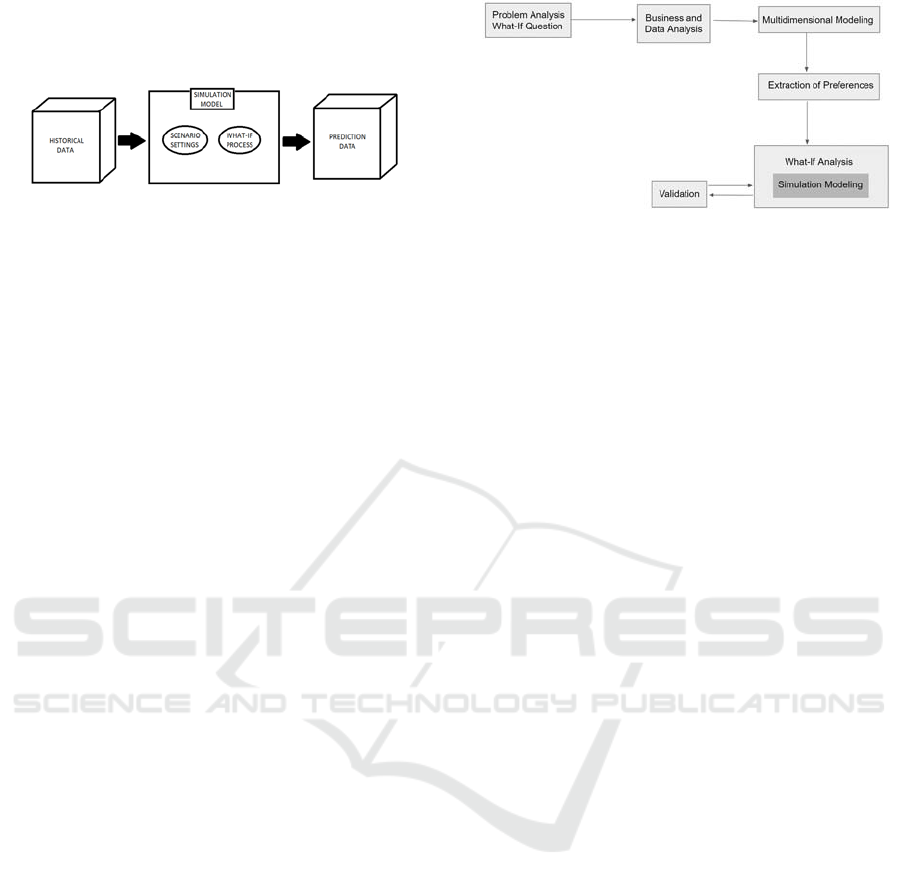
Figure 1: Historical and prediction scenarios.
This process provides several advantages to the user.
It makes possible to study the behavior of a system
without building it or creating the circumstances to
make it happen in a real-world system, clearly saving
time and reducing costs. Another advantage is that it
becomes possible to modify business variables in
order to find an unexpected behavior of the system.
With this, the business manager can be aware of the
conditions that lead to an erratic behavior and avoid
them in the future. Usually a What-If analysis starts
with the definition of a What-If question, for
example, “What if …?”. The What-If question
represents a question that denotes the intent on
exploring the consequences of changes on business-
related variables, in other words, what will happen if
The Added Value of OLAP Preferences in What-If Applications
173
a user changes values of a set of variables. The What-
If analysis allows the user to get the required
information to answer the What-If question.
Figure 2: A general overview of a What-If analysis process.
A simulation model (Figure 2) is the focus of a What-
If application. Commonly, this model is a
representation of a real business model and usually is
composed into several application scenarios. Each
scenario considers set of scenario settings. These
scenario settings are composed by a set of business
variables (the source variables) and a set of setting
parameters (scenario parameters). It is the user
responsibility to delineate the axis of analysis, the set
of values for analyzing, and the set of values to
change according to the goals defined previously.
Then, the What-If process is performed with an
appropriate tool and the outcome would be a
prediction scenario. The What-If analysis tool
calculates and lets the user to explore and analyze the
impact of the changes in the setting values of the
entire application scenario. The user is responsible to
accept the new data cube, or to return to change the
settings of the application scenario and make the
changes required over to the target data. As already
referred, the lack of expertise of the user can be an
obstacle during the What-If analysis process design
and implementation. If a user is not aware of the
process or the business, may not choose the most
correct parameters in a particular application
scenario, and the outcome provided may not be the
most adequate. Therefore, we developed a
hybridization process, which will help to overcome
the lack of user expertise.
3.2 The Hybridization Methodology
The methodology of integrating OLAP preferences in
What-If Analysis is a general methodology and can
be implemented through various methods and using
different technologies and tools, such as the tool to
perform the simulation, or the way preferences are
extracted. Clearly other choices of tools and
techniques are also possible.
After the overview of our hybridization process,
we define a methodology that should be followed
when dealing with What-If-based problems.
Figure 3: The schema of the methodology for the
hybridization process.
Our methodology incorporates six distinct phases
(Figure 3), namely:
1) Problem Analysis and Definition of the What-If
question. It starts when a doubt arises, the user
needs to define a What-If question. A what-if
question translates in a question about what can
happen in a specific hypothetical scenario and
the consequences of changing variables. In this
phase, it also needed to define the goal of
analysis and the set of business variables to add
in the simulation. It is necessary to know the
context of the problem to create the What-If
question.
2) Business and Data analysis. The user needs to
perform an analysis of the business and data.
One should know the set of business variables
and associations to be included in the simulation
model, identifying the dependent and
independent ones. The relevant data sources
need to be analyzed to understand which set of
data needs to be added to the simulation. One
should take into consideration the quality of the
data: if the simulation data has noise, the
outcome of the simulation could not be the most
adequate.
3) Multidimensional Modelling. In this phase, the
data structure is prepared to extract preferences.
The multidimensional structure is constructed
based on the information collected in the
previous phase and the goal analysis defined in
the first phase.
4) Extraction of Preferences. A mining technique is
applied to the created multidimensional
structure; this process is called OLAP mining
(Han, 1997). The outcome is stored in a mining
structure. Then, a filter process, which is
explained in detail in Carvalho and Belo (2016),
is applied to the outcome of the association rules
technique. This filter process consists in filtering
the data that is interesting to the user and should
be included in the simulation. To do this, it is
necessary to filter the set of association rules and
KDIR 2019 - 11th International Conference on Knowledge Discovery and Information Retrieval
174
return only the set of strong association rules that
contain the goal analysis business variable. At
the end, this process suggests to the user a set of
variables, which are strongly related to the goal
analysis, to introduce in the simulation model.
5) What-If Analysis simulation. In this phase, the
user performs the What-If simulation. To
perform the simulation the user needs to
introduce some scenario settings: source or
business variables and scenario parameters. The
set of business variables includes the goal
analysis business variable (the focus of the
analysis defined in the first phase) and a set of
suggested preferences. The set of scenario
parameters, as seen before, depends on the tool.
The set of scenario parameters that are
introduced according to the chosen tool, like the
algorithm and additional parameters.
6) Validation and Implementation of the decisions.
In the last phase, the user evaluates how credible
and practicable is the simulation model created.
The user needs to compare the results of the
simulation model with the real business model
outcome and to evaluate if the behavior of the
simulation model is adequate. If the simulation
outcome is irregular or unacceptable, the user
needs to go back and to redefine the simulation
model.
For implementing our methodology, in the third
phase we used Microsoft Visual Studio 2017 to create
the multidimensional structure within an Analysis
Services Multidimensional and Data Mining project.
Next, and using the same tool, we used a data mining
technique for extracting preferences, opting for an
Apriori-based algorithm (Agrawal and Srikant, 1994)
for extracting preferences from the multidimensional
structure in the fourth phase. We claim that this
algorithm is the most adequate mining technique to
extract preferences from the multidimensional
structure. The extracted preferences recommend to
the user axis of analysis that are strongly related to the
previously defined goal in the what-if question.
Preferences consist on information (patterns or
knowledge) from previous sessions of analysis
derived from the application of a data mining
algorithm. They provide access to relevant
information and eliminate irrelevant one. Therefore,
preferences help to introduce valuable information to
the scenario analysis, which otherwise may not
happen. To perform the What-If simulation in the
hybridization methodology we chose Microsoft
Office Excel functions.
4 A CASE EXAMPLE
For receiving and support the application of the
methodology we proposed, we designed and
implemented a specific software platform, which we
named as “OPWIF” - OLAP Preferences What-IF
analysis integration. To illustrate our hybridization
methodology, we selected a simple case study, from
the Wide World Importers (WWI) (SQL Server Blog,
2016) data warehouse. The creation and analysis of
the small data cube can clearly be generalized to
larger complex cases. The WWI database contains
information about a fictitious company, which is a
wholesale novelty goods importer and distributor.
4.1 Data and Goal Analysis
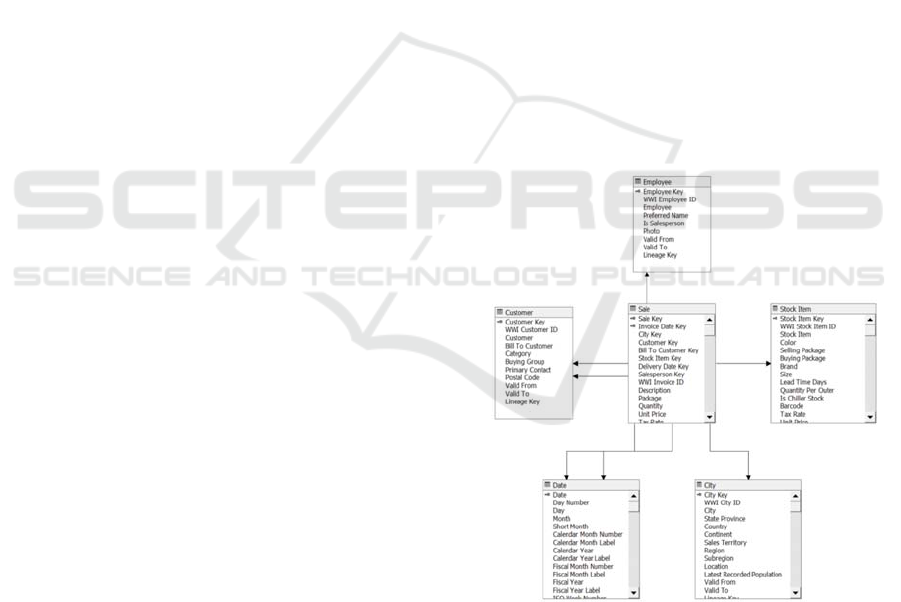
The database schema of the case study “Sales” is
presented in Figure
4
. It contains a fact Table “Sale”
and all the related dimension tables, namely:
“Customer”, “Employee”, “Stock Item”, “City” and
“Date”, each one containing the information about
customers, employees, stock items’, about cities of 49
states of EUA and date details between January 1,
2013 and December 31, 2016, respectively.
Figure 4: Selected data warehouse's view "Sales" schema.
The analysis example selected was one want to use
What-If analysis to explore the effects of increasing
the sales profit values by 10% of the profitable
products of a specific store. Considering this scenario
context, we formulate the following What-If
question: “What if we want to increase the sales profit
The Added Value of OLAP Preferences in What-If Applications
175
by 10% focusing mainly on the most profitable
products’ color?”.
Next, we need to define the goal analysis and a
set of business variables to add to the analysis
scenario. The goal analysis is “color”, because the
analyst wants to know how the profit values may vary
according to the products’ color. The set of variables
to be added to the scenario would be “sales profit”,
because it is the attribute that we aim at altering
(increasing 10%), and also it would be useful and
interesting to analyze the scenario data by year or
month.
4.2 Applying Conventional What-If
Analysis
The developed software platform allows for
performing conventional What-If analysis. Figure 5
represents the application UI of this tab, the WIF tab.
Figure 5: Overview of the software platform UI - WIF tab.
Using this tab, the user can create a typical What-If
scenario using the conventional What-If analysis. The
user chooses the parameters that he wants to
introduce in the scenario (according to the pre-
defined What-If question) and creates the graphic to
analyze the profit values. The set of parameters to be
chosen are: “Calendar Year” and “Calendar Month”
from the Dimension “Invoice Date” and “Color” from
the Dimension “Stock Item”, as we want to know
which is the most profitable products’ color. We opt
to choose “Calendar Year” and “Calendar Month to
analyze the scenario data by month. Then, after ‘See
Graphic’, the application shows the Historical
Scenario. As we want to analyze the effects of
changing the profit value by 10%, we set the new
value in the “New profit value”. After performing the
What-If analysis, the application returns the
Prediction Scenario (Figure 6).
Figure 6: Conventional What-If Analysis – The prediction
scenario.
4.3 The Hybridization Process
To support the proposed methodology, we developed
the HybridizationModel tab (Figure 7).
Figure 7: Overview of the application UI -
HybridizationModel tab.
The hybridization methodology is possible to be
followed using this tab. In Step 1, the user specifies
the minimum values support and probability to filter
the frequent itemsets and chooses the mining
structure according to the What-If question. For
example, if the user is focus on the sales profit of the
most profitable products’ color, he must choose the
‘Products’ mining structure. In step 2 the user chooses
the frequent itemset of its choice (according to the
What-If question), in this case, the ‘Color’ goal
analysis attribute. Finally, in step 3, and similarly to
step 1, the user specifies the mining values of support
and probability to filter the important set of
KDIR 2019 - 11th International Conference on Knowledge Discovery and Information Retrieval
176
association rules. These association rules are an
association rules’ subset that contain the chosen goal
analysis attribute in step 2. These steps are resumed
in Figure 8.
Figure 8: HybridizationModel tab – steps 1, 2 and 3
complete.
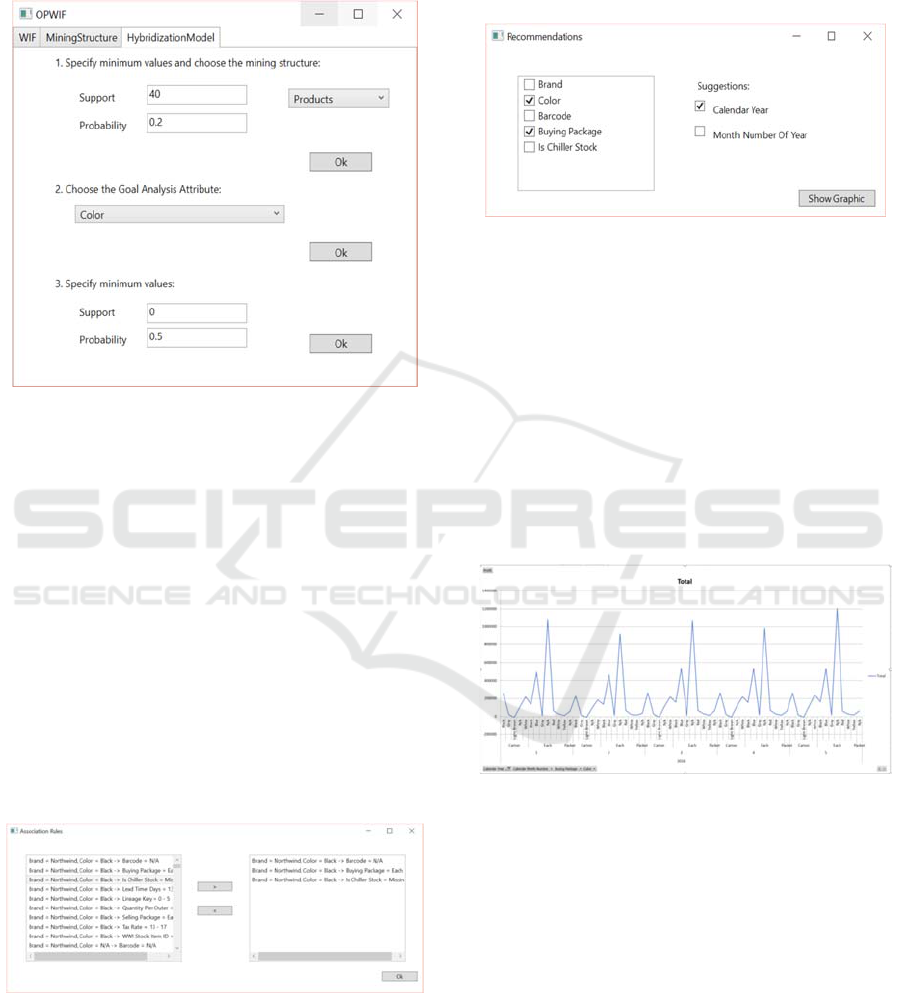
After filtering the association rules with default
minimum support and probability values in step 3, the
application UI shows the window, represented by
Figure 9, containing the final association rules’ list
ordered by probability of happening in the left. The
three chosen rules are the association rules in the
right:
1. [“Brand” = ‘Northwind’, “Color” = ‘Black’ ->
“Barcode” = ‘N/A’];
2. [“Brand” = ‘Northwind’, “Color” = ‘Black’ ->
“Buying Package” = ‘Each’];
3. [“Brand” = ‘Northwind’, “Color” = ‘Black’ -> “Is
Chiller Stock” = ‘Missing’].
These three top rules are chosen to form the OLAP
preferences.
Figure 9: Selection of top association rules.
Next, the item sets contained in the filtered
association rules will be suggested to the user as
preferences, as shown in Figure 10. The user choses
the scenario parameters to be part of the What-If
scenario. The preferences are the itemsets of the
chosen association rules “Brand”, “Barcode”,
“Buying Package” and “Is Chiller Stock” in the left.
“Calendar Year” and “Month Number of Year” are
suggested too to be part of the scenario.
Figure 10: Recommendations to the user.
Then, the application UI creates a historical scenario
with the chosen parameters and shows it to the user.
Finally, the application UI shows a new window, in
which the user can enter the desired final value. This
step is similar to the one in the conventional What-If
analysis, in which the user changes the value of the
goal analysis variable to the wanted one. In order
words, if the user wants to increase the profit value by
10%, we want to alter the profit final value by 10%.
Then, the application performs What-If analysis and
returns the new prediction scenario, represented by
Figure 11.
Figure 11: Hybridization process - Prediction scenario.
4.4 Comparative Analysis
Now, it is time to compare the results of both
approaches shown, the outcome of the application of
the conventional What-If analysis (Figure 6) and the
outcome of the application of our proposed
hybridization process (Figure 11). In both graphics,
it is possible to analyze the attributes “Profit”,
represented by the Y axis, with a range from ‘-200
000’ to ‘1 600 000’, and “Calendar Year” (‘2016’)
and “Month Number of Year”, represented by the X
axis, with a range of ‘1’ to ‘5’, representing the
months of a year, from ‘January’ to ‘May’; and
The Added Value of OLAP Preferences in What-If Applications
177

“Color” which can be ‘Black’, ‘Red’, ‘Gray’,
‘Yellow’, ‘Blue’, ‘White’, ‘Light Brown’ and ‘N/A’
(not available).
Using the conventional What-If analysis
process, the graphic of the Prediction scenario (Figure
6) shows that in ‘2016’, products with ‘N/A’ color are
the most profitable and it is the product color that earn
more money, especially in ‘May’, ‘March’ and
‘January’, respectively; showing profit vales over
than ‘1,200,000’. Followed by the products’ color
‘Blue’, which is the most profitable in ‘March’,
‘April’ and ‘May’; and finally, the products’ color
‘Black’ is more profitable in the same months that the
products’ color ‘Blue’. ‘Light Brown’ is the products’
color less profitable, also with negative values in
‘2016’.
Now, we consider the outcome of the application
of our hybridization process. When we analyze the
prediction scenario (Figure 11), it is possible to verify
that products with Light Brown shows negative
profit. But this fact is not news, as we had already
concluded this fact by analyzing the outcome of the
conventional What-If analysis. The novelty using our
hybridization process is the suggestion of the "Buying
Package" parameter (Figure 10). With the addition of
this new parameter it is possible to conclude more
facts beyond what we previously conclude with the
conventional What-If analysis.
Products with unknown color or (‘N/A’) with
‘Each type’ buying packages are the most profitable
products (with profit values over ‘1,000,000’ in
‘January’, ‘March’ and ‘May’), comparing to (‘N/A’)
color products with ‘Carton’ and ‘Packet’ (less than
‘120,000’), which are less profitable.
Products’ color ‘Blue’ are the second most
profitable, especially in ‘May’, ‘April’ and ‘March’
(over ‘500,000’). The novelty here is the fact that the
most profitable ‘Blue’ products were sold with ‘Each
type’ buying packages.
The products’ color ‘Black’, similar to the
previous analysis, are the third most profitable
products in ‘May’, ‘April’ and ‘March’ (over
‘250,000’). The novelty here is that the most
profitable ‘Black’ products were sold with ‘Carton’
buying packages. Apart from these cases, products
that are sold in ‘Carton’ and ‘Packet’ (regardless of
Color) generally have low profit values (less than
‘150,000’).
Thus, we can conclude that regardless the color,
the buying package (‘Carton’ or ‘Packet’) influence
the negatively the profit. Finally, and already known
fact is that ‘Light Brown’ products have negative
profit values. The new information that we can
include in this last fact is that ‘Light Brown’ products
have buying package made from ‘Carton’.
Comparing the outcomes of both approaches, we can
conclude that when using the hybridization process,
we get more refined and detailed results, leading to
decisions that are more accurate. For example, in the
conventional What-If analysis, the most profitable
products’ color was ‘N/A’; on the other hand, in the
hybridization process, the most profitable products’
color was also ‘N/A’, but we learned that the most
profitable products with (‘N/A’) color were sold with
‘Each type’ buying packages. Moreover, products
with the buying package (‘Carton’ or ‘Packet’) and
regardless the color influence negatively the profit.
The second most profitable products’ color, in
the conventional What-If analysis approach, was
‘Blue’. In the hybridization process, by analyzing the
scenarios, we conclude that the most profitable ‘Blue’
products were sold with ‘Each type’ buying packages
(as in the ‘N/A’ colored products). Another fact that
we conclude using the hybridization process is that
‘Blue’ products sold in ‘Carton’ and ‘Packet’ buying
packages do not show any profit values.
Finally, in the conventional What-If analysis,
‘Black’ was the third most profitable products’ color.
In the hybridization process, we conclude that the
most profitable ‘Black’ products were sold with
‘Carton’ buying packages. This information is hidden
by the conventional What-If outcome analysis.
The presented case example analysis represents
a small case study. However, it demonstrates the
potential of the methodology, which helps up to be
helpful when dealing with cases that are more
complicated. With this methodology, we can add new
relevant information to the analysis.
5 CONCLUSIONS
In this paper, we presented a solution approach for
enhancing the conventional What-If analysis process
using OLAP usage preferences, a hybridization
methodology and its application. This methodology
process helps the user by suggesting new axes of
analysis to the What-If analysis scenario. These new
axes of analysis are discovered through OLAP mining
and cannot otherwise be discovered using a manual
analysis. At the end, this integration helps the user by
adding new relevant information to the What-If
scenario. This contributes significantly to enrich a
make more valuable a What-If scenario for a
particular business domain.
The main difference between our approach and
a conventional What-If analysis method is then to
become possible to simulate a system behaviour
KDIR 2019 - 11th International Conference on Knowledge Discovery and Information Retrieval
178

based on past data extracted from OLAP sessions, in
other words, our approach contains the process of
extraction of usage preferences using association
rules. Preferences can be defined based on historical
data provided from a data mining system. Preferences
can recommend to the user the axes of analysis that
are strongly related to each other, helping to introduce
valuable information in the application scenario being
building.
Following this methodology, the user experience
is eased. The choice of the scenario parameters is one
of the phases that may be quite difficult to a user that
is not familiar with the business data. A user that is
not familiar with the data, may choose the wrong or
inadequate scenario parameters. Instead of making
the wrong choices or choosing only the scenario
parameters included in the What-If question, our
process finds and recommends the set of strongly
related to the goal analysis attributes to the user. Thus,
it is possible to the user to add relevant and important
information to the scenario, which in a default or
usual situation would not be done.
Nevertheless, there we also recognized some
limitations that need to be overcome, in order to make
the system more efficient, especially at the level of
the usage of Microsoft Office Excel functions and
within the What-If process itself. Additionally, we
need to free the system from some limitations
imposed by user’s choices done in the most parts of
the What-If process. This is must be avoided, because
a user that has limited knowledge about the business
domain or even about the simulation process to be
implemented influences the entire process negatively,
leading consequently to poor results.
Despite the several advantages of using the
hybridization methodology, there are some
drawbacks related to this process. In a first stage of
the What-If process, if the goal analysis is not done
correctly, What-If questions and scenarios will be not
correctly defined, or the preferences outcome will be
not reliable. Thereafter, performed What-If queries
will be not the most suitable process and thus the
obtained prediction will be different of what is
expected as a normal behavior of a real business
system. One way of avoiding this is to study potential
and alternative application scenarios, in order to take
the best advantages of the What-If scenario analysis
tool. Finally, the What-If Analysis results depend
strongly from the data we want to analyze. If it
contains some errors, which is a very common
situation, the result will not be very useful. In order to
overcome this kind of drawbacks, we mainly aim at
restructuring automatically the What-If scenarios,
discarding the user’s dependency and finding a way
of overcoming the limitation we found in some Excel
functions.
ACKNOWLEDGMENTS
This work has been supported by national funds
through FCT – Fundação para a Ciência e Tecnologia
within the Project Scope: UID/CEC/00319/2019.
REFERENCES
Agrawal, R., Srikant, R., 1994. Fast algorithms for mining
association rules. In Proc. 20th int. conf. very large data
bases, VLDB. 1215, pp. 487-499.
Carvalho, M., Belo, O., (2016). “Enriching What-If
Scenarios With OLAP Usage Preferences”, In
Proceedings of The 8th International Conference on
Knowledge Discovery and Information Retrieval
(KDIR‘2016), Porto, Portugal, November 9-11.
Deutch, D., Ives, Z. G., Milo, T. and Tannen, V. (2013).
Caravan: Provisioning for What-If Analysis. In CIDR.
ISO 690.
Gavanelli, M., Milano, M., Holland, A. and O'Sullivan, B.
(2012). What-If Analysis Through Simulation-
Optimization Hybrids. In ECMS. pp. 624-630.
Golfarelli, M., Rizzi, S. Proli, A., 2006. Designing What-If
Analysis: Towards a Methodology. In DOLAP’06,
Arlington, Virginia, USA, pp. 51-58.
Golfarelli, M., Rizzi S., 2009. Expressing OLAP
preferences. Scientific and Statistical Database
Management. Springer Berlin Heidelberg.
Golfarelli, M. and Rizzi, S. (2010). What-if simulation
modeling in business intelligence. In Business
Information Systems: Concepts, Methodologies, Tools
and Applications. pp. 2229-2247. IGI Global.
Han, J., 1997. OLAP mining: An integration of OLAP with
data mining.’ In Proceedings of the 7th IFIP.
p. 1-9.
Harinarayan, V., Rajaraman, A. Ullman, J., 1996.
Implementing data cubes efficiently. ACM SIGMOD
Record. 25(2).
Hartmann, T., Fouquet, F., Moawad, A., Rouvoy, R. and
Traon, Y. L. (2018). GreyCat: Efficient What-If
Analytics for Data in Motion at Scale. arXiv preprint
arXiv:1803.09627.
Hung, N. Q. V., Tam, N. T., Weidlich, M., Thang, D. C.
and Zhou, X. (2017). What-if Analysis with Conflicting
Goals: Recommending Data Ranges for Exploration. In
Proceedings of the VLDB Endowment, 10(5).
Jerbi, H., Ravat, F., Teste, O., Zurfluh, G., 2009.
Preference-based recommendations for OLAP analysis.
Springer Berlin Heidelberg.
Kottemann, J. E., Boyer-Wright, K. M., Kincaid, J. F. and
Davis, F. D. (2009). Understanding decision-support
effectiveness: A computer simulation approach. IEEE
The Added Value of OLAP Preferences in What-If Applications
179

Transactions on Systems, Man and Cybernetics-Part A:
Systems and Humans, 39(1), pp. 57-65.
Microsoft SQL Server Product Samples: Database (2015)
Available at: [http://msftdbprodsamples.codeplex.
com/] [Accessed 13 fev. 2016].
Saxena, G., Narula, R. and Mishra, M. (2013). New
Dimension Value Introduction for In-Memory What-If
Analysis. arXiv preprint arXiv:1302.0351.
SQL Server Blog. (2016). WideWorldImporters: The new
SQL Server sample database - SQL Server Blog.
[Online] Available at: https://cloudblogs.microsoft.
com/sqlserver/2016/06/09/wideworldimporters-the-
new-sql-server-sample-database/ [Accessed 5 Mar.
2017].
Xu, H., Luo, H. and He, J. (2013). What-if query processing
policy for big data in OLAP system. In Advanced Cloud
and Big Data (CBD), 2013 International Conference on.
pp. 110-116. IEEE.
Zhou, G. and Chen, H. (2009). What-if analysis in MOLAP
environments. In Fuzzy Systems and Knowledge
Discovery, 2009. FSKD'09. Sixth International
Conference on. 2, pp. 405-409. IEEE.
KDIR 2019 - 11th International Conference on Knowledge Discovery and Information Retrieval
180
