
Measuring Individuals’ Knowledge, Attitude and Behaviour on
Specific Ocean Related Topics
Conor McCrossan and Owen Molloy
National University of Ireland, University Road, Galway, Ireland
Keywords: Ocean Literacy, Ocean Knowledge, Ocean Attitude, Ocean Behaviour, Micro-plastics, Coastal Tourism,
Sustainable Fisheries.
Abstract: In order to measure the effectiveness of Ocean Literacy (OL) tools we can measure people’s knowledge of,
and attitude and behaviour towards, specific ocean-related topics, both before and after their use of the tool.
The research described in this paper aims at development of more accurate, focused survey tools. In
particular we are interested in ensuring that we can accurately assess knowledge on specific topics, rather
than assessing broad ocean literacy levels. Surveys were created to measure the levels of knowledge,
attitude, and behaviour of university students. The topics which the surveys focused on were micro-plastics,
coastal tourism, and sustainable fisheries. The knowledge, attitude, and behaviour questions in the surveys
are based on work carried out as part of the H2020 ResponSEAble project on Ocean Literacy. The results
show that while the students have a high level of pro-ocean-environmental attitude, their existing behaviour
is low to medium, and their future intended behaviour is at a higher level than their existing behaviour. The
findings provide useful pointers on how to improve both the ocean literacy tools (no statistically significant
correlation between knowledge and either attitude or behaviour) as well as the design of the survey and
questions themselves.
1 INTRODUCTION
It seems that nearly every day we see news articles
relating the urgency of addressing issues regarding
the health of our oceans and the welfare of the
species that inhabit them. In terms of the life span of
the Earth, and the current ocean ecosystems,
humanities impact has been relatively brief, but
devastating. Phenomena such as ocean acidification,
bleaching of corals, plastics, overfishing and
warming can all be directly related to human
activity. From deep ocean trenches to remote
Antarctic seas, we can find evidence of our impact
on the ocean environment (Ocean Plastic, 2017).
Rather than blindly addressing symptoms, it is
vital to address causes of problems. Intelligent
solutions require that we understand the complex
systems involved in the interplay between humans
and the oceans. The processes and activities
involved must be understood in order to target
interventions such that they have significant impact.
Complex supply chains often involve multiple
activities and human actors (Trienekens et al., 2012),
each with different requirements in terms of
knowledge, influence and ability to act. For
example, individual tourists and planning officers
will have very different perspectives, knowledge and
potential impact in terms of addressing problems
caused by mass coastal tourism. The recent efforts to
prevent plastic microbeads from entering our oceans
and ecosystems is a good example (Xanthos and
Walker, 2017). Social media campaigns and
awareness-raising helped to change individual
consumer’s attitude and behavior, while
governments took notice of the problem and
legislated to ban microbeads from cosmetics
products (Girard et al., 2016). Meanwhile, cosmetics
producers are removing microbeads from their
products and replacing them with sustainable
alternatives (Microbead Ban, 2018).
In this paper we examine the measurement of
Ocean Literacy (OL) as a means of assessing the
effectiveness of OL initiatives and tools. This
research can also be applied to measurement in other
areas e.g. Environmental Literacy. An approach to
measure environmental knowledge, attitude, and
behaviour would involve chosing specific topics
related to environmental literacy and creating
surveys on those topics. Examples of environmental
McCrossan, C. and Molloy, O.
Measuring Individuals’ Knowledge, Attitude and Behaviour on Specific Ocean Related Topics.
DOI: 10.5220/0008353003250332
In Proceedings of the 11th International Joint Conference on Knowledge Discovery, Knowledge Engineering and Knowledge Management (IC3K 2019), pages 325-332
ISBN: 978-989-758-382-7
Copyright
c
2019 by SCITEPRESS – Science and Technology Publications, Lda. All rights reserved
325
literacy topics which could be chosen are air
pollution and energy use. The Literature Review
section of this paper looks at existing measurement
approaches (typically surveys) in relation to OL and
the data analysis procedures applied. We then
describe our work in designing surveys to assess OL
on specific topics, rather than large topics covering
broad OL. The Methodology section describes the
actions taken to create our surveys, and gather the
data. The Data Analysis and Results section
describes the analytical techniques applied to the
data, such as Rasch analysis, comparison between
current and future behavior, and distractor analysis.
The Discussion section discusses the findings from
the data analysis and the Conclusion section contains
the conclusions drawn from this research.
2 LITERATURE REVIEW
2.1 Measurement of Ocean Literacy
Existing research typically derives the definition of
Ocean Literacy (OL) or Ocean Environmental
Awareness from the broader concept of
environmental awareness (Umuhire and Fang,
2016). It includes a person’s ability to realize an
existing connection between human activities and
the state of the ocean, and a person’s attitude
towards a safe and healthy marine environment. The
understanding of the impact of human activities was
the subject of a European-wide survey of societal
awareness and perceptions about marine litter
(MARLISCO project).
It is desirable for people to have a higher level of
knowledge and understanding in relation to the
ocean, as well as improvements in attitudes,
behaviours, and how we communicate on ocean
issues with other people. By improving knowledge,
attitude, and behaviour in relation to the ocean,
people are empowered to grasp complex issues and
make informed decisions regarding their behaviour,
while also communicating on them with other
people and institutions.
The objectives of this research are to (i)
investigate ocean environmental awareness related
dimensions, (ii) find what approaches are taken to
measure these dimensions, and the data analysis
procedures that can be used to generate useful
information from responses to questionnaires and
surveys, (iii) create and administer surveys to
measure the levels of knowledge, attitude, and
behaviour of students, and (iv) use the survey
response data to identify weaknesses in the questions
with respect to the survey goals.
This last objective (iv) helps us to explore the
difficulties involved in measuring the effectiveness
of ocean literacy tools and interventions, especially
where they relate to quite narrow and specific topics
such as micro-plastics, coastal tourism, and
sustainable fisheries.
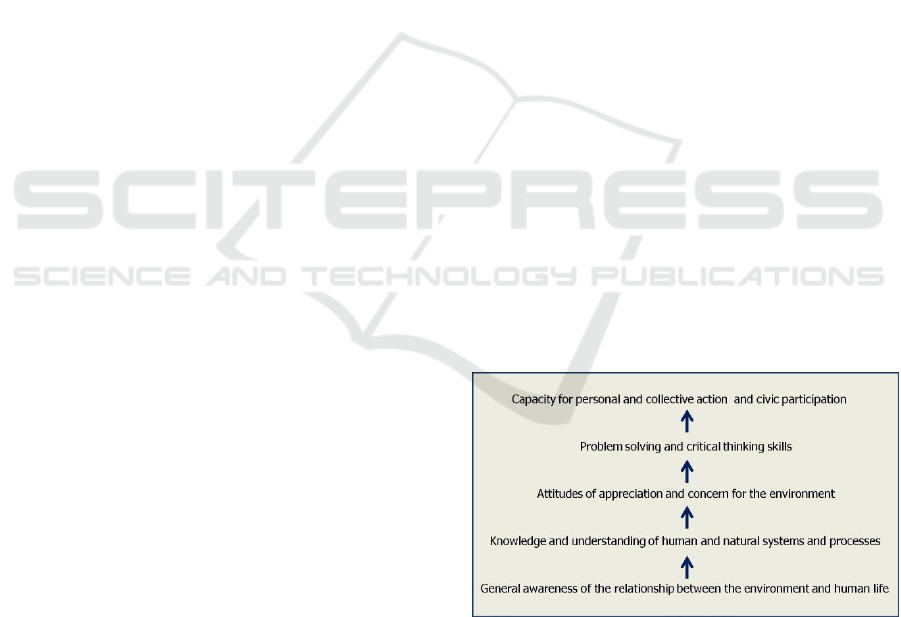
The five essential components of environmental
literacy outlined by the Environmental Literacy
Ladder (ELL, 2007) are Awareness, Knowledge,
Attitudes, Skills, and Collective Action. Each of the
components are seen as steps on a ladder towards
environmental literacy, as shown in Figure 1.
However, rather than viewing the levels possessed
by an individual as steps on a ladder, it is more
realistic to view it as a combination of ocean related
dimensions. Using the ocean related dimensions, the
levels possessed by a person can be measured as a
combination of their level of knowledge related to
ocean, the extent to which their attitude is pro-
ocean-environmental, and how environmentally
friendly their behaviour is in relation to the ocean. In
our framework, awareness is defined as the basic
knowledge that a situation, problem or concept
exists. Knowledge is what a person knows about an
ocean related topic and the links between topics.
Attitude is related to a level of agreement with or
concern for a particular position. Communication is
the extent to which a person communicates with
others, such as family and peer groups, on ocean
related topics. Behaviour relates to decisions,
choices, actions, and habits with respect to ocean
related issues.
Figure 1: The Environmental Literacy Ladder.
Some of the existing approaches to measuring
knowledge and awareness related to the ocean
include the Survey of Ocean Literacy and
Experience (SOLE) (Greely, 2008) and the
International Ocean Literacy Survey (IOLS)
(Fauville et al., 2018). Both surveys include similar
KMIS 2019 - 11th International Conference on Knowledge Management and Information Systems
326

questions related to general knowledge about the
ocean, e.g. how much of the earth is covered by the
ocean, ocean circulation, the depth of the ocean,
ocean resources, and the supply of salt to oceans by
rivers. Having surveys on specific topics helps with
the assessment of the impact of interventions which
are targeted at specific topics. It is important to note
that it is difficult to create a survey on specific topics
because there may only be a small number of
questions, on specific topics, that a person may
know the correct answer to and it may also be
difficult to establish a level of consistency of
responses on a narrow range of questions.
2.2 Existing Data Analysis Approaches
Rasch analysis is an approach used to calculate a
person’s knowledge (called their “person ability”),
item difficulties, error values, and fit values from
responses to a set of questions. These values are then
used to give an indication of how each respondent
performed and the level of difficulty associated with
each question. The level of error and fit associated
with each question can be used to indicate questions
which can be improved. The Rasch model is based
on the idea that useful measurement involves
examination of only one human attribute at a time
and it provides a mathematical framework against
which test developers can compare their data (Bond
and Fox, 2007).
3 METHODOLOGY
The 3 surveys created as part of this research are
based on 3 of the key story topics which are part of
the ResponSEAble (2015) project. The key story
topics are Micro-plastics (2018), Coastal Tourism
(2018), and Sustainable Fisheries (2018). Each of
the surveys contain the following 5 sections: (i)
general respondent information e.g. country, city,
age range, (ii) questions related to the knowledge
possessed by the respondent regarding the topic, (iii)
questions on the attitude of the respondent towards
the topic, (iv) questions on the current behaviour of
the respondent in relation to the topic, and (v) the
future intended behaviour of the respondent in
relation to the topic.
The surveys were created and administered
online using Google Forms (2018). Google forms
provide a way of creating and administering online
surveys, and receiving and analysing the responses
to the surveys. Bitly (2018) links were used to
provide access to the surveys and all of the
respondents to the surveys were undergraduate
university students. The students surveyed were not
involved in the ResponSEAble project and had not
used any of the tools created as part of the project.
4 DATA ANALYSIS AND
RESULTS
4.1 Descriptive Analysis
There were a total of 184 responses: 70 to the micro-
plastics survey, 69 to the coastal tourism survey, and
45 to the sustainable fisheries survey. The
respondents to the surveys were Irish university
students, and their age range was between 18 and 24
years. 17 of the 70 respondents to the micro-plastics
survey used the link to view the micro-plastics
correct answers, 9 of the 69 respondents to the
coastal tourism survey used the associated correct
answers link, and 13 of the 45 respondents to the
sustainable fisheries survey used the associated
correct answers links. So, the percentage of
respondents who used the associated correct answers
links for the micro-plastics, coastal tourism, and
sustainable fisheries was 24.3%, 13%, and 28.9%,
respectively.
4.2 Correlation Analysis
The correlation analysis of the relationship between
attitude and behaviour in relation to the surveys
shows that a correlation does exist. The Pearson
correlation r-value for the correlation between
attitude and behaviour for the micro-plastics
responses was found to be 0.495 with the correlation
significant at the 0.01 level (2-tailed). The r-value
for the correlation between attitude and behaviour
for the coastal tourism responses was found to be
0.442 with the correlation significant at the 0.01
level (2-tailed). The r-value for the correlation
between attitude and behaviour for the sustainable
fisheries responses was found to be 0.296 with the
correlation significant at the 0.05 level (2-tailed). No
statistically significant correlation was found
between knowledge and attitude or knowledge and
behaviour for each of the 3 surveys.
The internal consistency of the questions used to
measure the attitudes and behaviour of respondents
was measured by performing correlations between
each of the questions measuring attitude and each of
the questions measuring behaviour. A statistically
significant correlation was found for all of the
Measuring Individuals’ Knowledge, Attitude and Behaviour on Specific Ocean Related Topics
327
pairings except for the pairing between micro-
plastics behaviour questions 15 and 16, and the
pairing between sustainable fisheries attitude
questions 11 and 12.
4.3 Reliability Analysis
The Cronbach’s alpha statistical test was used to
check the internal consistency of the attitude and
behaviour questions.
Table 1: Mean, standard deviation, and Cronbach’s alpha
if item deleted for micro-plastics attitude and behaviour
questions.
Question
number
Mean
Standard
deviation
Cronbach’s alpha
if item deleted
Q 9
8.19
1.77
0.536
Q 10
8.07
1.82
0.565
Q 11
8.6
1.62
0.919
Q 12
5.63
2.74
0.741
Q 13
3.56
2.92
0.751
Q 14
4.79
3.09
0.724
Q 15
5.37
2.96
0.782
Q 16
8.13
2.24
0.834
Table 2: Mean, standard deviation, and Cronbach’s alpha
if item deleted for coastal tourism attitude and behaviour
questions.
Question
number
Mean
Standard
deviation
Cronbach’s alpha
if item deleted
Q 6
7.25
2.11
0.655
Q 7
6.71
2.34
0.706
Q 8
8.64
1.79
0.800
Q 9
7.16
2.93
0.876
Q 10
3.94
3.19
0.837
Q 11
3.07
2.92
0.821
Q 12
3.61
3.17
0.810
Q 13
4.52
3.30
0.856
Table 3: Mean, Standard Deviation, and Cronbach’s Alpha
if Item Deleted for Sustainable Fisheries Attitude and
Behaviour Questions.
Question
number
Mean
Standard
deviation
Cronbach’s alpha
if item deleted
Q 10
8.49
1.34
0.358
Q 11
7.78
1.99
0.427
Q 12
7.80
2.19
0.744
Q 13
3.11
3.14
0.818
Q 14
2.49
3.27
0.849
Q 15
4.76
3.40
0.842
Q 16
3.13
3.24
0.821
Q 17
4.87
3.35
0.892
The resulting Cronbach’s alpha value for the attitude
questions in the survey on micro-plastics was 0.783,
coastal tourism was 0.8, and sustainable fisheries
was 0.604. The Cronbach’s alpha value for the
behaviour questions in the survey on micro-plastics
was 0.808, coastal tourism was 0.869, and
sustainable fisheries was 0.873. Tables 1, 2, and 3
show the question number, mean, standard
deviation, and the “Cronbach’s alpha if item
deleted” for each of the attitude and behaviour
questions in the 3 surveys.
4.4 Rasch Analysis
Person abilities are calculated by performing a log
odds (logit) transformation on the percentage of
questions a respondent has answered correctly
(Bond and Fox, 2007). For example, to calculate the
logit value for a percentage correct score of 64%, we
calculate the odds of 64 to 36 by dividing 64/36, and
then get the natural log of the result, which is +0.58
logits. The item difficulties are calculated similarly
and are based on the percentage of times a question
is answered correctly. The error value is an
indication of the accuracy of the Rasch measure for
a person ability or item difficulty and the error
values are related to how many items or persons are
positioned in the same area on the Rasch logit scale.
The fit value for items is an indication of the extent
to which a question appears to be measuring the
unidimensional topic and the fit for a person can
give an indication of unusual sequences of responses
e.g. a person guessing the answers to questions. The
“Outfit Zstd” values reported in tables 4, 5, and 6 are
standardized fit statistics which are the result of t-
tests of the hypothesis “Does the data fit the model
(perfectly)?” (Outfit, 2018).
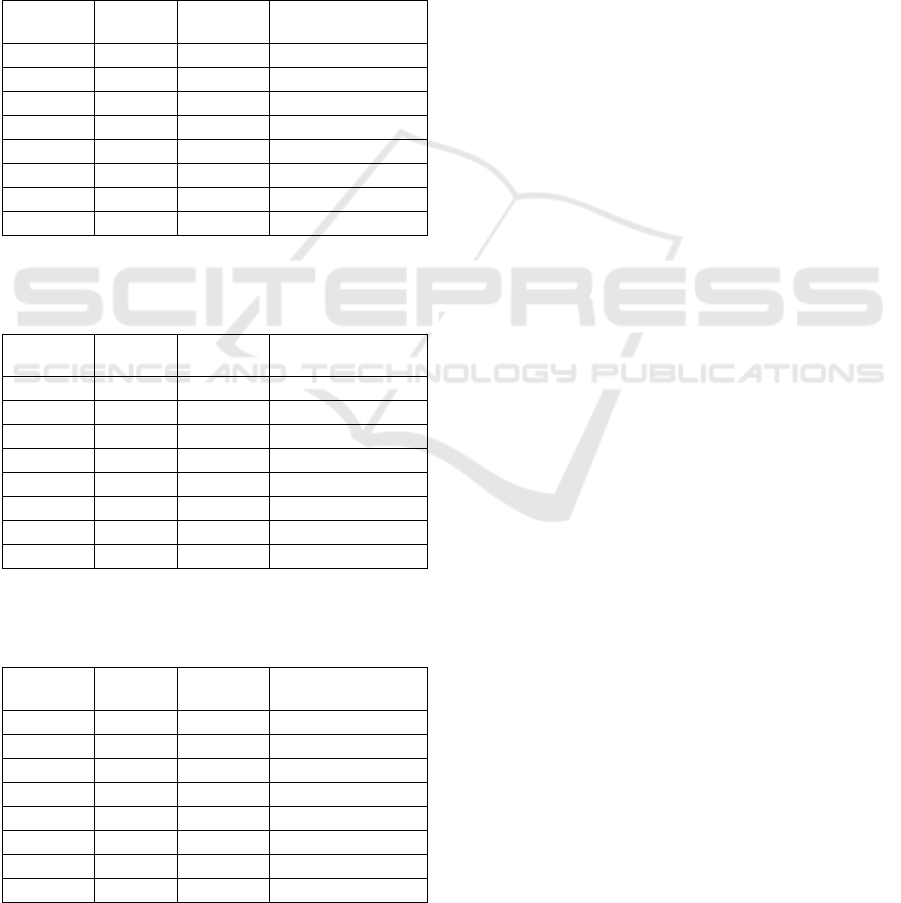
Tables 4, 5, and 6 show the Rasch estimates for
the knowledge questions in the surveys. The tables
are ordered by question difficulty with the most
difficult question at the top. The “Question number”
column shows the number of the question used in
the survey. The “Total score” column contains the
number of respondents who answered the question
correctly. The “Measure” column contains the logit
value which gives an indication of the difficulty of
the question. The “Standard Error” column shows
the error related to the Rasch measurement and the
“Outfit Zstd” is the level of fit associated with the
Rasch measurement.
KMIS 2019 - 11th International Conference on Knowledge Management and Information Systems
328

5 DISCUSSION
The results of the descriptive analysis shows that the
survey respondents have a slightly higher level of
knowledge about sustainable fisheries (mean
51.85%) when compared to knowledge of micro-
plastics (mean 48.93%). The level of knowledge
possessed by the respondents with regard to coastal
tourism is the lowest at 39.71%. The respondents to
the sustainable fisheries survey have the highest
percentage (28.9%) for viewing the correct answers
to the knowledge questions, followed by the
percentage (24.3%) of respondents who viewed the
correct answers to the micro-plastics knowledge
questions, and the percentage who viewed the
correct answers to the coastal tourism knowledge
questions is the lowest at 13%.
The mean scores for the attitude questions in the
3 surveys are similar with the attitude score for
micro-plastics the highest at 8.29, followed by
sustainable fisheries at 8, and coastal tourism with
the lowest at 7.53. The mean scores for the current
behaviour responses were highest for micro-plastics
(5.49), followed by coastal tourism (4.46), and
sustainable fisheries had the lowest (3.67). The mean
scores for future behaviour are all higher than the
scores for current behaviour with the score for
micro-plastics (6.9) the overall highest, and similar
mean scores for sustainable fisheries and coastal
tourism at 5.78 and 5.71, respectively. A comparison
of the results of the current and future behaviour
questions shows that, in general, respondents intend
to improve their behaviour in the future.
5.1 Correlations
A medium correlation was found between attitude
and behaviour for the responses to the surveys. The
Pearson correlation r-value of 0.224 found by Yoon
Fah and Sirisena (2014) for the relationship between
environmental attitudes and environmental
behaviours is slightly lower than the r-value of 0.296
found in this research for the relationship between
attitude and behaviour with regard to sustainable
fisheries. The r-values for attitude and behaviour for
the micro-plastics and coastal tourism surveys are
higher at 0.495 and 0.442, respectively. Michalos et
al. (2017) found an r-value of 0.35 for attitudes and
behaviour towards sustainable development which is
slightly higher than the r-value found in this research
for the same relationship related to sustainable
fisheries. One of the behaviour questions in our
sustainable fisheries survey relates to supporting
campaigns that tell people to eat seafood that is
sustainably sourced. There is no attitude question in
the sustainable fisheries survey which relates to
attitude towards supporting campaigns. This could
be an indication of why the r-value for the
correlation between the attitude and behaviour
questions, in the sustainable fisheries survey, is the
lowest.
The reason why no significant correlation was
found between knowledge and attitude or knowledge
and behaviour could be related to the quality of the
questions. If the knowledge questions were more
aligned with measuring knowledge related to the
specific topics being measured in the attitude and
behaviour questions, a significant correlation may
exist. One of the coastal tourism attitude questions
measures how worried respondents are about the
effects of coastal tourism activities on the marine
environment. Adding a knowledge question to the
survey which tests knowledge related to coastal
tourism activities may help to identify the
knowledge which relates to a high level of pro-
ocean-environmental concern in relation to coastal
tourism activities. An example of such a question
would be “How does the activity of cleaning
seaweed from a beach impact the coastal
environment?” Care should be taken to ensure that
aligning the knowledge questions with the attitude
and behaviour questions will not constrain the
measurement too much and will not create questions
that are too difficult.
5.2 Reliability
The Cronbach’s alpha values for the attitude and
behaviour question in the surveys show an
acceptable to good reliability except for the attitude
questions in the sustainable fisheries survey. The
Cronbach’s alpha value for the attitude questions in
the sustainable fisheries survey was 0.604. This
value could be increased to 0.744 if attitude question
12 was removed from the survey, as shown in table
3. Question 12 in the sustainable fisheries survey is
related to both the benefit to the marine environment
and the fishing industry of buying and eating
seafood that is labelled sustainable. This question
could be improved by dividing it into 2 questions,
one which relates to the benefit to the marine
environment and another which relates to the fishing
industry.
5.3 Rasch Estimates
The Rasch analysis of the knowledge questions
(table 4) in the micro-plastics survey shows that the
Measuring Individuals’ Knowledge, Attitude and Behaviour on Specific Ocean Related Topics
329

most difficult question was question 5 “Select
products which might have contained micro-beads in
the past” and the least difficult question was
question 7 “Where does the majority of our plastic
waste end up?”. The respondents and questions are
grouped towards the centre of the logit scale in the
Rasch person-item map which indicates that the
questions are not measuring the upper and lower
respondent abilities. The Rasch person-item map
provides a visual representation of the positioning of
person abilities and item difficulties in relation to
each other along a vertical logit scale (Bond and
Fox, 2007).
Table 4: Rasch estimates for micro-plastic survey
knowledge questions.
Question
number
Total
score
Measure
Standard
Error
Outfit
Zstd
Q 5
17
1.34
0.31
-1.0
Q 4
31
0.23
0.27
-0.3
Q 3
32
0.15
0.27
-0.5
Q 1
33
0.08
0.27
-1.4
Q 8
34
0.01
0.26
1.7
Q 2
37
-0.20
0.26
4.0
Q 6
38
-0.27
0.27
-1.3
Q 7
52
-1.35
0.30
-0.5
The error associated with each of the questions is
low due to the fact that there are a lot of respondents
grouped at the same logit level as the questions. The
Oufit Zstd value for question 2 is 4.0 which is well
outside the acceptable range of -2 to 2. This means
that question 2 does not fit with the
unidimensionality of the micro-plastics survey.
Question 2 is “Which of the face wash ingredients
shown might be micro-plastics?” An image and a list
of options to choose from are provided to the
respondent. The correct answer to the question is a
single option but the format of the question allowed
the respondent to choose multiple options. This may
explain why question 2 had poor fit in the Rasch
analysis. To improve the fit of this question the
format of the question could be changed to only
allow the respondent to choose one option. The rest
of the knowledge questions in the micro-plastics
survey have Oufit Zstd values which are within the
acceptable range. Improving the set of micro-plastic
knowledge questions, with a view to making them a
more effective scale to measure the levels possessed
by respondents, would involve creating more
knowledge questions that are more difficult and less
difficult. These new questions could be combined
with the existing questions, the survey could then be
administered to another cohort, and Rasch analysis
could be used to check the improvement of the
questions as a scale to measure micro-plastic
knowledge.
The Rasch analysis of the coastal tourism
knowledge questions (table 5) shows that the most
difficult question is question 3 “Please choose the
main effects of coastal development from the list
below” and the least difficult question is question 1
“The picture below shows a paradise beach in the
middle of summer. There is an artificial rock barrier
in front of the beach. What is the function of the
artificial rock barrier?” The person-item map shows
that the questions are spread out along the logit scale
with questions 2, 5, and 1 measuring ability below
the zero logit point and questions 3 and 4 measuring
abilities above the zero logit point. The zero logit
point on the logit scale is the mean point of the item
difficulty estimates (Bond and Fox, 2007).
Table 5: Rasch estimates for coastal tourism survey
knowledge questions.
Question
number
Total
score
Measure
Standard
Error
Outfit
Zstd
Q 3
3
3.01
0.62
-0.4
Q 4
18
0.59
0.31
0.7
Q 2
32
-0.60
0.28
-0.1
Q 5
32
-0.60
0.28
-1.6
Q 1
52
-2.40
0.35
2.9
The error associated with the Rasch measure for
each of the respondents is larger than the error
associated with the items which is due to the fact
that there are only 5 coastal tourism knowledge
questions and they are spread out along the logit
scale. To increase the effectiveness of the coastal
tourism knowledge questions, more knowledge
questions could be created to measure the levels of
knowledge in between the existing knowledge
questions. As well as being the least difficult
question, question 1 is also the question with an
Outfit Zstd value of 2.9 which is outside the
acceptable range of -2 to 2. The reason question 1
does not appear to fit with the measurement of
respondents’ knowledge related to coastal tourism
may be due to the fact that question 1 is a question
more related to coastal erosion than coastal tourism.
To improve the fit of this question, it would need to
be changed to focus more on coastal tourism.
The Rasch analysis of the sustainable fisheries
knowledge questions (table 6) shows that the most
difficult question is question 1 “What is the kind of
fishing shown in the image below?” and the least
difficult question is question 5 “The picture below
shows a Cod (Gadus morhua) fish. Where does the
KMIS 2019 - 11th International Conference on Knowledge Management and Information Systems
330

Cod species live?” It would be interesting to
establish why the respondents scored so highly on
this question; perhaps due to their proximity to the
North Atlantic. As such it might highlight the
importance of location-specific surveys based on
what is considered common knowledge. It also
highlights its relative lack of usefulness as a
discriminator.
Table 6: Rasch estimates for sustainable fisheries survey
knowledge questions.
Question
number
Total
score
Measure
Standard
Error
Outfit
Zstd
Q 1
2
3.59
0.76
-0.2
Q 8
14
0.91
0.36
0.7
Q 7
23
-0.11
0.33
1.0
Q 2
25
-0.33
0.33
-0.2
Q 9
25
-0.33
0.33
2.1
Q 4
27
-0.55
0.33
-0.6
Q 6
29
-0.77
0.34
-0.7
Q 3
31
-1.01
0.35
0.3
Q 5
34
-1.40
0.37
-0.3
The person-item map for the sustainable fisheries
knowledge questions shows that most of the
questions are grouped below the zero logit point
which means that they are providing measurements
of respondents with medium to low knowledge
levels. Questions 1 and 8 are the only questions
above the zero logit point. Improving the set of
sustainable fisheries knowledge questions as a scale
to measure knowledge related to sustainable
fisheries would involve creating more knowledge
questions to measure those respondents with
medium to high knowledge related to sustainable
fisheries. The positioning of the respondents with
medium to high knowledge of sustainable fisheries
has a larger error than the positioning of those with
medium to low knowledge. This is due to the fact
that there are less questions in the medium to high
knowledge section. The “Outfit Zstd” value for
question 9 is 2.1 which is just outside the acceptable
range for fit. Question 9 relates to the percentage of
the global population that depends on the ocean for
food. A way of attempting to improve this question
could involve adding more specific information to
the wording of the question.
5.4 Question Distractors
The distractor analysis of the micro-plastics
knowledge questions indicated that questions 4 and
7 could be improved. Question 4 is “Sunlight can
degrade plastics in the ocean: true or false?” More
respondents chose the incorrect (false) answer than
the correct answer. This question could be improved
by adding a third option to allow the respondent to
indicate if they are unsure about the answer.
Question 7 is “Where does the majority of our
plastic waste end up?” and less than 5% of
respondents chose the options “Burned for energy”
and “Recycled”. This question could be improved by
removing these answer options and possibly adding
in an option which would successfully attract
respondents who are unsure about the correct
answer.
6 CONCLUSIONS
A person’s level of knowledge on an ocean related
topic, and their attitude and behaviour towards that
topic are important dimensions to measure and can
be used to measure the effectiveness of ocean
literacy and general ocean environmental awareness
related tools and initiatives. An effective approach to
measuring these dimensions involves asking people
to respond to questionnaires or surveys on topics
related to the ocean. There were 3 surveys created in
this research which measure respondent’s
knowledge, attitude, and behaviour related to the
topics of micro-plastics, coastal tourism, and
sustainable fisheries. The data from responses to the
surveys was used to measure the level of knowledge,
attitude, and behaviour possessed by the respondents
in relation to the topics and it was also used to
indicate how the contents of the surveys might be
improved. In this research, the level of knowledge
possessed by the students on micro-plastics, coastal
tourism, and sustainable fisheries was found to be
slightly below medium. A statistically significant
correlation was found between attitude and
behaviour for the 3 topics, but no significant
correlation was found for the relationship between
knowledge and attitude or behaviour. The use of
Cronbach’s alpha analysis, Rasch analysis, and
distractors analysis has provided results which can
be used to improve the effectiveness of the questions
contained in the surveys. This research has
highlighted the difficulty in creating reliable and
consistent survey instruments for relatively narrow
topics.
In future research, it would be useful to apply the
results of the data analysis to a review of the
contents of the surveys with a view to improving the
questions, so that the knowledge which correlates
with a pro-ocean-environmental attitude and
behaviour can be identified. The improved questions
Measuring Individuals’ Knowledge, Attitude and Behaviour on Specific Ocean Related Topics
331

could then be used as a scale to measure the
respondent’s levels of knowledge, attitude, and
behaviour in relation to the topics. The contents of
the surveys could be used to inform the measurable
objectives of the Theory of Change framework
(ToC, 2019). The information required by a
respondent to answer the questions on the
knowledge scale could then be incorporated into the
existing tools created as part of the ResponSEAble
project. Structural Equation Modelling and
Confirmatory Factor Analysis could be used as part
of the process of improving the survey questions by
creating a model of which types of knowledge
related to a topic are factors in the level of pro-
ocean-environmental attitude and behaviour
possessed by respondents.
ACKNOWLEDGEMENTS
We would like to acknowledge the assistance of Dr
Matthew Ashley (University of Plymouth, UK) and
Ms Eleonora Panto (CSP, Italy) in relation to the
content of the surveys.
REFERENCES
Bitly. 2018. Bitly link management system [Online].
Available: https://bitly.com/ [Accessed November 7th
2018].
Bond, T. G. & Fox, C. M. 2007. Applying the Rasch
model: fundamental measurement in the human
sciences, Mahwah, N.J., Mahwah, N.J.: Lawrence
Erlbaum Associates Publishers.
Coastal Tourism. 2018. Coastal tourism key story
[Online]. Available: https://www.responseable.eu/key-
stories/coastal_tourism [Accessed December 12th
2018].
ELL. 2007. Environmental Literacy Ladder [Online].
http://www.fundee.org/facts/envlit/whatisenvlit.htm.
[Accessed February 14th 2018].
Fauville, G., Strang, C., Cannady, M. A. & Chen, Y. F.
2018. Development of the International Ocean
Literacy Survey: measuring knowledge across the
world. Environmental Education Research, 1-26.
Girard, N., Lester, S., Paton-Young, A. and Saner, M.,
2016. Microbeads:“Tip of the Toxic Plastic-berg”?
Regulation, Alternatives, and Future Implications.
Institute for Science, Society and Policy: Ottawa, ON,
Canada, pp.210-230.
Google Forms. 2018. Create online forms with Google
[Online]. Available: https://www.google.com/forms/
about/ [Accessed November 2nd 2018].
Greely, T. 2008. Ocean Literacy and Reasoning About
Ocean Issues: The Influence of Content, Experience
and Morality. University of South Florida.
Michalos, A. C., Kahlke, P. M., Rempel, K., Lounatvuori,
A., MacDiarmid, A., Creech, H. & Buckler, C. 2017.
Progress in measuring knowledge, attitudes and
behaviours concerning sustainable development
among tenth grade students in Manitoba. In
Development of Quality of Life Theory and Its
Instruments. Springer, Cham.
Micro-Plastics. 2018. Micro-plastics and cosmetics key
story [Online]. Available: https://www.responseable.
eu/key-stories/microplastics-cosmetics [Accessed
December 12th 2018].
Microbead Ban. 2018. Australian government expects
voluntary microbead ban to meet deadline [Online].
Available: https://chemicalwatch.com/63983/
australian-government-expects-voluntary-microbead-
ban-to-meet-deadline [Accessed March 22nd 2019].
Ocean Plastic. 2017. Man-made fibres and plastic found in
the deepest living organisms [Online]. Available:
https://www.ncl.ac.uk/press/articles/archive/2017/11/p
lasticocean/ [Accessed March 1st 2019].
Outfit. 2018. What do Infit and Outfit, Mean-square and
Standardized mean? [Online]. Available: https://www.
rasch.org/rmt/rmt162f.htm [Accessed October 3rd
2018].
ResponSEAble. 2015. ResponSEAble project [Online].
Available: https://www.responseable.eu/ [Accessed
March 6th 2018].
Sustainable Fisheries. 2018. Sustainable fisheries key
story [Online]. Available: https://www.responseable.
eu/key-stories/sustainable-fisheries [Accessed
December 12th 2018].
ToC. 2019. Theory of change for community-based
conservation [Online]. Available: https://www.
rare.org/sites/default/files/ToC_Booklet_Final_Rare.p
df [Accessed February 15th 2019].
Trienekens, J. H., Wognum, P. M., Beulens, A. J. M. &
Van Der Vorst, J. 2012. Transparency in complex
dynamic food supply chains. Advanced engineering
informatics, 26, 55-65.
Umuhire, M. L. & Fang, Q. 2016. Method and application
of ocean environmental awareness measurement:
Lessons learnt from university students of China.
Marine Pollution Bulletin, 102, 289-294.
Xanthos, D. & Walker, T. R. 2017. International policies
to reduce plastic marine pollution from single-use
plastics (plastic bags and microbeads): A review.
Marine pollution bulletin, 118, 17-26.
Yoon Fah, L. & Sirisena, A. 2014. Relationships between
the knowledge, attitudes, and behaviour dimensions of
environmental literacy: a structural equation modeling
approach using smartpls. Journal for Educational
Thinkers, 5, 119-144.
KMIS 2019 - 11th International Conference on Knowledge Management and Information Systems
332
