
Open Source Business Intelligence Tools: Metabase and Redash
Bruno Santos, Francisco Sério, Steven Abrantes, Filipe Sá, Jorge Loureiro, Cristina Wanzeler and
Pedro Martins
Escola Superior de Tecnologia e Gestão de Viseu, Instituto Politécnico de Viseu, Viseu, Portugal
Keywords: Business Intelligence, Open Source BI Platforms, BI Software, Metabase, Redash.
Abstract: This electronic document is an article that explores the capabilities of Business Intelligence tools, primarily
their ability to analyze generated business data gathered from a company. These corporations can improve (or
even create) their products according to the insights provided by these platforms, with the possibility of
outclassing their direct competitors, something to be proved crucial for an ever-evolving market. In this article,
we have tested and compared two of the most promising open-source BI platforms currently available: these
are Metabase and Redash. Our focus is to analyze what they offer as a package, where we defined some key
points, such as: overall performance, search engine compatibility, key features, etc. May we remind that the
implementation of a platform of choice, concerning BI software, may vary according to company demands.
Some tools may be more suitable for a corporation, while others may be the best choice for a different entity.
1 INTRODUCTION
In recent years, technology has grown in the
innovation component on a tremendous scale. G. R.
Gangadharan and S. N. Sundaravall (Gangadharan
and Sundaravall, 2004) wrote that: “Managing an
organization requires access to information in order
to monitor activities and assess performance”.
However, one of the current realities is that there
are still business owners who use Excel sheets and
paper records to track business development and
record data. Neil Raden (Raden, 2005) acknowledged
this by stating: “There are over 150 million business
users of Excel worldwide, and a large proportion of
them are devoted, at least part of the time, to entering
data by hand, extracting data manually from other
systems and functioning as report servers”.
These owners maintain a high level of confidence
in these methods which, unfortunately, ends up
revealing how much of a "closed mindset" they have
when it comes to adopting new strategies.
The necessity of a platform for decision support is
rapidly increasing, especially if it’s a large business
we’re speaking of. We must consider that with the
amount of data stored by companies growing
exponentially, it comes to no surprise that finding a
more efficient data management solution should be at
the top of these industry owners’ priority list. Chandra
Nandyala and Haeng-Kon Kim (Nandyala and Kim,
2016) wrote: “Data needs to be secure, and its
distribution must be done efficiently so that important
and up-to-date business decisions are made. In
today’s world, the way to store and retrieve or access
personal as well as other information has captured a
massive revolution”.
To resolve this matter, the concept of Business
Intelligence started to gain more traction, although it
wasn’t quite study yet. Bernhard Wieder and Maria-
Luise Ossimitz (Wieder and Ossimitz, 2015) stated
that: “Business Intelligence (BI) systems have been a
top priority of CIOs for a decade, but little is known
about how to successfully manage those systems
beyond the implementation phase”.
Undeniably, it’s critical for companies that
gathered data is translated into information for
planning future business strategies. For a lot of these,
valuable data is stored on large-scale servers, the so-
called clusters. Ideally, this stored data should
provide information on sales trends, consumer
behaviors, and resource allocation.
And for this reason, the market started to appraise
Business Intelligence, investing more into these
systems. William Yeoh and Andy Koronios (Yeoh
and Koronios, 2010) wrote that: “(The) BI market
appears vibrant and the importance of BI systems is
more widely accepted, few studies have investigated
the critical success factors that affect the
implementation success”.
Santos, B., Sério, F., Abrantes, S., Sá, F., Loureiro, J., Wanzeler, C. and Martins, P.
Open Source Business Intelligence Tools: Metabase and Redash.
DOI: 10.5220/0008351704670474
In Proceedings of the 11th International Joint Conference on Knowledge Discovery, Knowledge Engineering and Knowledge Management (IC3K 2019), pages 467-474
ISBN: 978-989-758-382-7
Copyright
c
2019 by SCITEPRESS – Science and Technology Publications, Lda. All rights reserved
467

Company data can indicate the viability of a given
product and determine key indicators for potential
future expansion and/or growth. In this way, data can
help maximize revenues and reduce costs.
Currently, huge organizations are adopting BI
systems in the field of Information Technology that
are able of operations such as extract data, convert
what was collected into understandable values, and
then cram those into the platform, being then able to
fully analyze the given data.
Mihaela Muntean and Traian Surcel (Muntean
and Surcel, 2013) state that: “Traditional BI systems
use ETL tools for extracting data from multiple
sources and temporarily storing those datasets at a
staging area. Organizations use data warehouses to
aggregate cleaned and structured data”.
Another relevant area that should be mentioned is
IoT (Internet of Things). According to In Lee and
Kyoochun Lee (Lee and Lee, 2015): “IoT devices and
machines with embedded sensors and actuators
generate enormous amounts of data and transmit it to
business intelligence and analytics tools for humans
to make decisions. These data are used to discover
and resolve business issues - such as changes in
customer behaviors and market conditions - to
increase customer satisfaction, and to provide value-
added services to customers”. They further expand
stating: “Business analytics tools may be embedded
into IoT devices, such as wearable health monitoring
sensors, so that real-time decision making can take
place at the source of data”.
The remainder of this article will be structured as
follows: section II dives more into what Business
Intelligence stands for while correlating with the topic
of open-source technologies, also expanding on the
technologies to be tested; section III describes the
experimental setup used to perform tests on the open-
source BI platforms in study, e. g., utilized hardware;
section IV displays the obtained results derived from
testing; and in section V we present our conclusions,
adding a perspective for our future work.
2 STATE OF ART
A. Business Intelligence
It’s primarily in the data analysis component that
Business Intelligence (also known by the
abbreviation BI) tools materialize. According to
Solomon Negash and Paul Gray (Negash and Gray,
2008): “Business Intelligence (BI) is a Data-Driven
Decision Support System (DSS) that encompasses
data collections, data storage, and curriculum
management to facilitate entry into the decision-
making process. (...) Business Intelligence is an
analysis of large volumes of data about a company
and its operations. Includes competitive intelligence
(customer concentration) as a subset. In computing
environments, a large database, such as a data
warehouse or data mart, is used as a source of
information and as a database for the sophisticated
ones. Reads range from receiving the "data slices",
will receive an ad hoc review, a real-time analysis and
a forecast. (...) Recent developments in this area
include business performance analysis (BPM),
business activity monitoring (BAM) and BI
expansion of your workforce for people across the
organization (BI for the masses). In the longer term,
BI techniques and discoveries are embedded in
business processes”.
This line of thought is expanded by Hugh J.
Watson and Barbara H. Wixom (Watson and Wixom,
2007), as they imply: “(…) BI reduces IT
infrastructure costs by eliminating redundant data
extraction processes and duplicate data housed in
independent data marts across the enterprise. (…) BI
also saves time for data suppliers and users because
of more efficient data delivery”.
Likewise, Marcus Gibson, David Arnott and Ilona
Jagielska (Gibson, Arnott and Jagielska, 2004) state
that: “The role of BI is to extract the information
deemed central to the business, and to present or
manipulate that data into information that is useful for
managerial decision support. In their simplest form,
these tools permit a decision maker to access an up to
date, often consolidated, view of business
performance.”
The concept of Business Intelligence can be
traced back to the early 90’s, according to Matteo
Golfarelli, Stefano Rizzi and Iuris Cella (Golfarelli,
Rizzi and Cella, 2004): “BI was born within the
industrial world in the early 90’s, to satisfy the
managers’ request for efficiently and effectively
analyzing the enterprise data in order to better
understand the situation of their business and
improving the decision process. In the mid-90’s BI
became an object of interest for the academic world,
and ten years of research managed to transform a
bundle of naive techniques into a well-founded
approach to information extraction and processing”.
BI has seen a rise in popularity in the Northern
Europe region, according to Mika Hannula and Virpi
Pirttimaki (Hannula and Pirttimaki, 2003): “Business
Intelligence activities have recently become much
common in Finland. It is common knowledge that
large-scale companies operating in a global
marketplace – especially in the ICT sector – do put
effort into sophisticated BI activities”.
KDIR 2019 - 11th International Conference on Knowledge Discovery and Information Retrieval
468

Similar to an OLAP (On-Line Analytical
Processing) tool, BI is integrated in the Data Access
Tools stage of an Data Warehouse platform. As
pointed out by Dr. Jawahar Babu (Babu, 2012): “The
data warehouse is the significant component of
business intelligence. It is subject oriented,
integrated. The data warehouse supports the physical
propagation of data by handling the numerous
enterprise records for integration, cleansing,
aggregation and query tasks. It can also contain the
operational data which can be defined as an
updateable set of integrated data used for enterprise
wide tactical decision-making of a particular subject
area. It contains live data, not snapshots, and retains
minimal history”.
Supporting this claim are Barbara H. Wixom and
Hugh J. Watson (Wixom and Watson, 2010), when
mentioning people who work on Data Warhouse
systems: “A variety of stakeholders play essential BI
roles. Extraction, Transformation and Loading (ETL)
experts, data modelers and database administrators
focus on preparing the data warehouse for use”.
So, subsequently, we can safely assume that
software provided by technologies in the BI
department is fulfilling a lot of the criteria present in
the current market. As stated by Joaquim Lapa, Jorge
Bernardino and Ana Figueiredo (Lapa, Bernardino
and Figueiredo, 2014): “(…) we consider the
presence of Collaborative Technologies in BI
platforms will be a requirement for organizations
(…)”.
The possibilities that BI reports offer, whether for
their clearly understandable information, or for their
facilitated interaction, coupled with intuitively
designed dashboards for a more assessed evaluation
from the user, makes Business Intelligence a “must”
in order to organizations have a thriving future.
B. Open source BI
We’ve seen so far how promising Business
Intelligence software is, but most of the tools out
there are “locked” behind a monthly subscription fee,
tools that are only within the realm of larger
corporations. But what about smaller firms? These
organizations may not have the economic capabilities
to afford a tool that may cost more than 5000$ per
month.
Thankfully, there has been a notable ascension in
BI platforms that are open source. And contrary to
what you may think, these are no slouch either. Karim
Lakhani and Eric von Hippel (Lakhani and von
Hippel, 2004) state that: “Open source software
products represent the leading edge of innovation
development and diffusion systems conducted for and
by users themselves – no manufacturer required”. The
question here is, why use open source BI platforms?
Well, to answer that, we must briefly discuss the
benefits of open source.
One of the most prominent reasons to “go open”
is how you can access an application developed by a
“team” of talented people, with the release of several
stable versions, and be instructed how to use it with
the help of pages of detailed online documentation
they have created, available to the general public.
Chris Coppola and Ed Neelley (Coppola and Neelley,
2004) claim that: “New versions are released very
often and rely on the community of users and
developers to test it, resulting in superior quality
software tested on more platforms, and in more
environments than most commercial software”.
Other benefit resides in the fact that you may be
able to customize (depending on a license) the
application to suit your needs, or the company’s.
Brian Fitzgerald (Fitzgerald, 2006) stated that: “High-
profile organizations like Amazon, Google and
Salesforce.com take advantage of the reliability and
low cost of open source to create a platform on which
they can offer value-added services in their own
business domains. (…) These companies also
customize open source products to suit their internal
needs”.
Lastly, we must not forget what makes these
applications open source, the price. Or rather, the lack
of it. A big reason that attracts customers and
companies alike is the fact that you don’t have to pay
for the software whilst having a well-supported app
by the community that is also able to combine
proprietary technology with open source technology.
InduShobha Chengalur-Smith, Saggi Nevo and
Pindaro Demertzoglou (Chengalur-Smith, Nevo and
Demertzoglou, 2010) concluded that: “(…)
compatibility of the open source technology with the
existing technology infrastructure creates an
environment that promotes use of the technology and
increases the opportunity for realizing business
value”.
The open source model has proven itself to be as
crucial as it is viable and combining this with
Business Intelligence may possibly give us a
powerful tool that is within the reach of both smaller
and larger companies.
C. Metabase
Metabase is an open source tool that allow people in
a company to ask questions and learn from data
descendant from data sources. This software allows
filter and/or group data according to user needs,
without resorting to Structured Query Language
(SQL). If needed, Metabase also provides with a SQL
interface for users.
Open Source Business Intelligence Tools: Metabase and Redash
469
This tool has a functionality that monitors
questions created by users to gain insights on the
available data. These questions can produce graphs and
charts, and these visualizable results can be saved and
organized in Dashboards.
The Metabase platform is available under three
types of licences: AGPL, which is free of costs,
Premium Embedding License, with acquisition costs
(includes a White labeled Embedding option), and
Metabase Commercial License, with acquisition costs
(offers more functionalities not present in the previous
mentioned license). For this project, we used the free
v0.32.7 version of Metabase.
D. Redash
Redash is an open source platform that lets a user
connect and query his data sources by browsing the
existing schemas through the usage of an incorporated
SQL editor. Available also is an option to schedule data
sources refresh times.
A user can visualize data by building dashboards
with graphs and charts, by simply dragging and
dropping them. These dashboards can be shared within
the company with other users or can be shared publicly.
The Redash platform is available in two models:
free and paid. Within the paid model there are three
types of packages: Starter, Pro, and Business, where
the key difference between these three is the number of
data sources, dashboards, saved queries and maximum
query execution times allowed. For this project, we
used the free v7.0.0 version of Redash.
3 EXPERIMENTAL SETUP
With this project, we wish to demonstrate the potential
of the Business Intelligence tools under study, by
querying the data present in databases, which will be
connected to the BI tools, and transform that data into
easily perceived dashboards and/or graphs to
demonstrate how they allow us to identify patterns and
facts of potential relevance. These created graphics are
entirely dependent on the capabilities of the tool. The
queries will be made in the same way for either.
In order to carry out the desired tests, databases
were set up with large amounts of data coming from a
search engine of our choice. These databases are stored
on personal computers, meaning that they are not
present in the cloud.
The search engine in question is MySQL, since it
is compatible with both of the Business Intelligence
tools. This proved to be beneficial for us, since we have
experience working with this search engine, whilst
having an idea of the capabilities of it. Although, we
must mention that it was not our first choice.
We initially thought of using PostgreSQL, but we
found issues when trying to insert more than 20
million rows with the inclusion of indexes (this
subject will be expanded further). So, we resorted to
MySQL instead, a search engine we had work with
during our scholar years, which proved to be capable
of handling these large datasets, both with indexes
and without them.
To generate the data that would populate our
MySQL databases, it was necessary to use the TPC-
H tool. This tool allowed us to generate data on the
threshold of Gigabytes, which are fragmented into 8
TBL files. In order to insert the data in the tables
directly into the search engine, it was necessary to
convert the files in TBL format to CSV format.
The two databases used have the same tables:
Orders, Lineitem, Customer, Supplier, Part, Partsupp,
Nation and Region, as they have the same number of
records in them:
Region: 5 rows.
Nation: 25 rows.
Supplier: 80 thousand rows.
Customer: 1,2 million rows.
Part: 1,6 million rows.
Partsupp: 6,4 million rows.
Orders: 12 million rows.
Lineitem: 48 million rows (aprox.).
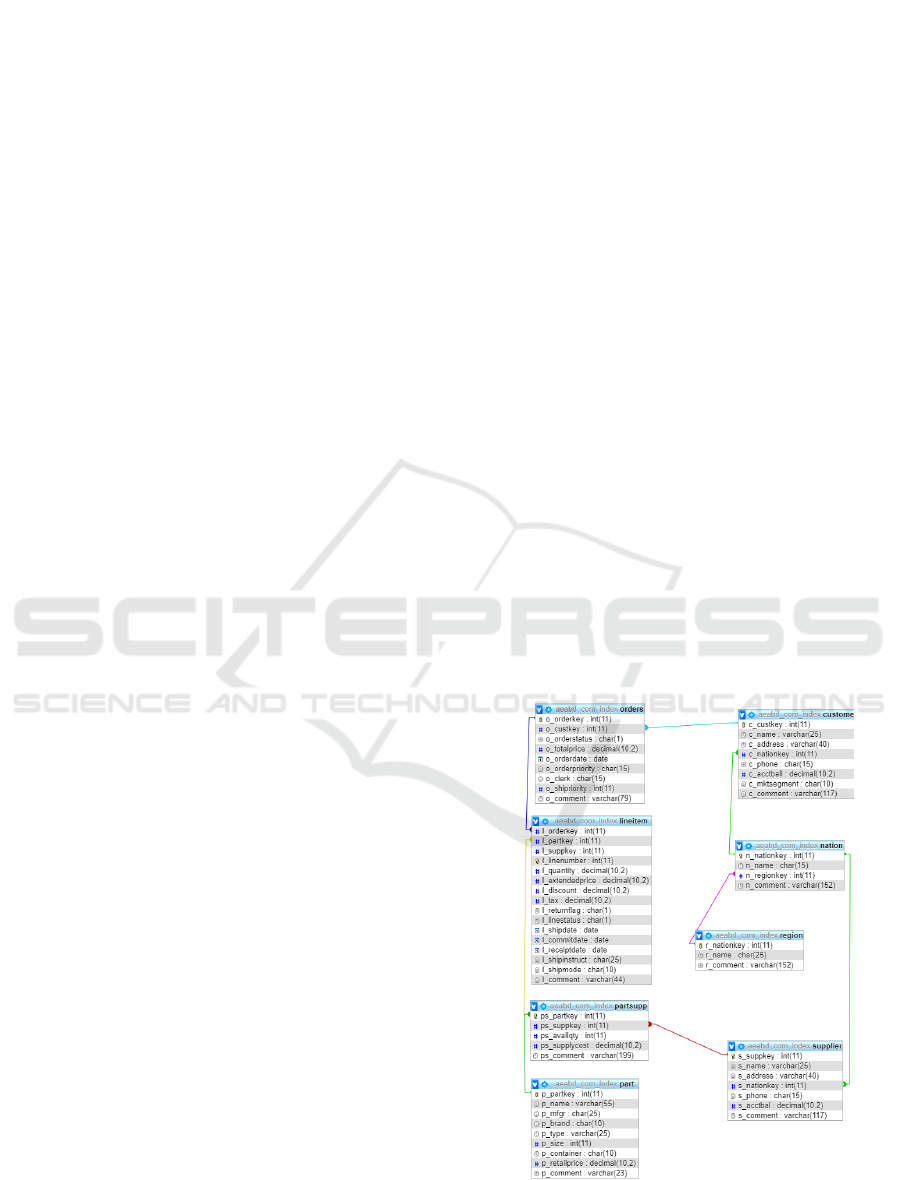
Figure 1: Schematic of the used tables (with index
example).
KDIR 2019 - 11th International Conference on Knowledge Discovery and Information Retrieval
470
In the above available Fig.1 we present the
schema, created using a tool present in MySQL, that
includes the tables and relations shared by the two
databases.
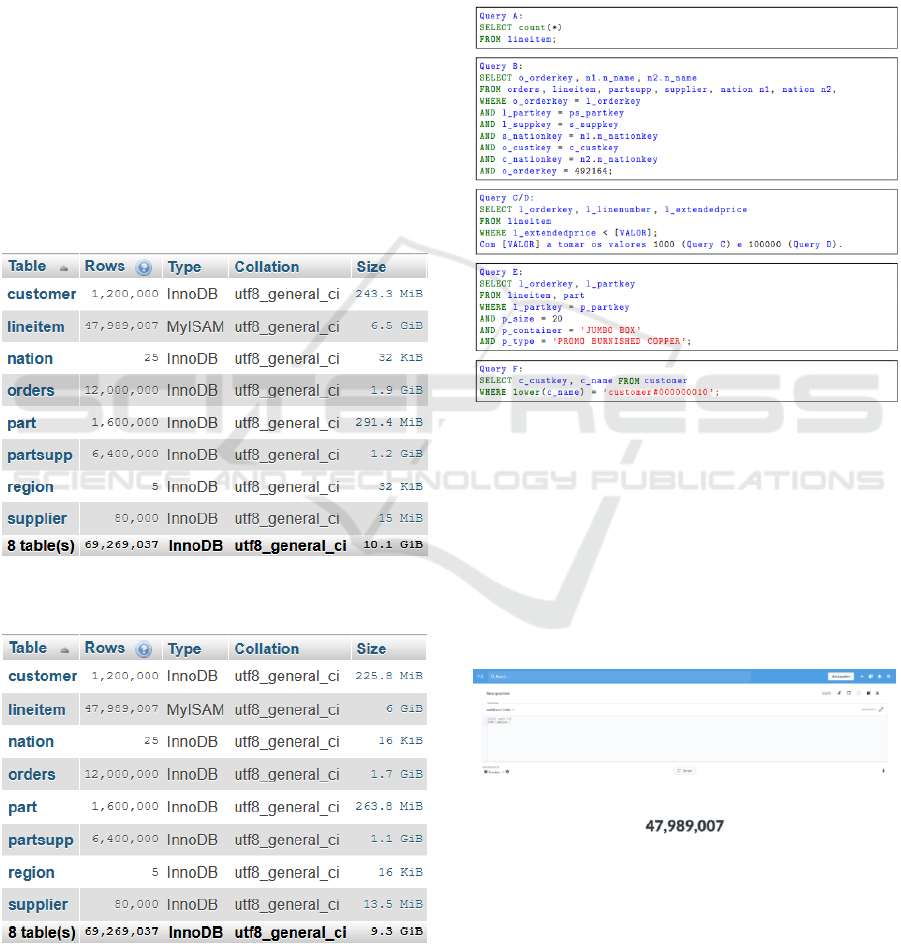
The key difference between the two is that
indexes have been created in one of the databases.
This implies that the index database will have a larger
size than the non-index database. The Database with
indexes has a total of 10.1 Gigabytes of data, while
the indexless DB totals at 9.3 Gigabytes, as can be
seen in Fig. 2 and Fig. 3.
It is intended to compare databases without
indexes directly with the DB with indexes to verify if
there are any differences between the Business
Intelligence software regarding the processing of
queries made, more specifically, what are the
response times.
All test queries made in the Business Intelligence
tools and the MySQL search engine were performed
using two laptops with the same CPU: Intel i7-8750H
Figure 2: Database Tables with Indexes (Action tab
removed).
Figure 3: Database Tables without Indexes (Action tab
removed).
Hexa-Core, with a base clock of 2.2 GHz, max
clock of 4.1 GHz and 9 MB of Cache. A third
computer was used to house the tools described in this
study. The computer has a different CPU than the
previously described laptops: Intel i7-4710HQ Quad-
Core, with a base clock of 2.5 GHz, max clock of 3.5
GHz and 6MB of Cache.
Finally, Fig. 4 shows the queries that will serve as
a test for what we will search for in both BI softwares.
Figure 4: Test Queries.
4 RESULTS
By using the SQL Editor in each of the Business
Intelligence tools, the SQL queries mentioned in the
previous chapter were performed. Fig. 5 and Fig. 6
show the software editors used in the context of our
project in its fullness.
Figure 5: Metabase SQL Editor.
After querying the data using the Business
Intelligence tools without index and with index, as
desired, the query execution times were recorded, as
well as graphs were created using the results obtained
by the queries in the respective tools, with the purpose
of exploring their potential in this field.
Open Source Business Intelligence Tools: Metabase and Redash
471
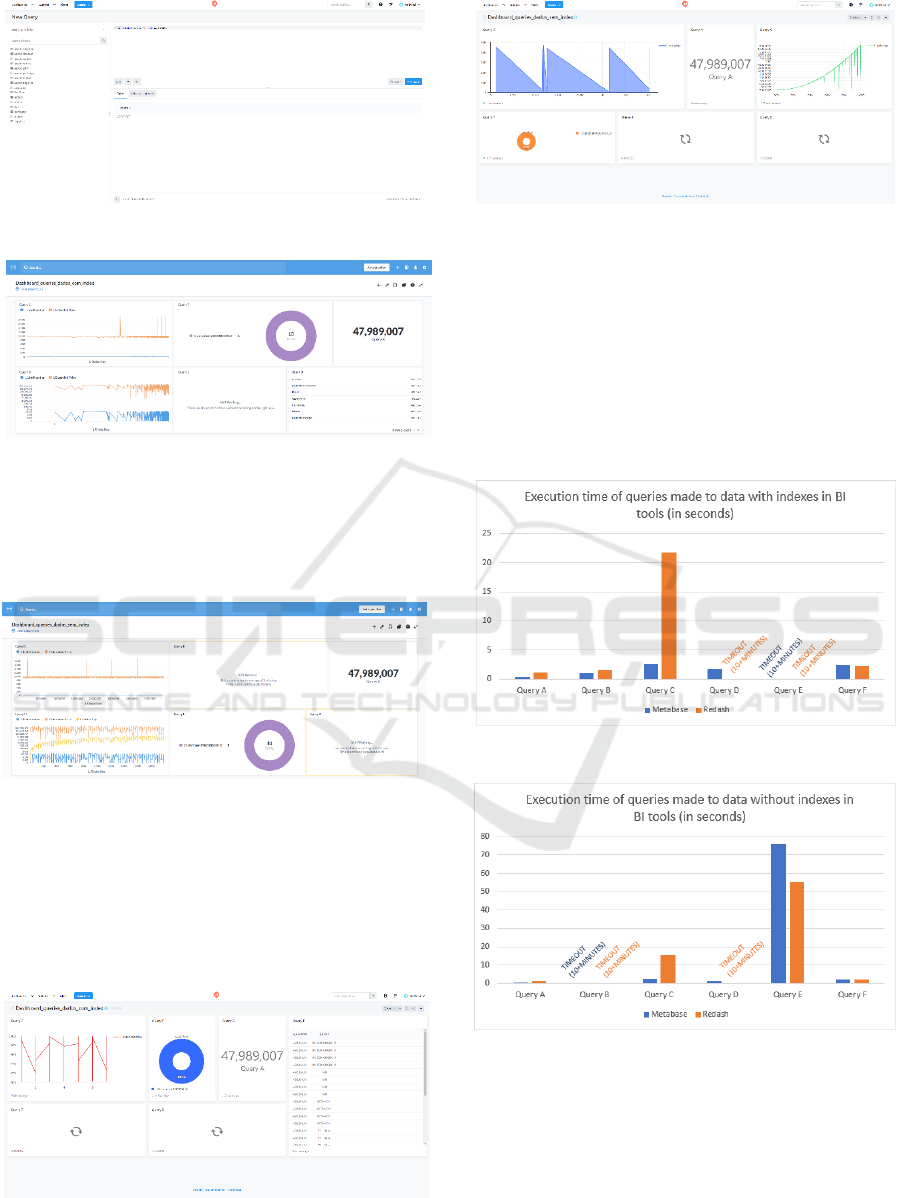
Figure 6: Redash SQL Editor.
Figure 7: Metabase’s Dashboard of data with indexes.
The dashboards created in Metabase can be found
in Fig. 7 and Fig. 8, where the first figure corresponds
to the index data dashboard, while the second is
related to the data without index.
Figure 8: Metabase’s Dashboard of data without indexes.
Similarly, the dashboards created in the BI
Redash tool are shown in Fig. 9 and Fig. 10, where,
according to the previously shared line of thought, the
first figure corresponds to the dashboard of the index
data, while the second corresponds to the data without
index.
Figure 9: Redash’s Dashboard of data with indexes.
Figure 10: Redash’s Dashboard of data without indexes.
In order to analyze the obtained results, in the
execution times of the SQL queries component,
charts were created where it’s possible to make a
direct comparison of Metabase with Redash,
regarding the time that each query took to return the
result.
This is true for both the indexed data, Fig. 11, as
well as for the non-indexed data, Fig. 12.
Figure 11: Chart of query results with indexes.
Figure 12: Chart of query results without indexes.
Based on the results obtained, we can draw the
following conclusions:
The query B, in the data without index, was not
able to return any result, both in Metabase and in
Redash.
KDIR 2019 - 11th International Conference on Knowledge Discovery and Information Retrieval
472

Contrary to the previous point, in the indexed
data, the query returned results in both tools, both
of which took less than 2 seconds.
Interestingly, inversely to query B, query E, in
indexed data, was unable to return results either
in Metabase or Redash, returning only on non-
indexed data, where Redash took less time to
return information.
In query D, for both indexed and non-indexed
data, Redash was unable to obtain any kind of
information.
In query C, Redash took more time than Metabase
to return information, either for data with indexes
or data without them.
In queries A, C and F, response times between
index and non-index data showed no significant
changes.
It’s particularly interesting to note that in
Metabase, although query E has returned data,
since it took more than 60 seconds to process it,
the dashboard failed to display information about
it.
5 CONCLUSIONS
With this article, we have analyzed BI in its essence
by conducting several tests with big amounts of data.
We found that the core definition of BI is mostly
shared by several authors, defining Business
Intelligence as a process where data is gathered,
stored and transformed into information through
analysis, and where information is transformed into
knowledge that, ultimately, aids on the decision
making side of organizations.
Developing on the topic of indexing, the results
indicate that, for more general queries, where, in the
most specific cases, ranges of values are specified
(WHERE clause), there is a considerable difference
that justifies the use of indexes. However, the biggest
difference comes in the form of the JOIN clauses,
where it’s evident that the usage of indexes on table
columns is noticeable in terms of performance. We
recommend using indexes if a Business Intelligence
expert is required to use queries with a JOIN clause.
Mentioning the results obtained in the execution
of query B, as a reference point, it was noticed that,
without the use of indexes, the query was not able to
return results, however, with the use of these, the
query returned data in a matter of seconds. It’s in this
perspective that, although the indexes imply an
increase in size of the data present in tables, we
recommend the implementation of these.
Speaking of user experience, the BI Metabase and
Redash tools did not show a huge learning curve. The
intended functionalities are located and organized in
a very explicit way, and the documentation of the
tools, when they were consulted, provided a good
level of clarification.
Table 1: Comparison of integrations and search engines
supported between Metabase and Redash.
Redash
Metabase
MySQL
PostgreSQL
MongoDB
Microsoft SQL
Server
AWS Redshift
Google BigQuery
Druid
H2
X
SQLite
X
Oracle
Crate
X
Google Analytics
Vertica
Spark
X
Presto
Snowflake
Amazon Athena
X
Amazon Aurora
X
Amazon Redshift
X
Amazon DynamoDB
X
Axibase TSDB
X
Cassandra
X
ClickHouse
X
Druid
X
ElasticSearch
X
Graphite
X
Greenplum
X
Hive
X
Impala
X
InfluxDB
X
MemSQL
X
Rockset
X
ScyllaDB
X
Snowflake
X
TreasureData
X
Total:
31
16
In terms of resource usage, Metabase has proved
to be a more dependent tool regarding the hosted
machine’s hardware than Redash. The percentage of
CPU and Hard Drive utilization in Metabase reached
Open Source Business Intelligence Tools: Metabase and Redash
473

26% and 92%, respectively, while Redash reached
12% and 76%, respectively.
In the compatibility side of things, Redash offers
a greater number of integrations and compatible
search engines, as it can be seen in the following
table.
Of these documented search engines, integrations
were tested only for with PostgreSQL and
MySQL, with the later being used due to issues
with PostgreSQL mentioned in the Experimental
Setup chapter.
For future work, we intend to test these Business
Intelligence tools using NoSQL search engines, e. g.,
MongoDB, supported by both Metabase and Redash,
in the Internet of Things (IoT) area. Data generated
by IoT devices is generally stored in these type of
Database Management Systems (DBMS), and, as we
mentioned in the State of Art chapter, IoT is one of
Business Intelligence’s most important areas of
actuation currently.
Likewise, we intend to test these BI platforms on
machines with more powerful specifications than the
computers used in this project, in order to verify the
differences in response times between databases with
configured indexes and databases without indexes.
Finally, although we have used some charting
options provided by these BI tools, we believe there
is margin for further exploration of these options in a
future approach.
ACKNOWLEDGEMENTS
This work is financed by national funds through FCT
- Fundação para a Ciência e Tecnologia, I.P., under
the project UID/Multi/04016/2019. Furthermore we
would like to thank the Instituto Politécnico de Viseu
and CI&DETS for their support.
REFERENCES
Gangadharan, G. R., & Swami, S. N. (2004, June). Business
intelligence systems: design and implementation
strategies. In 26th International Conference on
Information Technology Interfaces, 2004. (pp. 139-
144). IEEE.
Raden, N. (2005). Shedding light on shadow IT: Is Excel
running your business. DSSResources. com, 26.
Nandyala, C. S., & Kim, H. K. (2016). From cloud to fog
and IoT-based real-time U-healthcare monitoring for
smart homes and hospitals. International Journal of
Smart Home, 10(2), 187-196.
Wieder, B., & Ossimitz, M. L. (2015). The impact of
Business Intelligence on the quality of decision
making–a mediation model. Procedia Computer
Science, 64, 1163-1171.
Yeoh, W., & Koronios, A. (2010). Critical success factors
for business intelligence systems. Journal of computer
information systems, 50(3), 23-32.
Muntean, M., & Surcel, T. (2013). Agile BI-The Future of
BI. Informatica Economica, 17(3).
Lee, I., & Lee, K. (2015). The Internet of Things (IoT):
Applications, investments, and challenges for
enterprises. Business Horizons, 58(4), 431-440.
Negash, S., & Gray, P. (2008). Business intelligence.
In Handbook on decision support systems 2 (pp. 175-
193). Springer, Berlin, Heidelberg.
Watson, H. J., & Wixom, B. H. (2007). The current state of
business intelligence. Computer, 40(9), 96-99.
Gibson, M., Arnott, D., Jagielska, I., & Melbourne, A.
(2004). Evaluating the intangible benefits of business
intelligence: Review & research agenda.
In Proceedings of the 2004 IFIP International
Conference on Decision Support Systems (DSS2004):
Decision Support in an Uncertain and Complex
World (pp. 295-305). Prato, Italy.
Golfarelli, M., Rizzi, S., & Cella, I. (2004, November).
Beyond data warehousing: what's next in business
intelligence?. In Proceedings of the 7th ACM
internaional workshop on Data warehousing and
OLAP (pp. 1-6). ACM.
Hannula, M., & Pirttimaki, V. (2003). Business intelligence
empirical study on the top 50 Finnish
companies. Journal of American Academy of
Business, 2(2), 593-599.
Babu, K. V. S. N. (2012). Business intelligence: Concepts,
components, techniques and benefits. Components,
Techniques and Benefits (September 22, 2012).
Wixom, B., & Watson, H. (2010). The BI-based
organization. International Journal of Business
Intelligence Research (IJBIR), 1(1), 13-28.
Lapa, J., Bernardino, J., Figueiredo, A. (2014). A
comparative analysis of open source business
intelligence tools.
Lakhani, K. R., & Von Hippel, E. (2004). How open source
software works:“free” user-to-user assistance.
In Produktentwicklung mit virtuellen Communities (pp.
303-339). Gabler Verlag.
Coppola, C., & Neelley, E. (2004). Open source-opens
learning: Why open source makes sense for education.
Fitzgerald, B. (2006). The transformation of open source
software. MIS quarterly, 587-598.
Chengalur-Smith, I., Nevo, S., & Demertzoglou, P. (2010).
An empirical analysis of the business value of open
source infrastructure technologies. Journal of the
Association for Information Systems, 11(11), 708.
Metabase. (2019). Retrieved from https://metabase.com/
Redash helps you make sense of your data. (2019).
Retrieved from https://redash.io/
KDIR 2019 - 11th International Conference on Knowledge Discovery and Information Retrieval
474
